
DEW4.3. Get Earth Images
Skip to Summary of Earth Image Resources
Relatively close-up images of Earth for monitoring of Earth systems are available through aerial photography (as seen in PicturePost in 3.1 Observe Changing Vegetation and investigation 4.1 Aerial Photography)
In investigation 4.2 The View from 400 Miles Up we have taken look at Google Earth which collects, prepares and displays images from many sources, including Earth orbiting satellites, aerial photographers in airplanes with special high resolution cameras, kites, balloons, and drones. Some of the imagery comes from city or state governments. The age of images for any particular surface area ranges between 6 months and 5 years.
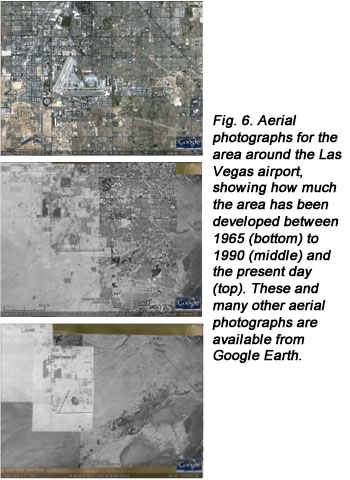
Google Earth is a nice and easy-to-use source to check for and view aerial photographs. To see these images, launch Google Earth (GE) and zoom into an area of interest. Click on the clock icon at the top of the GE window to open a slider bar. You can use the slider bar to view aerial photographs for your area. Although you cannot download actual images from Google Earth, you can make screen shots of your area and use the images in DEW projects (Fig. 6).
Aerial photographs have been used by cartographers for over 100 years to prepare maps, and more recently by planners and government agencies to monitor the landscape. Aerial photographs are obtained using special cameras mounted in the nose or underside of an aircraft that then flies back and forth in patterns or swathes across the area to be surveyed. Aerial photographs have advantages over ground-based observations by providing a birds eye view of an area that can help viewers see connections among land features and conditions such as the extent of damage from a storm, a clear cutting, or even whether or not large agricultural fields are in use or fallow.
Some difficulties arise in using aerial photographs because 3-dimensional objects on the ground may be distorted (known as radial distortion) and the size of pixels change from the center of photograph where the camera is pointing directly down to the edges where the camera captures the features at an increasingly large angle. Aerial photographs differ from satellite images in that the spatial resolution of the photograph is determined partially by the height above the ground at which the photographs were taken, making it challenging to create a series of pictures that can be analyzed together as a time-series.
The National Aerial Photography Program (NAPP) coordinated by the USGS originally to update their togographic maps, acquires and rectifies aerial photographs nationally on a 5-7 year basis following a strict set of protocols. These and other national sources of aerial photographs are available for little or no charge from the USGS. Individual states may also provide aerial photographs and it is worth a web search to locate these resources.
Satellite Images
For decades, specialized instruments onboard satellites have been taking images of Earth remotely. The Earth science community uses satellite imagery for research and monitoring of conditions on the ground. There are large repositories of satellite images.
Satellites launched by NASA and agencies in other countries take snapshots of the same areas on Earth repeatedly, thereby providing a record of change. Imagery of the Earth’s surface is used in a broad range of applications such as regional and global change models, monitoring water quality in lakes and the coastal oceans, and for detecting fires in remote forests or other lands. Dozens of imagery products are available to the public at costs ranging from no cost for NASA data to thousands of dollars for the services of private companies to collect specific images for their customers. Imagery is collected at different spatial and temporal scales providing a range of options to support many studies. For DEW, Landsat and Terra / Aqua are the platforms of choice for no-cost satellite imagery for studying small to large-scale landscape processes.
Landsat Images
The first Landsat satellite was launched in 1972 as the Earth Resources Technology Satellite and later renamed Landsat 1. The launch of Landsat introduced a new era of terrestrial satellite remote sensing that continues today. Currently, two Landsat satellites are in operation: Landsat 5 Thematic Mapper (TM) launched in 1984 and Landsat 7 Enhanced Thematic Mapper Plus (ETM+) launched in 1999.
Sensors aboard Landsat record data at different spectral bands at a pixel size capable of resolving surface characteristics at relatively high spatial resolution. Data are collected at regular time intervals that allow for the analysis of vegetation features in both time and space.
A large archive of Landsat imagery is available from the US Geological Survey (USGS). Previously, Landsat images carried a cost of around $650 apiece, but the agency has agreed to make all Landsat data available for no charge. The repeat cycle for Landsat is 16 days, so every location on Earth could potentially have dozens of images. However, clouds prevent the sensor from seeing through to the ground and cloudy images are not of high quality for observation or analysis. Other errors such as missing scans or sensor problems are not uncommon. Users must browse through the images to find which ones are good and which ones are not. Full Landsat scenes are large and can be unwieldy to manipulate. Full scenes are often unnecessary to get information for a small study area. In addition, before scenes can be used together to quantify change, a good bit of pre-processing is necessary by the user to make sure the images line up exactly and data are consistent across scenes.
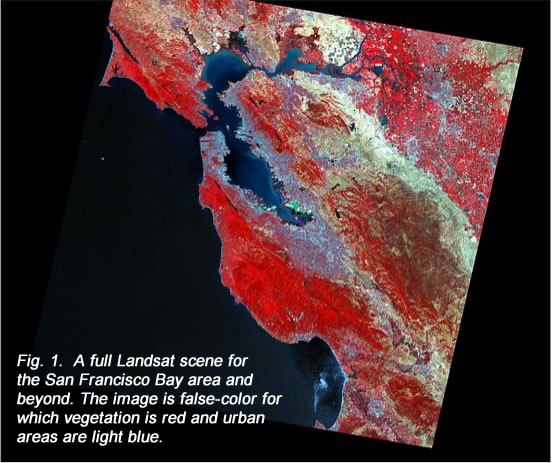
For these reasons, the University of New Hampshire’s EOS-WEBSTER data system provided Digital Earth Watch with a set of high quality Landsat scenes at two time periods roughly 10-years apart; 1990 and 2000, for the entire USA including Alaska and Hawaii (Fig.1).
These images were generated by NASA’s Commercial Remote Sensing Program, a cooperative agreement with industry that created a global set of high-quality, relatively cloud-free orthorectified (geometrically corrected) imagery from Landsat.
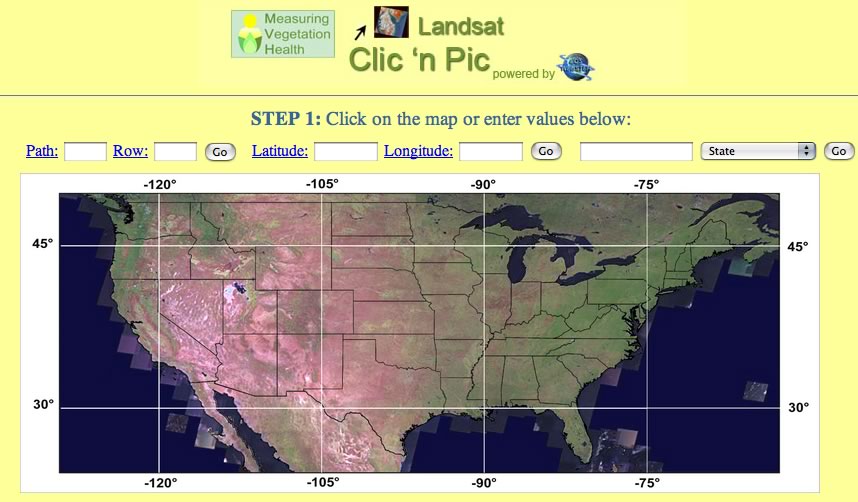
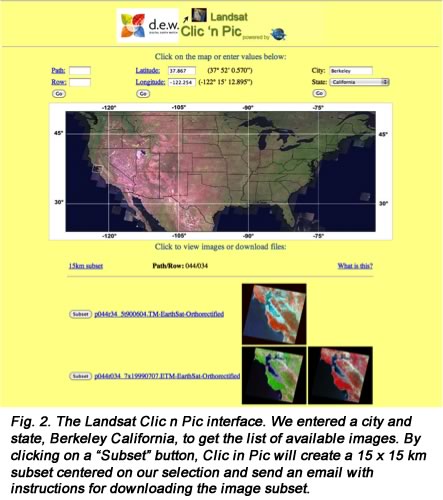
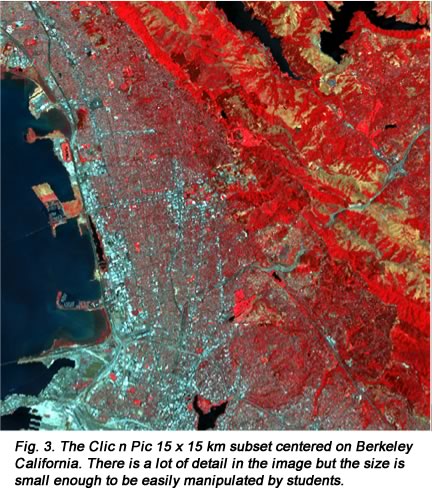
Landsat “Clic n Pic” Scenes were obtained through the Landsat Clic n Pic application that was developed by EOS-WEBSTER (see https://ui.adsabs.harvard.edu/abs/2002AGUFMOS51B0153S/abstract) Both full Landsat scenes and 15 km subsets were obtained from the Clic n Pic application on the DEW website. Users of Clic n Pic chose an area by clicking on a map, entering a city and state, or typing in the latitude and longitude of their location (Fig. 2). The last two methods of entering a site location were handy for generating image subsets because the subsetted image created would be centered on the entered location (Fig. 3, below). Two or more image subsets would overlay each other correctly to be directly compared and analyzed for changes with image processing software.
The Clic n Pic included all of the information known as metadata needed to properly use the data. Specific information about the time and location of when and where the image was obtained are obvious examples of important metadata. It would not make sense to combine an image of Massachusetts with one of Alaska. Less obviously, quantitative analyses of images from the same location that aren’t co-registered, that is to say, don’t overlay each other exactly, would not be scientifically valid.
DEW provided free access to Landsat images for studying terrestrial characteristics such as the extents of forested and non-forested areas or for comparing the health of vegetation through spectral analysis using image processing software. By combining spectral bands into true-color and false-color images, features on the landscape and significant changes during the 10-years between images can easily be observed and measured.
Changes in the landscape such as new roads and developments are also easily identifiable using Landsat. Images can be used for introductory studies in remote sensing of the environment, the basics of image processing and spectral analysis, and for change-over-time.
Despite the difficulties in processing and using other Landsat data, newer images can be visually compared with Clic n Pic scenes and features such as forest extent, new roads or development can be measured in each image and assessed for changes that have taken place.
Landsat has the following characteristics:
- Moderate spatial resolution (nominally 30 m to 60 m for the thermal band);
- Spectral resolution over 7 relatively broad spectral bands in the visible (blue, green, red) and infrared regions (near-IR, 2 mid-IR bands, thermal-IR) that can be combined to create new images for identifying and quantifying features of interest;
- Moderate coverage area (185 km wide swath); and
- Regular coverage (16 day repeat, but constrained by cloud cover; Clic n Pic has one or more images for the 1990 and 2000 time periods).
Landsat imagery is an excellent resource for small-scale studies, but is difficult to use for large-scale studies. The file size of individual scenes is large and specialized expertise in remote sensing and Geographic Information Systems (GIS) is necessary to carry out the processing and edge-matching of adjacent scenes for creating a full-coverage mosaic of a state or region. These issues prohibit many people from using Landsat data for large-scale studies. For these studies, the Moderate Resolution Imaging Spectroradiometer (MODIS) is a more useful resource. MODIS instruments are carried onboard NASA’s Terra and Aqua spacecraft. Terra was launched in December 1999 and Aqua in May 2002. NASA’s objective is global monitoring of terrestrial ecosystems, the atmosphere and the oceans. In service of this goal, both spacecraft carry the MODIS instrument, but Terra crosses the equator at 10:30 AM and Aqua at 1:30 PM, providing daily to twice-daily coverage over virtually the entire globe. Aqua is also part of the NASA “Afternoon” or “A-Train” which is a constellation of satellites that travel one behind the other, along the same track, as they orbit Earth to monitor water and atmospheric components related to climate change.
MODIS Imagery—EOS-WEBSTER
MODIS products can be obtained directly from NASA. The products are packaged as 10-degree blocks (tiles) that users must stitch together themselves using a software package. NASA scientists have created several MODIS products at daily to monthly time scales and “levels” that range from uncorrected raw observations to special gridded products generated from complicated processing algorithms. Due to the variety and scope of MODIS products, it can be confusing and frustrating for users to know which products to look for or how to use the products. To simplify access, EOS-WEBSTER created a regional mosaic for the conterminous USA of the MOD09A1 land surface product at EOS-EarthData – [was http://eos-earthdata.sr.unh.edu]. This product contained the reflectance bands that correspond to Landsat bands. Users can create the same kinds of true-color or false-color images that are typical Landsat products.
Unlike the Clic n Pic, which is a web interface for finding and downloading Landsat scenes and simple subsets of scenes, the MOD09A1 product is available through the EOS-WEBSTER website, EOS-EarthData. DEW has created a step-by-step instruction sheet on finding and downloading MODIS data from EOS-WEBSTER. Getting the data directly from EOS-WEBSTER lets the user take advantage of an advanced subsetting feature in EOS-WEBSTER that creates subsets based on irregular boundaries such as any state, or watershed or continent. EOS-WEBSTER has taken the step of stitching together the 10-degree MODIS tiles into full regional coverage of the USA for users to cut out their region of interest.

The MODIS product is an 8-day composite product, which means that the best cloud-free scene during 8-day periods during the year is stored. There is a much higher likelihood that each 8-day scene contains useable data, which is not the case with daily images. Another advantage is that EOS-WEBSTER is able to continually update the MODIS collection as new MODIS data are processed and made available by NASA. MODIS data are available starting in February 2002.
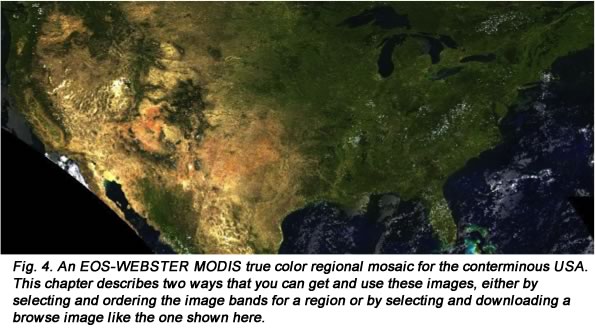
EOS-WEBSTER offers two ways to access these images, and the best method will depend on the type of inquiry the students will be carrying out. There is a lower resolution true color “browse” product for the entire conterminous USA. In this product, the appropriate reflectance bands have already been combined into a single image which is similar to what we would see with our eyes if we were on the satellite (Fig. 4, above). This product can be downloaded easily from EOS-WEBSTER and used to observe land cover changes across the country either using image analysis software or simply by creating a Quicktime movie from a stack of images.
The full MODIS images contain reflectance bands that correspond to Landsat bands. Users can create the same kinds of true-color or false-color images that are typical of Landsat products. Unlike the Clic n Pic, which is a web interface for finding and downloading Landsat scenes and simple subsets of scenes, the MOD09A1 product is available through the EOS-WEBSTER website. DEW has created a step-by-step instruction sheet on finding and downloading MODIS data from EOS-WEBSTER and loading the image bands into the Multispec image processing software.
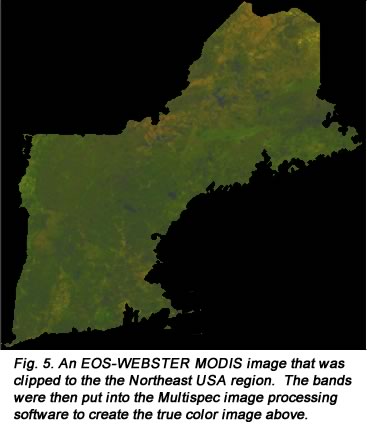
Getting the data directly from EOS-WEBSTER lets the user take advantage of an advanced subsetting feature in EOS-WEBSTER that creates subsets based on irregular boundaries such as any state, or watershed or continent (Fig. 5).
MODIS MOD09A1 surface reflectance product has the following characteristics:
- Relatively coarse spatial resolution (nominally 500 m);
- Spectral resolution similar to Landsat (seven bands in the visible and infrared);
- Wide coverage area (1000 km wide swath); and
- Frequent coverage (the MOD09A1 product for DEW is an 8-day composite, so there are 46 images across the US available for each year; but the usable number for a region may be fewer depending on cloud cover).
MODIS was designed for monitoring broad-scale environmental conditions in the atmosphere, in the oceans, and on the land surface. Compared to Landsat, the spatial resolution of MODIS is too coarse to pick out the same kind of local detail, but is very useful for studying larger scale changes, such as seasonal or year-to-year differences in vegetation over a large area such as an entire state or a region. MODIS can be used to follow the timing of green-up in the spring or change in vegetation color in the fall, and to observe timing changes throughout the period of record.
Summary of Internet Image Resources
- Google Earth
- Landsat Clic n Pic – [was http://eos-earthdata.sr.unh.edu/cnp/]
USGS:
- Earthshots (this site houses the Mount St. Helens images used in the DEW activity, Exploring the Spatial and Spectral Information in a Landsat Image) – http://earthshots.usgs.gov/tableofcontents
- USGS – the USGS hosts several data access sites. For DEW, the Global Visualization Viewer (GLOVIS) and Earth Explorer are good sources of satellite imagery and aerial photographs and can be launched from this web site: http://eros.usgs.gov/#/Find_Data/Data_Discovery
- USGS Earthnow! (this site shows a scrolling image of Landsat images for the day) –http://earthnow.usgs.gov/
NASA:
- NASA Goddard Spaceflight Center
- NASA Earth Observation Data Gateway
- NASA Earth Data Search – https://search.earthdata.nasa.gov/search
- NASA Earth Observatory
https://earthobservatory.nasa.gov
Web-Enabled Landsat Data (WELD)