
AC5. Color, Temperature, and Age of Stars
Chapter 5
I. Filters
Filters are used on telescopes to determine the brightness of an object in a specific color. One use of this information is to estimate the color of stars. Astronomers generally use a set of standard filters, meaning that the color of light each filter lets through is very well known. This is so one observer can compare data with another observer.
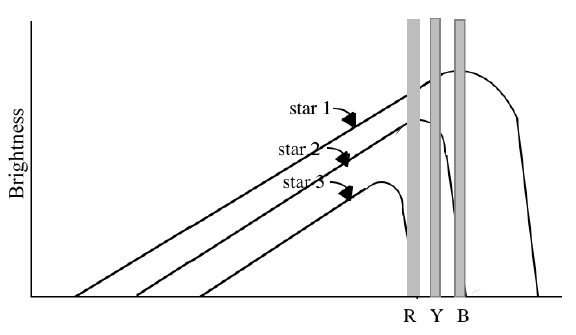
To determine the color of a star, a combination of filters that will show a sharp distinction between stars must be used. The diagram here shows plots of brightness versus color for three stars. Vertical boxes are drawn to show the approximate position of red, yellow and blue filters. Astronomers generally use the yellow and blue filters to measure the color of stars because the difference of light through these filters changes significantly for different stars.
The naming convention for filters is relatively simple: the blue filter is called B, the red filter is called R, but the yellow filter is called V. This is because yellow is in the center of the visible color spectrum. To determine the color of a star using filters, the B filter is used to measure the amount of blue light coming from the star and the V filter is used to measure the amount of yellow light. These two values are used to get the B–V index of the star:
B–V index = (magnitude through B) – (magnitude through V)
The B–V index uses magnitudes, which are units astronomers use to quantify brightness. For converting magnitude to brightness use the Brightness Conversion Table In the investigation Measuring the Color of Stars in the next few pages.
Quick Tips for Using the Magnitude Scale
Magnitude Tip #1: The magnitude scale is an inverse scale, meaning that brighter stars have lower magnitudes than dim stars. One tip to remembering this is to think about replacing the word “magnitude” with “class.” One might expect a first class star to be brighter than a second class star, just as a first magnitude star is brighter than a second magnitude star.
Magnitude Tip #2: The magnitude scale is not linear. This means the change in brightness from one magnitude level to the next is not constant. In the magnitude scale, each level is 2.5 times brighter than the adjacent level. A magnitude 1 star is 2.5 times brighter than a magnitude 2 star and 6.25 (2.5 x 2.5) times brighter than a magnitude 3 star. This leads to some trickier mathematics; see Supplementary Activity 13: Magnitude Calculations in the Measuring Brightness module.
Magnitude Tip #3: The magnitude associated with a given brightness depends on which filter is being used. The conversion table for magnitudes to brightness in Watts/meter2 has separate columns for each filter. Be careful to make sure you are looking in the correct column for the data you are seeking.

AC5.1. Investigation:
Observing Color and Temperature
Look at an incandescent light controlled by a dimmer or rheostat to understand how a star’s color is a direct effect of the temperature at its surface.
AC5.2. Investigation:
How Filters Work
Use colored filters to decode secret messages, look at rainbows, and learn how astronomers can decode information from the sky.
AC5.3. Investigation:
Measuring the Color of Stars
In this activity you will determine the color of stars that have been observed with the Leuschner telescope.
II. Spectra
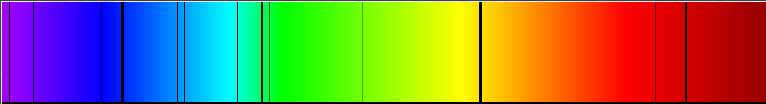
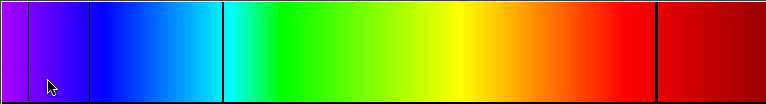
In the 17th century, Isaac Newton discovered that white light, when passed through a glass prism, can be seen to be made of a spectrum of colors–red, yellow, green, blue, violet. This ultimately led to use of prisms and then grooved glass or plastic (diffraction gratings) to build instruments called spectroscopes, which are used to analyze colors of light from stars.
Each element absorbs certain discrete colors of light, so if that element is present, it results in black lines appearing in a spectrum of light, known as a line spectrum. The spectra on this page, hydrogen and helium, the common elements found in stars, illustrate how line spectra can show us what stars are made of. To see spectra of more elements, try https://www.astronomy.ohio-state.edu/pogge.1/TeachRes/HandSpec/atoms.html.
Helium:
Hydrogen:
III. Age of Stars—Stellar Evolution
We already spoke of the birth of stars from gravitational contraction of nebulae, or gas clouds. In the Supernovae chapter, we spoke of the most dramatic and violent possible death of stars. But in between birth and death, stars change slowly, and by examining millions of stars all at different stages in their lifetimes, we can put together a picture of what the stages of a single star’s lifetime must be.
Hertzsprung-Russell diagram (Using the HR Diagram)
Between 1911 and 1913, two astronomers were working independently on the classification of stars and came up with very similar results. A Danish astronomer, Ejnar Hertzsprung, plotted stars according to their absolute magnitudes and spectral classes. An American astronomer, Henry Norris Russell, created a plot of luminosity vs. temperature for many stars. Their investigations were seen as roughly equivalent, and the Hertzsprung-Russell (HR) diagram is a result of their findings. Their goal was to clarify understanding of the life cycle of stars.
Ejnar Hertzsprung
http://www.phys-astro.sonoma.edu/BruceMedalists/Hertzsprung/
http://www.phys-astro.sonoma.edu/BruceMedalists/Russell/
The HR diagram below is called a general HR diagram because it is based on stars of all different types from many different regions of the sky. The objective is to show the distribution of various types of stars and their relative quantities. To create a general HR diagram, many stars are observed at a given time, their luminosity and temperature are determined and those values are plotted. The HR diagram can be thought of as a snapshot plot of these stars at one time. A star’s position on the HR diagram is determined by its luminosity and temperature at the time of observation. Since HR diagrams of many different stars, in many different regions, observed at many different times all yield similar distributions, it can be assumed that the general HR diagram describes an average distribution of stars. More specific HR diagrams of a single star cluster are used to determine factors about that cluster such as the type of stars in the cluster and the distance or age of the cluster.

Diagram by Richard Powell
http://en.wikipedia.org/wiki/ Image:HRDiagram.png.
When examining a general HR diagram, notice that the stars are clumped into several groups. The broad line of stars extending from the upper left-hand corner to the lower right is called the main sequence. Most stars on a general HR diagram are on the main sequence because this line represents the luminosity and temperature that exists for most of a star’s life.
When a star begins to fuse hydrogen in its core, it assumes its place on the main sequence and stays at that position until its hydrogen fuel runs out and it evolves into a later stage of its life. The main sequence lifetime of a star is generally upwards of 90% of its total lifetime. The temperature, and accordingly the color, of a star during its main sequence period are primarily determined by its mass. High mass stars are very hot so they are blue, while low mass stars are cool and red.
After its hydrogen fuel is depleted, a star contracts and begins to fuse helium in its core. This can occur rapidly or gradually depending on the mass of the star, but in either case it causes the star to expand to a greater radius than that of the main sequence star. During the expansion the star cools considerably. A low mass star that was a yellow or orange main sequence star evolves to a red giant during this expansion period. It is red because it is cool, and it is a giant because it has such a large radius. Similarly, a high mass blue or white main sequence star evolves into a yellow or orange supergiant.
A red giant will undergo yet another phase of evolution where it sheds its outer layers leaving a very dense core of carbon. The outer layers drift off to become what is called a planetary nebula, which is a ring of burning hydrogen that looks like a smoke ring. The dense core is called a white dwarf. It is white because it is very hot, but a dwarf because it has a very small radius. In fact, a white dwarf can have the mass of the sun packed into an object about the size of the Earth. A white dwarf does not have enough mass to initiate carbon burning to produce more energy so it will slowly grow cooler and fade away.
Facts of life (for stars):
• Stars have a life cycle: birth through death.
• Stars consume fuel (initially hydrogen) in their centers.
• The more massive a star, the faster it consumes its fuel.
• After all the hydrogen in a star’s core is consumed, the star becomes brighter, larger, and redder/cooler.
AC5.4. Investigation:
HR Diagrams of Star Clusters
In this investigation, we’ll make three HR diagrams: one of “Field stars” (stars not in a cluster), one of a nearby “open cluster”, and one of a “globular cluster” above the plane of our galaxy.
AC5.5. Investigation: Annie Jump Cannon and the Harvard Computers.
Read the article The Women Who Mapped the Universe and Still Couldn’t Get Any Respect (https://www.smithsonianmag.com/history/the-women-who-mapped-the-universe-and-still-couldnt-get-any-respect-9287444/). Then have a discussion with friends and/or write an essay on your thoughts about the article.