
AC5.4. HR Diagrams of Star Clusters
This investigation is based on activity “Explore the Life Cycle of Stars using data from the Sloan Digital Sky Survey” by Jordan Raddick (Johns Hopkins University), Theresa Moody, and Dr. Wil van der Veen (New Jersey Astronomy Center). For a related investigation in which you use Window to the Stars software to generate data and simulate stellar evolution in animated Hertsprung-Russell diagrams see Investigation 3.4 Windows to the Stars.

To create a HR diagram with star brightness vs. color, astronomers measure a star’s brightness at two wavelengths, usually in the blue and yellow part of the spectrum. By comparing the amounts of blue and yellow light astronomers determine the stars color.
To fairly compare star brightness we need to know how far away they are. However, for stars grouped in clusters, all the stars in the cluster are at about the same distance, so we can make fair brightness comparisons without knowing the actual distance. In this investigation, we’ll make three HR diagrams: one of “Field stars” (stars not in a cluster), one of a nearby “open cluster”, and one of a “globular cluster” above the plane of our galaxy.
We will use data from the Sloan Digital Sky Survey, whose main goal is to obtain spectra for millions of galaxies and quasars (and some sars), but in the process, it acquires brightness and color data on everything.
It uses a reflector telescope that is 2.5 meters in diameter and has a very wide field of view: about 3 degrees (6 full moon diameters) across. The telescope is actually stationary, and it takes images as Earth rotates so the sky appears to move by the telescope view.
All Sloan Digital Sky Survey data is available on the free web site called SkyServer.
Materials
Computer with spreadsheet software (e.g. MS Excel) and WWW access, specifically to the SkyServer website – http://skyserver.sdss.org
Part A. Diagramming People
[inspired by the activity “Life Cycle of Stars” from the NASA Ceres project, http://btc.montana.edu/ceres/html/EdActivities.html]
Look at the set of images of people in the table:
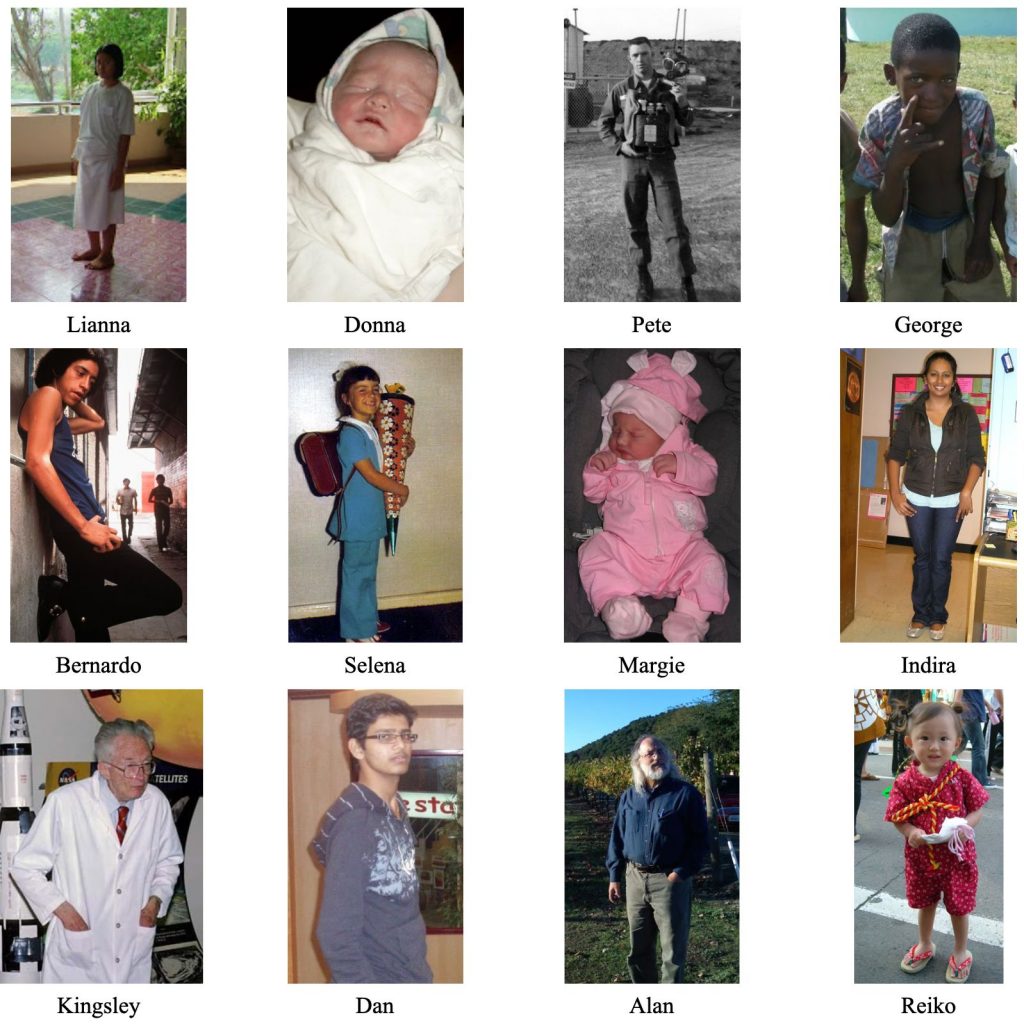
People at different ages.
- Can you guess the sequence of ages of each of them? Going by only these pictures, copy the list of names and put a number “1” by the youngest, number “12” by the oldest, and assign 2 though 11 by the others in sequence from youngest to oldest.
- What characteristics did you use in order to make your guesses? What physical characteristic data would you like to have in order to make the best attempt for a correct sequencing?
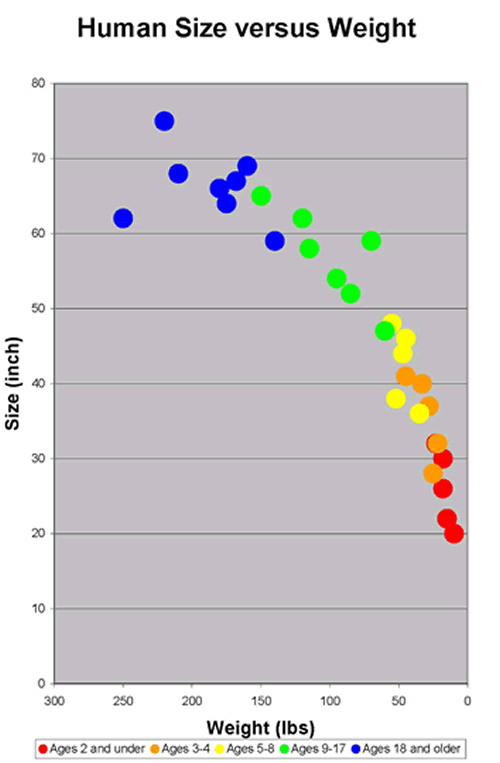
- Now look at the “WHA” (weight-height-age) Diagram of people. How would you describe the relationships of weight, height, and age as shown in the diagram?
Part B.
Getting Data from the Sloan SkyServer
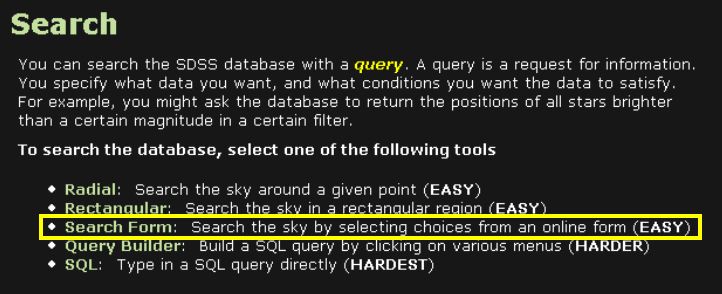
1. Go to the SkyServer web site – http://cas.sdss.org/
2. Click on “Search” in the first column “SkyServer Tools”
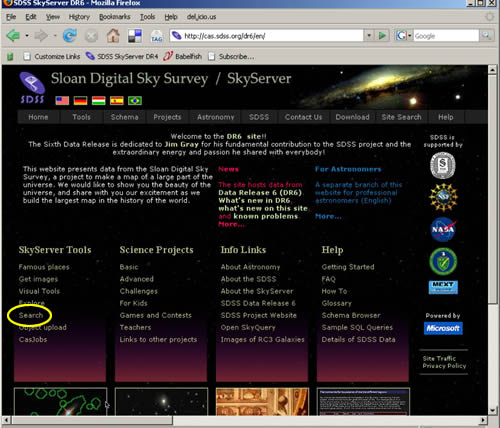
Screenshot
3. Click on “Search form” (third bullet)
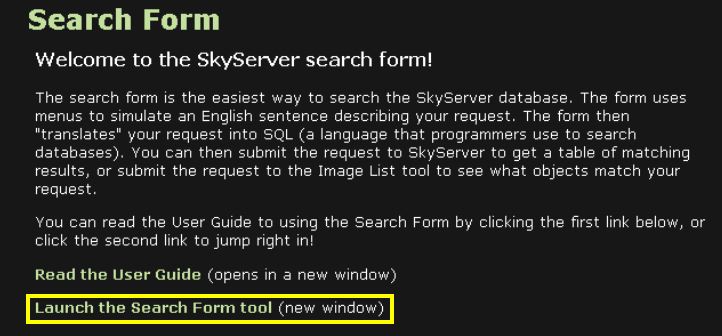
4. Click on “Launch the Search Form Tool”
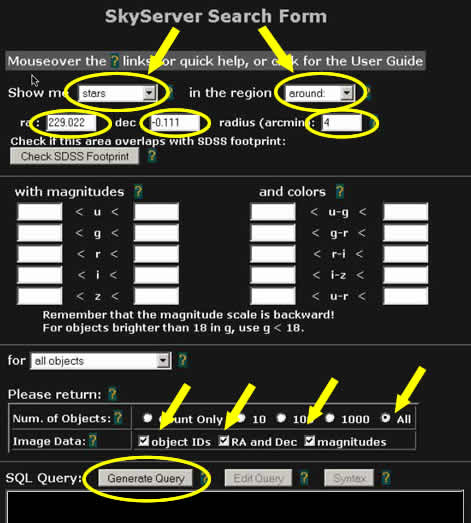
5. Fill in the following [ra and dec are for Palomar 5 globular cluster]:
Show me “stars” in the region “around”
ra: 229.022 dec: -0.111 radius (arcmin): 4
Number of objects: click “All”
Image Data: check “object IDs,” “RA and DEC,” “Magnitudes”
6. Then click “Generate Query” button
7. Select Output Format: “CSV”
8. Then “Submit Query to SkyServer”
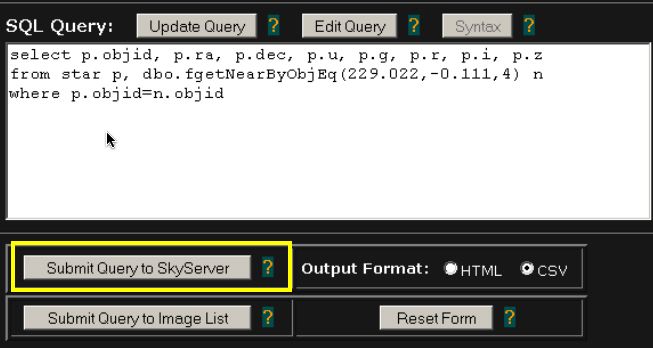
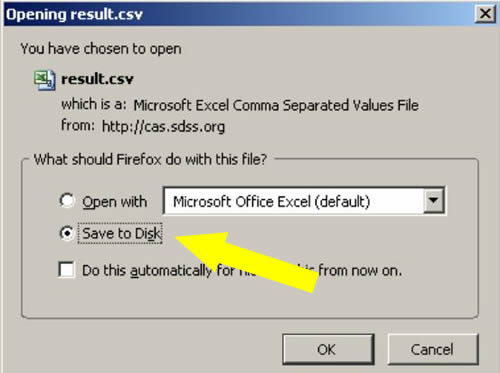
9. On “Opening result.csv window,” select “Save to Disk”
Repeat steps 1-9 for the other target regions for “Open Cluster” and “Field Stars”
Target regions:
| Name | RA | DEC | Radius | Type |
| Palomar 5 | 229.02 | – 0.11 | 4′ | Globular Cluster |
| NGC 2420 | 114.59 | 21.57 | 14′ | Open cluster |
| near NGC 2420 | 114.875 | 21.57 | 4′ | Field stars |
Part C. Make HR Diagrams with Spreadsheet Software
1. Open the CSV file with a Spreadsheet program, e.g. Excel
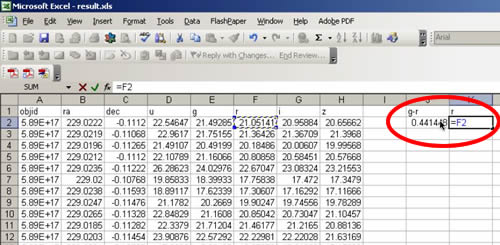
2. Make two new columns,
one with formula g – r [example: column J: =E2-F2]
and one with simply copy of r [example: column K: =F2]
3. Fill down to last row of data by clicking on upper left cell [J2] and Shift click on lower right cell [K1425 in this example] and filling down. Select the two columns of data.
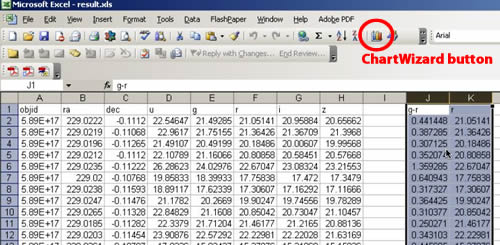
4. Click on Chart Wizard
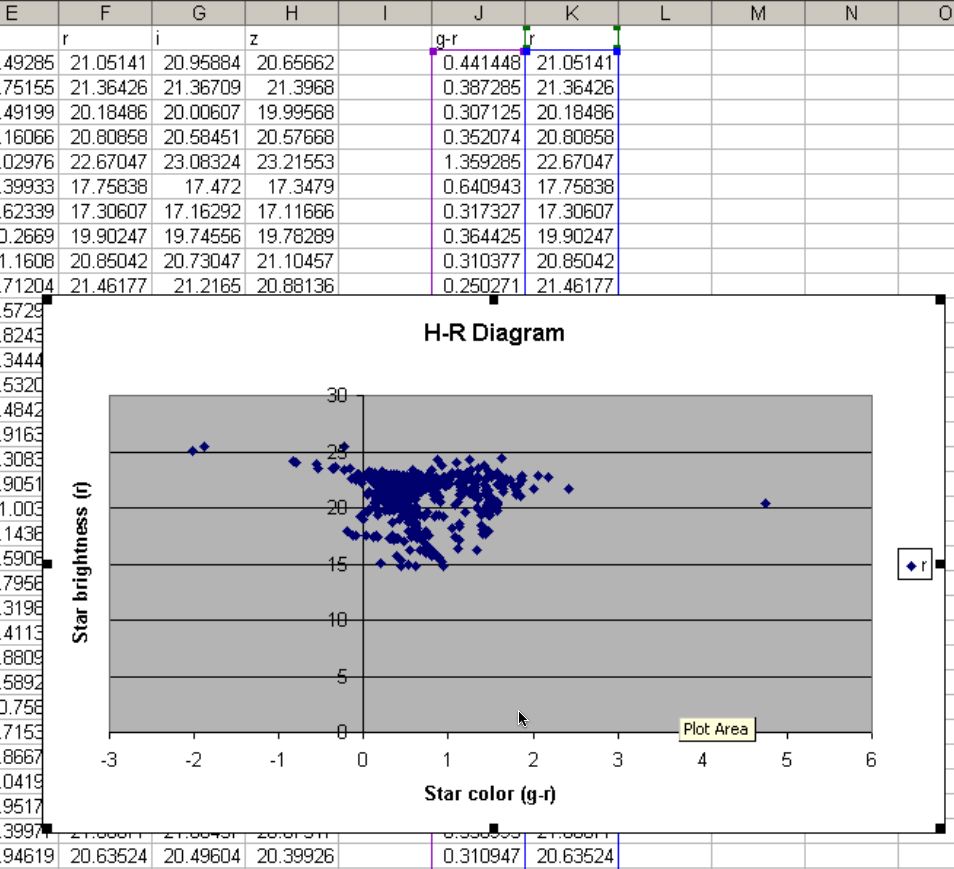
5. Choose “XY (Scatter)” then “Next”
6. Fill in Chart Title, e.g.
“HR Diagram for Palomar 5”
Value (X) axis:
“Star Color (g-r) [labels the X-axis]
Value (Y) axis:
“Star brightness (r)” [labels the Y-axis]
and click “Next” then “Finish”
7. Adjust the axes: Reverse the Y-axis, since magnitude scale is reversed (brighter stars have lower numbers). Set appropriate scales.
8. Repeat steps 1-8 for the other target regions (Open Cluster and Field Stars)
Part D. Analyzing the Diagrams
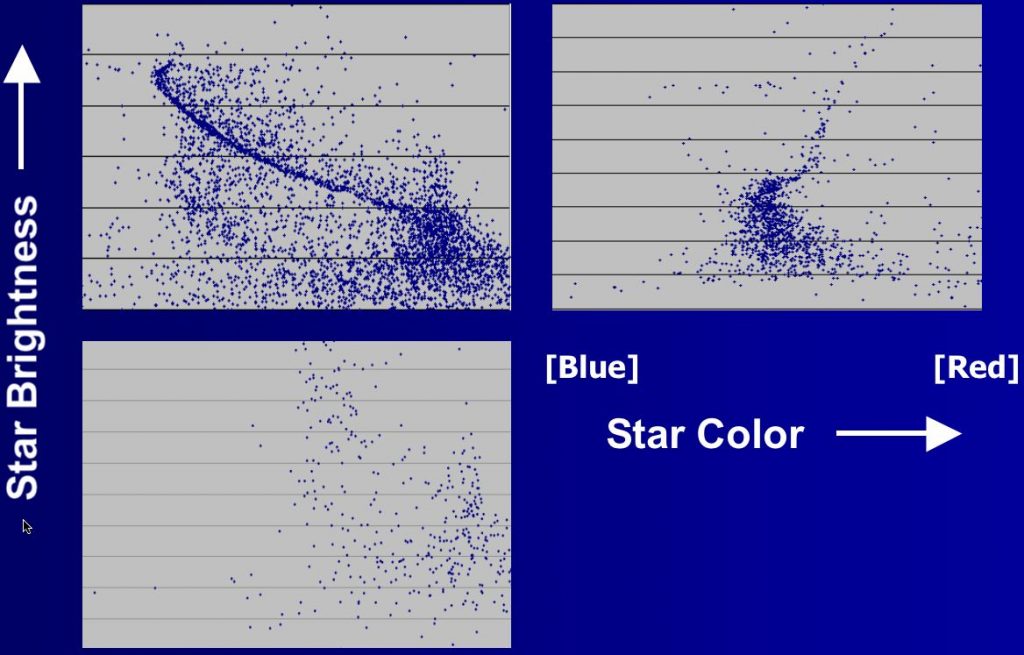
What can you tell about the age of each cluster?
Hint 1: Why would part of the Main Sequence be missing from one of the clusters?
Hint 2: As stars age, their position on the HR diagram changes. They are no longer placed on the Main Sequence. They are now placed in the Giant and Supergiant groups.
How would a cluster HR diagram look when the cluster first formed?
How would this differ from a much older cluster?
Hint 3: What happened to all of the large, bright blue stars on the Main Sequence of Graph 2?
Going Further: Get FITS images of the target regions.
1. Go to Sky Server Tools and find the Navigate tool on tools menu.
2. Enter the coordinates for each of the target regions, and use zoom.
3. Click on the quick look tool on the right hand side of the page, and then click “explore”.
4. Under PhotoObj in the left column, click on FITS.
5. Sroll down to Corrected frames, and right click on the files next to “g” and “r”. For each file, choose “Save As”, and change the file extension to .fts.
6. For these target regions, the area is always about 10×14 arcmin.