TG Population Growth
{ GSS Teacher Guide Index } { All GSS Books }

~{}~
Objectives [] Assessment [] Resources
Guides for each Chapter: 1 – 2 – 3 – 4 – 5 – 6 – 7 – 8 – 9 – 10
Index of TG Investigations
Teaching Objectives
Population Growth examines the growth and decline of populations that inhabit planet Earth, and the effects of these populations on the planet and on each other.
In Chapter One, students read about the historical view of island populations by as told by a guide who accompanied early Spanish explorers. They learn what was found on an island explored by the early Spaniards. The story goes on to tell what happened to populations on the island over time as the Spaniards introduced various species, and to compare this experience with island populations today. Students learn about the concept of limiting factors and experience hands-on activities illustrating this concept.
In Chapter Two, students address the patterns of population growth, including exponential growth and the appearance of a typical population curve. They examine positive and negative feedback in the light of population patterns and homeostasis. Students explore the implications of different predator-prey relationships in populations.
Chapter Three offers a discussion of the ways in which populations reproduce, the change of populations over time, and mathematical illustrations of population growth. In this chapter, students read the explanations of both Malthus and Darwin for changes in populations. They re-examine limiting factors in the light of survival of populations over time. Students learn about gene pools and the Hardy-Weinberg principle in the study of the evolution of populations. They also learn to calculate and interpret the frequencies of human genes such as blood type, earlobes, and sickle cell.
In Chapter Four, students track the history of human population growth from earliest records to today. Students then discuss and interpret the factors that cause the growth and decline of human populations.
Chapter Five deals with the impact of population growth on natural resources such as soil, air, water, and energy is explored. Students look at these impacts in relation to their daily lives and their future existence. Global climate change is introduced in this context. Students then hold discussions on the political implications of population growth such as crowding, distribution of wealth, and conflict.
Chapter Six tells the story of two nations with large populations and how each has dealt with explosive population growth. Students then examine China’s one-child policy along with political reactions to such a policy. Students are asked to discuss and develop opinions about such policies. This chapter also asks students to compare and discuss population growth in the United States. Students are introduced to population pyramids and will look at the demographics involved.
Chapter Seven brings up the topic of remedies for human population growth. Students examine all sides of the debate on the means of controlling population, and discuss alternatives. Factual information is given, and students will be asked to decide for themselves what the ethical answers should be to this dilemma. Other issues students consider are the impacts of education and the emancipation of women as factors influencing population growth. Students also study and compare population pyramids for different nations.
Chapter 8, Choosing a World, asks students to take all they have learned and use this information to decide what could be done, what should be done, and most important of all, what they themselves can do to make their world a better place. They should complete the book feeling empowered by the knowledge they have gained.
Goals of the Book
Goal 1: Students realize that island populations are illustrative of what can happen on a planet-wide scale.
- Objective 1A: Students can describe the effects of populations on one another by looking at goat and dog populations on islands.
- Objective 1B: Students learn about limiting factors, and can relate these to populations.
Goal 2: Students examine the patterns of population growth.
- Objective 2A: Students can extrapolate the results of populations under different scenarios, and predict what changes in populations occur as a result of limiting factors.
- Objective 2B: Students can give examples of positive and negative feedback, and diagram feedback loops.
- Objective 2C: Students can explain homeostasis.
Goal 3: Students explain the ways in which populations reproduce.
- Objective 3A: Students can compare and contrast sexual and asexual reproduction.
- Objective 3B: Students become familiar with Darwin’s writing and Darwin’s tenets.
- Objective 3C: Students can describe gene pools and use the Hardy-Weinberg principle to determine whether or not a population is evolving.
- Objective 3D: Students can use their knowledge of the Hardy-Weinberg equations to calculate and interpret human gene frequencies.
Goal 4: Students track the history of human population growth.
- Objective 4A: Students examine the human population over time and determine factors that cause the growth and decline of human populations.
- Objective 4B: Students learn extrapolation as they graph the human population.
Goal 5: Students analyze population policies of various nations.
- Objective 5A: Students learn about population policies of China and India.
- Objective 5B: Students compare the policies of other nations with U.S. and United Nations population policies.
Goal 6: Students know the impact of populations on natural resources.
- Objective 6A: Students learn how population pyramids can help analyze demographics.
- Objective 6B: Students explore the impact of population growth on natural resources and the distribution of these resources.
Goal 7: Students consider what is being done about human population growth.
- Objective 7A: Students examine all sides of the debate on population control methods.
- Objective 7B: Students look at the effects of education and the emancipation of women on population growth
- Objective 7C: Students compare patterns of population growth in various nations, and relate growth rates to the various factors in each nation.
Goal 8: Students feel empowered to choose action plan which they feel lead to a better world.
Global Systems Science is intended to be an inquiry-based course, with many hands-on laboratory activities and interactive discussions; but the extent to which it actually is based on inquiry depends on you!
The student guide, Population Growth, contains investigations and activities that involve students in experimenting with materials in class and at home, critical reading, discussions, and writing.
This Teacher’s Guide to GSS provides additional ideas for you to enrich the course, offering additional investigations and activities developed by other participants in the GSS Summer Institutes. They range from fairly well-developed descriptions containing lists of materials and student data sheets, to ideas for activities that you may wish to develop further. We recommend that you spend some time looking through the entire Guide to decide which activities are most appropriate for your students, and which are feasible given the constraints of time and resources that you have to work with.
Additionally, we encourage you to supplement these materials with relevant articles about global and local environmental issues, as well as other related instructional materials that you may already have on your library shelf.
Population Growth follows logically in series with other GSS units. For example:
- Life and Climate is concerned with the evolution of our planet over the past 4.6 billion years. It emphasizes the factors that have affected the Earth’s atmosphere and climate, how the changing climate has affected the evolution of life, and how life has profoundly affected Earth’s climate in the past.
- Energy Use familiarizes students with the vast infrastructure that enables us to draw on Earth resources to meet our energy needs. Students consider the magnitude of fossil fuel burning, how it effects global systems including Earth’s climate system, and what can be done to modify these trends.
- Population Growth is about how the rapid growth of human populations is impacting world systems, including production of greenhouse gases.
The ideas presented in the Chapter-By-Chapter notes which follow are just suggestions. From time to time we will make suggestions for small or large group discussions, questions to encourage thinking about the information that is presented, or ways to engage the students’ interests. However, your best guide will be your own intuitions about how to get the students to interact with each other, comparing and contrasting their reactions and opinions about the information in Population Growth and the results of their activities.
~{}~
Objectives [] Assessment [] Resources
Guides for each Chapter: 1 – 2 – 3 – 4 – 5 – 6 – 7 – 8 – 9 – 10
Index of TG Investigations
Assessment Tasks
1. Portfolios
We encourage the use of portfolios as a means of providing feedback to students and to demonstrate evidence of student progress.
Portfolios for Population Growth might include:
- Writing assignments based on readings in the book and from outside sources
- Internet assignments
- Student self-assessments
- Group work
- Lab reports
- Quizzes and tests
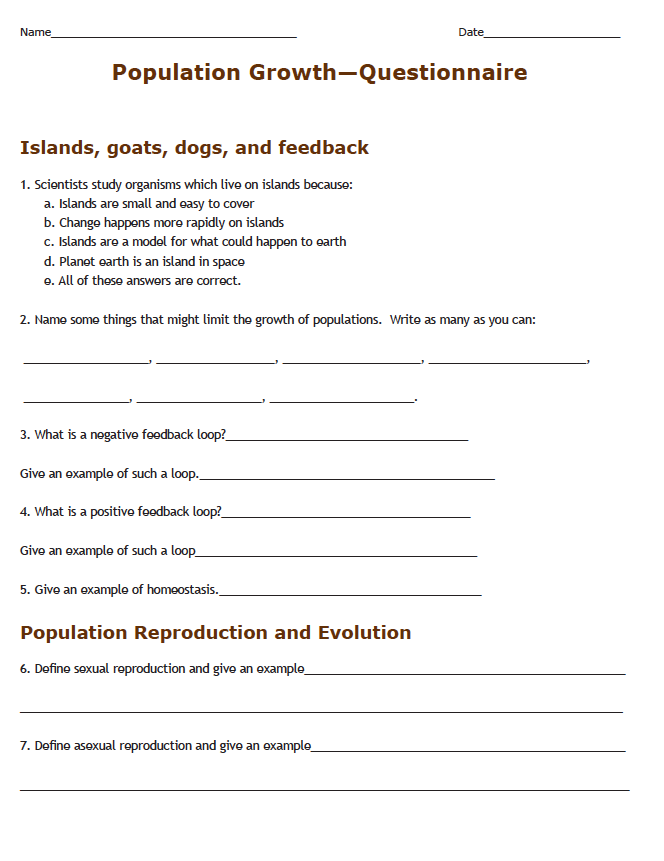
2. Questionnaire
These questions are designed to determine how students’ knowledge of key concepts have changed during the unit, and whether or not they have changed their opinions concerning personal actions and environmental issues.
When used as a pre-test, the test will help to determine what knowledge the student already has, and help the student anticipate what they will be asked to learn. The post-test will show gains in learning
QUESTIONNAIRE(click image to enlarge or download .pdf.)
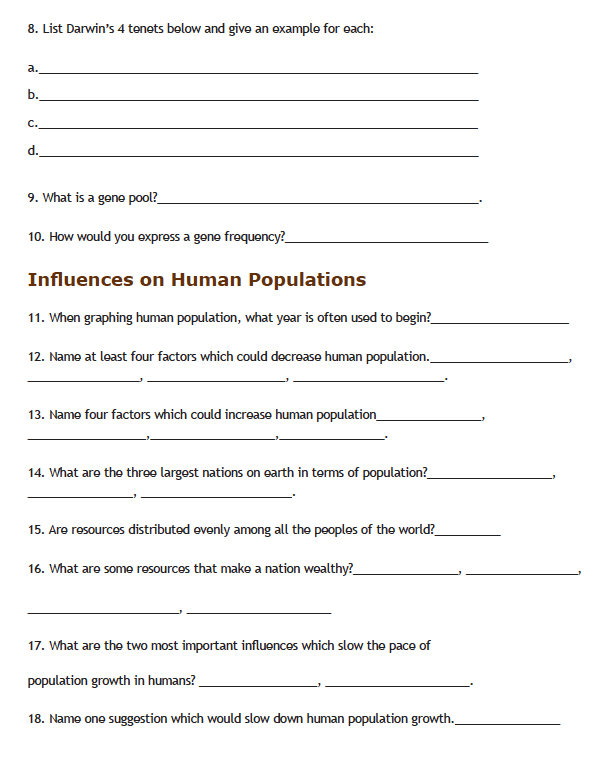
—- Questionnaire page 2 —-
Interpreting Student Responses
It is suggested that you use two colors for the pre and post test so that you can easily compare the before and after results. The same could be done with the concept map.
You can quickly glance at the chart below and see which objectives students may not know before they study the unit, and those they have learned or understood at the end of the unit.
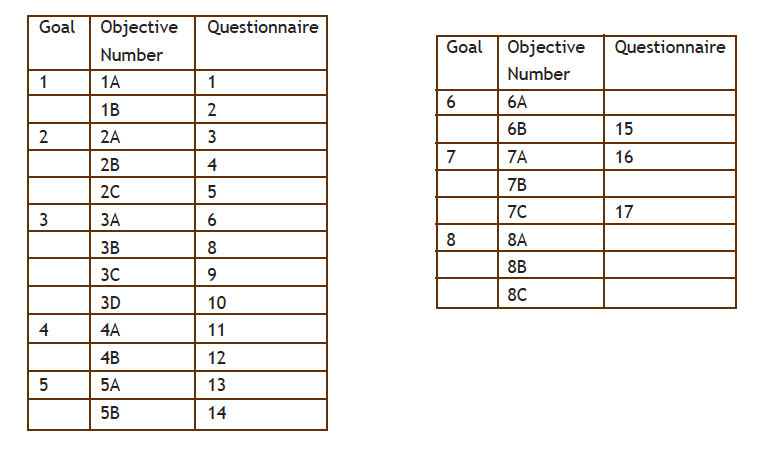
Questionnaire Answer Key
- e. All of these
- lack of food, lack of clean water, air pollution, crowding, competition, disease, parasites.
- A negative feedback loop is one which returns the system to where it began and cycles around an equilibrium point. An example is a thermostat.
- A positive feedback loop is one that increases the effect at each cycle and spirals out of control. An example would be an argument that accelerates to a fist fight which ends with a winner. Microphone squeal is another example.
- Homeostasis is balance. An example would be the results of negative feedback. Another example would be allowing a cold glass of water to stand until it reaches room temperature. Heat transfer leads to homeostasis or steady state.
- Sexual reproduction requires two parents with different kinds of sex cells. An example would be the sperm and egg in any mammal.
- Asexual reproduction requires only one parent and the offspring are identical. An example would be fission in amoebas, budding in yeasts, cuttings or grafting in plants. There are many more examples.
- Darwin’s tenets are:
a. populations reproduce in greater numbers than necessary to survive. An example would be the thousands of eggs laid by oysters, or seeds of maples.
b. There is a great deal of variation among offspring. Each oyster and each maple seed is slightly different.
c. There will be a struggle for existence among these numbers. The oyster larvae will compete with one another for food and space.
d. Only the fittest of these numbers swill survive. Some oysters will be eaten, some maple seeds will not land on soil. Those with the best traits are most likely to survive and pass their traits on to their offspring. - A gene pool is the sum of all the genes for a trait in a population which is reproducing.
- A gene frequency is expressed as a decimal and represents the percentage of that gene in a population.
- Often it is graphed from the birth of Christ.
- Four factors which could decrease human population are: famine, disease, war, low birth rates.
- Four factors which could increase human population are: plentiful space, food, water, medical treatment.
- The three most populated nations in the world are: China, India, and the United States.
- No.
- Oil, Fuels of other kinds, Uranium, Gold, rich soil with good growing season, educated people.
- Emancipation of Women and education.
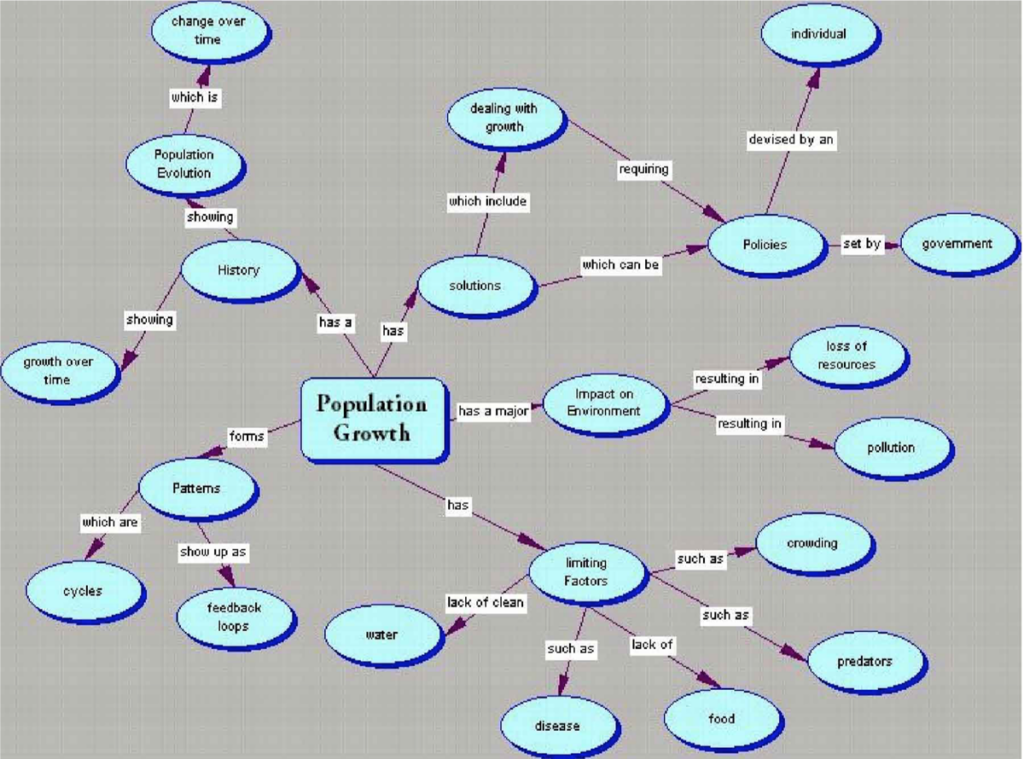
3. Concept Map
Asking students to create a concept map before and after the unit is one way to determine which concepts they have learned and their understanding of the connections among these concepts. Asking students to develop a concept map before and after the unit will help the teacher to see what connections students have developed. They can even be used after each chapter, and put together at the end into a larger concept map.
The written questionnaire, when used as a pre or posttest can show factual knowledge, but the concept map is a better tool to show conceptual understanding. Visual learners also do better with a concept map.
CONCEPT MAP (Click image to enlarge or download .pdf.)
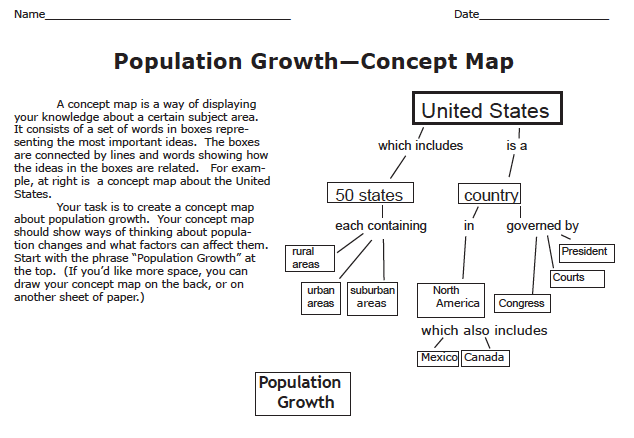
Sample concept map for Population Growth
If students have not had experience in concept mapping, you might want to start them out with a hand-out showing an example, a general idea of what they are to map, and starting word(s) to help get them started. Once they have had experience with concept maps, they can create them on blank sheets of paper (no photocopying required). Alternatively, they can use concept mapping software such as
- Inspiration (http://www.inspiration.com)
- Decision Explorer (http://www.banxia.com/).
- CMap (http://cmap.ihmc.us/conceptmap.html – free for noncommercial use).
- Omnigraffle (http://www.omnigroup.com/applications/omnigraffle Mac OSX)
- Freemind (http://freemind.sourceforge.net/wiki/index.php/Main_Page – open source software for mind-mapping.)
- Microsoft Draw (comes with Microsoft Office)
Some possible key words to use: biology, population, endangered, predator, prey, alien, nonnative, feedback, growth, reproduction, exponential, Verhulst, birth rate, family size, abortion, death rate, Malthus, doubling time, population growth, overpopulation, birth control, contraception, pregnancy, population growth, fertility, gene, genetic, Darwin, booby, exponential growth, armadillo, geometric, geometric growth, evolution, trait, sickle-cell, topsoil, depletion, nonrenewable, pollution, migration, refugee, overcrowding, waste.
~{}~
Objectives [] Assessment [] Resources
Guides for each Chapter: 1 – 2 – 3 – 4 – 5 – 6 – 7 – 8 – 9 – 10
Index of TG Investigations
Guides for Each Chapter
Guide for Chapter 1
What Is A Population?
1-I. What is the Connection Between Robinson Crusoe, Juan Ferandez, and Goats? is the time to introduce the definition of populations and to solicit examples from students. The picture of a typical Spanish ship can be examined and students can be encouraged to think about what it must have been like to explore unknown waters in such a vessel. We can begin by introducing the definition of populations and to soliciting examples from students.
This section also gives students the opportunity to tie the story of Robinson Crusoe to the exploration of islands by Spanish ships. An interdisciplinary assignment with the English department whereby students read the story of Robinson Crusoe can be arranged.
Ask students to close their eyes and imagine that they are the narrator on a ship of that era. Ask them to be ready to list the changes they saw after each visit, and to speculate on the reasons for those changes.
1-I gives students the opportunity to tie the story of Robinson Crusoe to the exploration of islands by Spanish ships. An interdisciplinary assignment with the English department whereby students read the story of Robinson Crusoe might be arranged. After reading this section, ask students to answer the question at beginning.
1-II. The Story of Goat Island. Have students take turns reading aloud in class. This is an excellent opportunity to check the reading ability of each student. Ask students who are not reading to close their eyes and imagine that they are the narrator on a ship of that era. Ask them to be ready to list the changes they saw after each visit, and to speculate on the reasons for those changes.
Some examples of damage to wildlife in the Galapagos are given at the end of this section. Have students search on the Internet to find other examples of islands where wildlife is impacted by non-native species. Suggestions would be islands like the Hawaiian Islands, Madagascar, Tasmania, the Philippines, the Seychelles, etc.
1-III. Limiting Factors could be discussed either before or after the yeast lab is completed. Hemacytometers are very helpful for counting yeast populations if they are available. Otherwise, students can dilute each sample until they can count all the yeasts they see in a microscope field of view. Fruit flies are easy to raise and count. Students may anesthetize the flies with a chemical called “Fly Nap” available from Carolina Biological Supply Company, or can be frozen after hatching for easy counting. Duckweed, or lemna is available in most local ponds and multiples rapidly. The cell culture laboratory was developed by a Presidential Award winner and a cell biologist and may be easily accomplished if a source of cells is nearby. It is below.

TG-PG1-1. Investigation: Cells On The Grow—Integrating Biology and Algebra
Each of you will be given a flask with cultured human fibroblasts. The fibroblasts are attached to the bottom of the flask. They need to be detached with an enzyme, rinsed and centrifuged, and re-suspended in a small known volume of medium. An aliquot will then be counted to determine the concentration of cells, the rest will be plated in culture flasks.
To check student understanding of limiting factors, ask them to read and interpret the lynx and hare graph in 1-III. Limiting Factors. Especially note that the study took place over a long period of time. There are a number of software programs available which simulate this type of population fluctuation. Again, students could be asked to come up with examples of other predator-prey relationships. Here, the concept of carrying capacity willy be introduced, and must be emphasized as a key idea, since it will appear throughout the book.
Students summarize what they learned by answering questions. Investigation 1-2. Alien Invaders is a good group activity where each group can share their answers with the class. This also could be a homework assignment. The concept that alien invaders or alien species can wreak havoc on indigenous species is a key idea which students can explore by finding alien species in their own home areas and reporting on them to the class.
If time permits, students could go outdoors and collect samples of local alien species to show in class. Examples on the east coast would be zebra mussels, purple loosestrife, or hydrilla; in the Midwestern states, garlic mustard and the asian longhorn beetle; and on the west coast, Italian thistle, leafy spurge, jointed goatgrass, or green crabs. Students could participate with the local Audubon Society or Nature Conservancy to recognize and remove alien species from their local area.
~{}~
Objectives [] Assessment [] Resources
Guides for each Chapter: 1 – 2 – 3 – 4 – 5 – 6 – 7 – 8 – 9 – 10
Index of TG Investigations
Guide to Chapter 2
Patterns in Populations
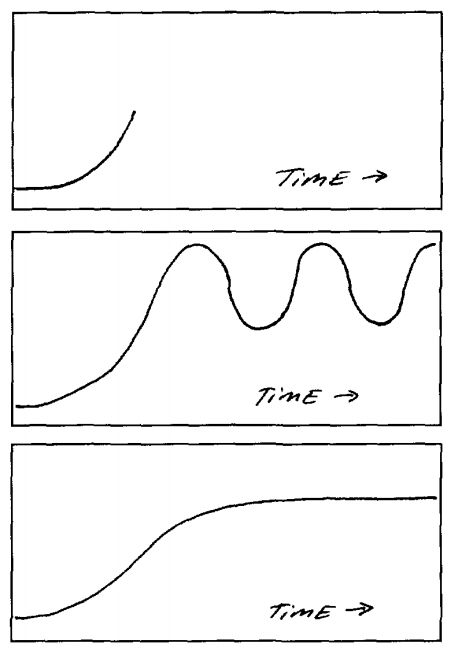
Students can do the graphing activity either individually, in pairs, or as groups of three. Each student in a group of three could take a different scenario and explain it to others in the group. Each group could then report to the whole class. This graphing activity could be used as an assessment of student understanding of limiting factors on populations. A think-pair share activity is also possible, where students work individually, and then share their ideas with a partner, reach consensus, and then present their results to the class. The graphs should look as follows:
2-II. Negative and Positive Feedback. The idea of feedback loops is central to many of the concepts throughout the Global Systems Science series. The hardest thing to get across to students is that negative is not bad, but is a subtraction, just as positive is not good, but is an addition the terms as used here are mathematical and not subjective. Blank templates of positive and negative feedback loops are available below to allow students to come up with their own ideas by filling in the spaces of the loops. Students have come up with such ideas for positive loops as drug usage, a bear stock market, and suntans. Negative loops are such things as cruise control on a car, air conditioners, and human pacemakers. Global warming is a great example of positive feedback. Sample loops which may be copied:
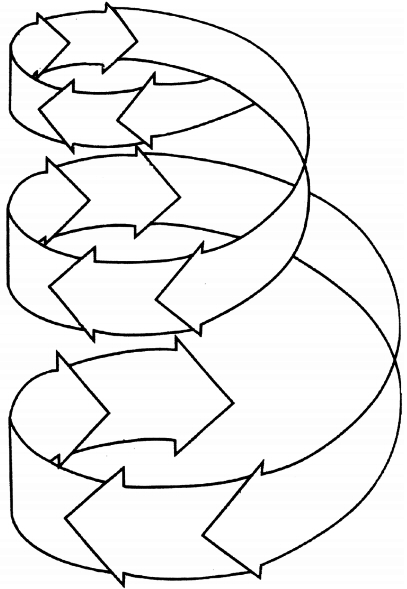

These blank versions of feedback loops (click image to enlarge) can be used for transparencies or copies for students to fill out.
Now feedback loops can be tied to the populations of dogs and goats learned about in Chapter 1. Lynx and hare can also be discussed in terms of feedback loops. If desired, students can make loops about the goats, tortoises, and iguanas as well.
Positive feedback can result in uncontrolled, or exponential growth. Here students learn for the first time about exponential growth. This could be introduced by asking students to relate exponents to mathematics, and to describe a few exponents. They will be most familiar with 2 as an exponent since they have “squared” numbers. Since squaring is doubling, base 2 numbers are often used for exponential population calculations. The activities direct students toward thinking of very large numbers, and how quickly certain populations can grow. This leads to the question of why systems are not overwhelmed by this growth, and brings students back to limiting factors.
For the first time, students are introduced to a growth curve and its phases. Later on they will be asked whether populations are following this typical pattern. The “drop in the bucket” activity is best done more than one time, and with groups of three. Here you will see students truly doing problem solving. After the first trial, they will realize that droppers alone are too small to use for measurement, and will ask if they can use larger containers. Emphasize that they still need to know how many drops there are. You will see students begin figuring out how many drops are in larger containers. Containers of a variety of sizes need to be made available, and the activity needs to be run more than one time. If plastic buckets are not available, gallon water containers are good to use. Students will quickly figure out that they cannot use only a dropper, and that they need to figure out how many drops are in a milliliter. They can then use graduated cylinders and beakers to more quickly add the doubled drops. The teacher needs to avoid telling the students how to do this, but allowing them to construct their own solutions. It is interesting to watch the different strategies used by groups of students. The teacher can have a prize available for the group, which makes the closest guess.
This activity may require that groups start over a number of times. Students are amazed at how quickly a bucket can be filled once they know how many drops are in larger containers. It is important that one student keep careful count of how many drops are being added.
2-IV. Exponential Growth, Road Kill, and Sexual Reproduction. A limiting factor for armadillo populations is becoming road kill, and students will soon realize that armadillo populations could grow very quickly if it were not for limiting factors. Bacteria and yeast populations that were graphed earlier were asexually reproducing. The question that could be posed is whether or not sexually reproducing populations also grow exponentially and follow the population growth curve. After students calculate the number of armadillos and complete the chart, they can reach their own conclusions. This is an activity, which can be offered as one, which is interdisciplinary with mathematics.
Mark and recapture activities allow us to estimate population sizes in a specific area. The results of mark-recapture data are surprisingly accurate and are much quicker than a census.
If it is the wrong time of year to go outside, or if fields of grasshoppers are not available outdoors, an alternative activity using rice for a mark-recapture is shown below.
2-V. How do we know Population Size? We often talk about how big a population is and how fast it is growing, how many are surviving in a certain area, and whether or not a population is endangered. How can ecologists find out what is happening in a population in the wild? After all, they cannot go out into the field and see every individual organism. They can collect pelts and count them as they did with the lynx and the hare, or they can use what Field biologist call “mark-recapture” You will perform an activity which shows how this works.
~{}~
TG-PG2-1. Investigation:
Mark and Recapture
Materials needed for student groups
1 cup of rice
1 small glass jar
Note paper
Calculator
Activity
1. Put 1 cup of rice into a jar. Have students imagine the kernels of rice are monarch butterflies in a wintering sanctuary. Give each student a slip of paper. Have them number from 1-3 and label:
- Count and Extrapolate
- Mark, Release, Recapture (MMR) Estimate
- Actual count
2. Count and Extrapolate
Have students take out a small number of rice kernels, count them, and put them back into the jar. Encourage them to notice the amount of space the small number of rice kernels occupies in the jar. Now, have them extrapolate in order to estimate the number of rice kernels in the full jar.
3. Mark, Release, Recapture (MRR)
Next, “capture” a number of rice kernels and mark them with a colored marker. Students should capture and mark at least 100 pieces of rice. Put all the rice back into the jar and stir. Record the number of pieces you captured and marked on your “1st Visit”.
Now go back for a “2nd Visit”. Record the number of MARKED individuals you recaptured on the 2nd visit. Also record the TOTAL NUMBER of individuals you captured. (Do not return the rice to the jar until you have counted the full number.)
Now, figure your estimate according to the MRR equation. Remember, you are solving for “Total Population Size”, or “b” in the equation below. The basic idea is that the number of individuals marked on the first visit (a) is to the total number in the population (b), as the number of marked individuals captured on the 2nd visit (c) is to the total number of individuals captured on the 2nd visit (d).
MRR Equation: a/b = c/d
a= # Individuals Marked on 1st Visit
b= Total Population Size
c= # Marked Individuals Recaptured on 2nd visit
d= # Individuals Captured on 2nd Visit, in Total Here’s an example:a=100 Individuals Marked on 1st Visit
b= Unknown (Total Population Size)
c= 20 Marked Individuals Recaptured on 2nd visit
d= 100 Individuals Captured on 2nd Visit, in Total
4. Actual Count
Divide the rice among the students in the group. Have them count the actual number of objects in the jar.
Discussion
- How did your 2 estimates compare to the actual number of objects? Which method of estimation was more accurate?
- What assumptions are made in the MRR method? List as many as you can. (For example, between the 2 visits there are *no births or deaths, * no arrivals or departures, * there’s equal chance of capture and recapture, * monarchs don’t learn to avoid being captured, etc.)
- Do you think MRR is a reliable method?
- Does the estimate become more accurate if you mark a greater number of individuals? Why?
http://www.learner.org/jnorth/www/critters/monarch/826636643.html
Students could have a great time doing a mark-recapture exercise using hand stamps and school hallways for a day. For this you would need to be in a rather large number of students.
~{}~
Objectives [] Assessment [] Resources
Guides for each Chapter: 1 – 2 – 3 – 4 – 5 – 6 – 7 – 8 – 9 – 10
Index of TG Investigations
Guide to Chapter 3
Population Reproduction, Growth and Change Over Time
This chapter begins by addressing the idea that populations reproduce at an exponential rate until they come up against limiting factors. The two types of reproduction are compared. Students are asked to examine a moldy piece of bread to see an organism, which can reproduce both sexually and asexually. They may begin to see that one adaptation organisms have evolved is a reproductive strategy designed to successfully propagate their species. The picture at the beginning of 3-I. Reproduction in Populations of the zygospore of the black bread mold demonstrates the sexual phase of rhizopus nigricans. This stage can easily be observed with a magnifying glass or a stereomicroscope.
3-II. Geometric Growth
This section describes a mathematical means by which population increases can be projected over time. One can see how populations without limiting factors could reach high levels very rapidly. This is an excellent activity to be shared with a mathematics teacher for an interdisciplinary presentation. TI -83 calculators can also be programmed by knowledgeable students and/or teachers. Students can allow the computer to graph the results, or graph data themselves by hand. They will note the exponential rate of growth resulting from this data. This is a place where limiting factors can be brought back into the discussion. The use of semi-log paper for graphing can also be introduced in this chapter.
Investigation 3-3. Optimum Number of Offspring
Students are asked to find a reproductive strategy used by an organism to successfully survive. Many fascinating examples can be garnered, such as the fish who keeps its young in its mouth for protection, the method used by the kangaroo where the embryo crawls into the pouch, or the wolf spider which carries its young on its back. Reproductive success also depends on finding a mate, and the story of Lonesome George, the last of his species, is told here. Students can access the Darwin Research Station in the Galapagos via the Internet to see how Lonesome George is doing. Students could discuss other animals, which have become extinct, such as the last passenger pigeon who was kept in a zoo until it died. Endangered species with low numbers could be introduced at this point, such as the cheetah, with a discussion about how a limited gene pool affects reproductive success.
Investigation 3-4. Advantages and Disadvantages of Sexual Reproduction
Students summarize what they have learned about the advantages and disadvantages of sexual and asexual reproduction. This is a good time to see whether or not they understand the concepts presented in previous chapters.
3-VI. Populations and Change Over Time
This section introduces the idea of evolution, which is change over time. Darwin’s actual writing in his book “The Origin of Species” is often paraphrased or misquoted. Students can read what he actually wrote, and discuss the meaning with one another. They can then progress to the interpretation of what he wrote, often called “Darwin’s Tenets”. The teacher can emphasize that evolution is defined as change over time, and that Darwin listed these tenets as the reasons for the changes that he postulated.
The teacher will probably need to supply some interpretation and lead some discussion in class. The tenets are simplified, but there is some value in reading Darwin’s original words. His phrase “There is a grandeur in this view of life” is often quoted, and was used as a title of one of Stephen Jay Gould’s latest book entitled “Life’s Grandeur”
Students are asked a key question, “What determines which individuals are most fit to survive?” at the end of this section. At this point, a homework assignment could be given asking students to list what they think are determining factors for survival.
3-VII. Density Dependent and Density Independent Factors
Students are introduced to the effects of density on populations and given examples of these effects. Space as a limiting factor is expanded upon in this section. The affect of various natural phenomena on populations is also discussed. Current events such as tornados, floods, fires, hurricanes, or earthquakes could be brought up, and clippings from newspapers could be used as part of this lesson. Cases where humans have interfered with the environment leading to greater disasters, such as the Yellowstone fire, could be discussed at this point.
3-VIII. Genes, Populations, and Evolutions
This section presents an introduction to population genetics. Population genetics is important to the study of evolution because it maps changes in the gene pool of a population over a period of time.
The teacher might want to emphasize that it is easier to see evolution occurring in large populations.
The idea of the gene pool is introduced at this time, as are terms such as gene flow, gene frequencies, and genetic drift. The HardyWeinberg principle is defined and explained.
Investigation 3-6. Earlobes
Earlobes are used here as an example, but other human traits such as a widow’s peak, hair whorl, or hitchhiker’s thumb could also be used. Many human traits are difficult to use because they are the product of many sets of genes, or in the vernacular of geneticists, they have “multiple alleles”. The expected frequency of a cross between two hybrids, or heterozygous parents, always results in a .25, .50, .25 ratio, so that is what is expected. Since half will be mixed, and a quarter will be pure dominant, the total showing the dominant trait is expect to be .75.
Answers to Investigation 3-6 with hypothetical student numbers:
| Column I Trait | Column II # with trait | Column III Frequency | Column IV Expected Frequency |
| aa | 45 | 45/131=.34 .34 | .25 |
| Aa | 86 | 86/131=.66 .66 | .50 |
| Total | 131 | .34+.66=1.0 1.00 | 1.0 |
To see if these population frequencies are significant, a chi-square analysis can be done on the data.
Chi square = (observed results minus expected results) squared divided by expected results. In this case, (.34 – .25 ) 2 divided by .25 , or .0081/.25
Chi square would equal .0324
There would be one degree of freedom. On the chi-square table on the right, p would equal between .5 and .9 that aa will exceed the values.
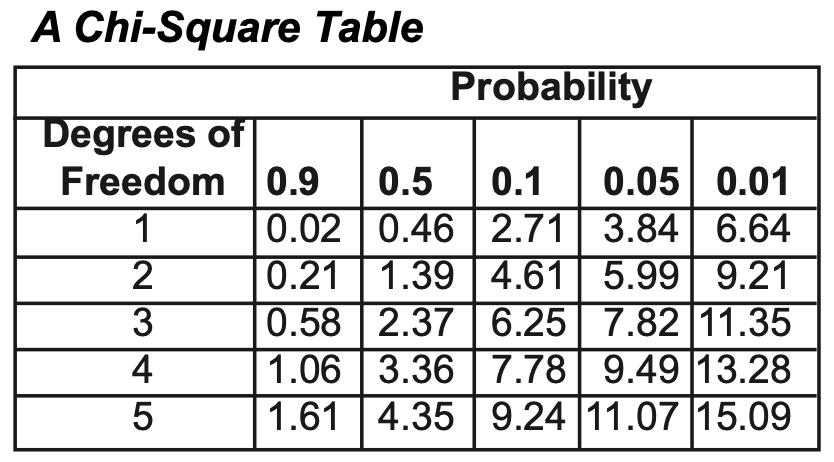
If the calculated chi-square value is less than the probability of 0.05 , we then expect that the population is not the normal 3:1 ratio. If the value is greater than .05 probability, we accept the hypothesis that the data fits a 3:1 ratio.
3-IX. The BIG Question
This section demonstrates that human population frequencies can change, depending upon circumstances. When frequencies change, a population is considered to be evolving. If a human population isolates itself, the gene pool does not change, and the population will remain static, or will be in equilibrium according to the Hardy-Weinberg law. Therefore, the Dunker population did not evolve. Human populations are nearly always changing gene frequencies, as people migrate into other gene pools and intermarry.
Hemoglobin S occurs with greatest prevalence in tropical Africa; the heterozygote frequency is usually about 20 percent, but in some areas it reaches 40 percent. The sickle cell trait has a frequency of about 8 percent in African Americans. The sickle gene is found to a lesser extent in the Middle East, Greece, and in aboriginal tribes in India. On occasion sickle cell disease is found in Caucasians in many other areas.
High prevalence of sickle cell trait in areas of the world where malaria has been common has strongly suggested that persons with sickle cell trait have a selective advantage over individuals with only normal hemoglobin A. This advantage seems to be restricted to those infected with Plasmodium falciparum malaria. While readily affected, the parasite count remains low. When a red cell containing P. falciparum undergoes the sickling process, the parasite dies. It has also been suggested that the infected red cell sickles and is destroyed, probably in the vascular system, liver or spleen. Whatever the mechanism, the result is that the infection is of short duration and the incidence of cerebral malaria and death is low. [There used to be an activity on sickle cell incidence at this site: http://resources.schoolscience.co.uk/MRC/7/page1.html]
~{}~
Objectives [] Assessment [] Resources
Guides for each Chapter: 1 – 2 – 3 – 4 – 5 – 6 – 7 – 8 – 9 – 10
Index of TG Investigations
Guide to Chapter 4
The History of Human Population Growth
Remind students that the biblical quotes are often used in a historical, not a religious context, and that the Bible is often used in a political context to further someone’s political agenda. In this case, students could discuss the tremendous influence this passage has had on human behavior toward the earth and its inhabitants.
4-I. Population Surges in Earth History

The 3 skulls shown are from right to left: modern human, Homo erectus, and Australopithecus. All are hominids, meaning they walked upright.
As an excellent introduction to this chapter, teachers may wish to use World Population, which is the best-ever graphic simulation of human population growth. As the years roll by on a digital clock from 1 A.D. to 2030, dots light up on an illustrated map to represent millions of people added to the population. Historic references on the screen place population changes in context.
This video can be obtained from: http://www.populationeducation.org/index.php?option=com_content&view=article&id=24&Itemid=10
Students can graph human population on semi-log paper, and decide whether or not this growth is exponential. (On semi-log paper, the curve will be a straight line.) They can also extrapolate the population curve to the future using different growth rates. Students can be assigned research questions (located at the end of section 4-I) by groups and report back to the class for discussion.
4-II. Why Does Human Population Grow?
Reasons for each surge in population growth can now be summarized and analyzed.
| Elapsed time | Year | Human Population |
| ~2,000,000 | 10,000,000 BC | 5 – 10 million |
| 10,000 | 1 A.D. | 170 million |
| 1,800 | 1800 | 1,000,000,000 |
| 130 | 1930 | 2,000,000,000 |
| 30 | 1960 | 3,000,000,000 |
| 15 | 1975 | 4,000,000,000 |
| 12 | 1987 | 5,000,000,000 |
| 12 | 1999 | 6,000,000,000 |
| 12 | 2009 | 7,000,000,000 |
| 12 | 2022 | 8,000,000,000 |
| 2050 | ??? 8,500,000,000 ??? |
[See “worldometer” World Population by Year]
Doubling times have decreased rapidly since then: (in increases of 1 billion humans)
On October 12, 1999 the population of the Earth reached 6,000,000,000 – “Y6B”
A supplementary activity on life expectancy and survivorship curves developed by GSS participants could be added at this point. The activity follows: Authors are: Patty Brown, Diane Bernaciak, Bonita Deiter
Credits for sources used in this activity and write-up: Taggert, Biology Lab Manual, Gary Anderson.
Students can analyze the predictions of Malthus in light of the populations of nations and looking at the charts on doubling times for countries. https://populationeducation.org/
The investigation Population Growth Dynamics… Or… How Many Kids on the Block? is another activity that demonstrates the importance of reproductive age.
TG-PG4-1. Investigation:
Bubble, Bubble, Toil and Trouble
It is difficult for students to interpret population trends based on statistics only. A hands-on approach can be used to generate interest in this topic. This activity will involve students in gathering data and using it to develop a survivorship curve for a BUBBLE species.
~{}~
TG-PG4-2. Investigation:
How Many Kids on the Block?
Population Growth Dynamics
Developed by Charles Walsh, a GSS teacher
Vianny High School, St.Louis, MO
There is probably no issue that impacts our planet more directly than human population growth. There are other variables besides the number of children born. The following activity will show you what some of these other factors might be. Can you guess what a few of them are? Let’s find out what they are by doing the following.
Imagine dividing your own neighborhood into two parts by taking one side of your street vs. the other. By changing one variable, we will see how many people will be on each side of the street after 100 years. There is a catch! Here are the assumptions:
- Every child born in the neighborhood is female.
- Every female will have three children, all of whom are girls.
- Every female on the left side of the street, called the “A” side, will have their first child at the age of 30, the second child at the age of 31, and the third child at the age of 32. When their children get to that age, they will marry (add in the spouse) and have children at the same age as their parents.
- Every female on the right side of the street, called the “B” side, will have their first child at the age of 17, the second child at the age of 18, and the third child at the age of 19. When their children get to that age, they will marry (add in the spouse) and have children at the same age as their parents.
Each of you will start with one female on each side of the street. Find out how many people will be on each side of the street after 100 years. GOOD LUCK! (Hint..Remember, each female needs a spouse that they bring home with them, and that they either move in with their parents, or build a house on adjacent property. (In other words, they stay in the neighborhood.) How many families will there be on the block at the end of 100 years? The table below will get you started.
A. Number of times in 100 years they and their offspring will have children is _______
| Side of Street | Woman + Spouse | First Child | Second Child | Third Child | Total in 100 years |
| A |
B. Number of times in 100 years they and their offspring will have children is _______
| Side of Street | Woman + Spouse | First Child | Second Child | Third Child | Total in 100 years |
| B |
Graph your data, being sure to label your graph and give it a title.
Questions to Ponder:
- What was the reason why one neighborhood grew larger and faster than the other?
- Suppose you are in charge of establishing public policy with regard to population. Would the outcome of this exercise influence your decision-making process?
- Consider a country like India in which the vast majority of people are under the age of 25. What does this tell you about further population growth in India?
- Consider our own country: What do you predict will be the population pattern in the United States?
- 5. In which parts of the world are women more likely to limiting factors, or that humans have children at an early age? In which parts of the will act to control the size of their United States? Give reasons for your answer and be prepared to justify your reasons.
- As you have seen by the results of this activity, populations grow exponentially. In nature, there are limiting factors which prevent overwhelming population growth. What might be some limiting factors on human population growth?
- Which do you think is more likely to happen; that the human population will be restricted by some natural limiting factors, or that humans will act to control the size of their population? Defend your answer by giving reasons.
Investigation 4-4. Population Growth in the United States. Students will now learn that a rate can decrease,but that a population can still increase. It is very interesting to graph the rate of growth as well as do a population curve.
After examining population pyramids, teachers may wish to use an activity where students analyze pyramids. It can be downloaded as a pdf file at: http://www.populationeducation.org/
You may wish to use the following data in 4-VIII and 4-IX with students to help them understand the relationship the U..S. population has with the rest of the world:
You decide: which country is the most overpopulated in terms of resource consumption and creation of environmental damage?
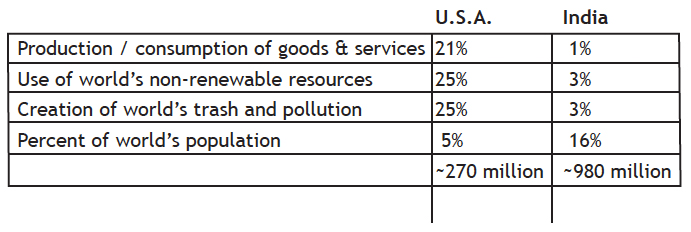
Percentage of the world’s resources consumed by Americans: 30% [Denis Hayes, “Eco-Nomic Power,” Seattle Weekly, November 10, 1993, p. 15.]
The amount of energy used by one American is equivalent to that used by:
- 3 Japanese
- 6 Mexicans
- 14 Chinese
- 38 Indians
- 168 Bangladeshi
- 531 Ethiopians
[Sandy Bauers.]
A person in the U.S. causes 100 times more damage to the global environment than a person in a poor country. [Dianne Dumanoski, “The People Problem,” The Boston Globe, February 5,1990, citing Paul Ehrlich.]
Percentage of fossil fuel used annually that is consumed by the U.S.: 25% [Peter A. A. Berle, “Beyond Rio: The Real Challenge,” Audubon, September-October 1992, p. 6.]
Since 1940 Americans alone have used up as large a share of the earth’s mineral resources as all previous generations put together.
[Alan Thein Durning, How Much Is Enough?, p. 38]
In the last 200 years the United States has lost:
- 50% of its wetlands
- 90% of its northwestern old-growth forests
- 99% of its tallgrass prairie and up to 490 species of native plants and animals with another 9,000 now at risk.
[The 1993 Information Please Environmental Almanac, compiled by World Resources Institute (Boston & New York: Houghton Mifflin, 1993), p. 159.]
Minerals due to run out in 50 years: copper, lead, mercury, nickel, tin and zinc.
[The World Resources Institute, World Resources 1992-1993 (New York: Oxford University Press, 1992), pp. 320-21]
Portion of U.S. water pumped annually from the groundwater supply that is not renewable: one-fifth
[Sandra Postel, “Increasing Water Efficiency,” Lester R. Brown et al, State of thc World 1986 (New York: W.W. Norton, 1986), p. 59.]
Amount of rural land in the United States turned over to development every day: 9 square miles
[Alan Thein Durning, How Much Is Enough?, p. 148]
Number of acres we blacktop each year: 1.3 million acres (equal to the state of Delaware)
[David Pimentel, panelist, “United States Carrying Capacity Overview,” Carrying Capacity Network conference, Washington, D.C., 1993.]
Number of acres of cropland we lose to erosion each year: 1 million [Ibid]
Per capita American consumption of soft drinks in 1989: 186 quarts Per capita American consumption of tap water in 1989: 149 quarts
[Alan Durning, “Asking How Much Is Enough,” State of the World 1991, p. 160 ]
Total energy consumed in producing a 12-ounce can of diet soda: 2,200 Calories. Total food energy in a 12-ounce can of diet soda: 1 Calorie
[David Pimentel.]
Within the lifetime of a child born today, virtually all of Earth’s petroleum will be burned, and Earth’s fuel tank will be empty.
[Gerald O. Barney, Global 2000 Revisited (Arlington, VA, Millenium Institute, 1993), p.31.]
You Think a Gallon Of Gas Is Expensive?
This might put the question in perspective:
[2020 prices]
Gasoline was about $1.50/gallon.
Diet Snapple 16 oz $1.29 ….$10.32 per gallon
Lipton Ice Tea 16 oz $1.19…$9.52 per gallon
Gatorade 20 oz $1.59 ……..$10.17 per gallon
Ocean Spray 16 oz $1.25…..$10 .00 per gallon
Brake Fluid 12 oz $3.15 ……$33.60 per gallon
Vick’s Nyquil 6 oz $8.35……$178.13 per gallon
Pepto Bismol 4 oz $3.85 …..$123.20 per gallon
Whiteout 7 oz $1.39 ……….$25.42 per gallon
Scope 1.5 oz $0.99…………$84.48 per gallon
and this is the REAL KICKER……
Evian water 9 oz for $1.49 ..$21.19 per gallon
$21.19 FOR WATER! ….and the buyers don’t even know the source.
So, the next time you’re at the pump, be glad your car doesn’t run on Scope, or Whiteout, or Heaven forbid, PEPTO BISMOL or NYQUIL!!!!
It is easy to continually blame someone else for the world’s population problems. It needs to be pointed out that the U.S. is the third most populated nation in the world, and that is first in the use of resources. Therefore, the U.S. impact on the environment is the most destructive. Emphasis also needs to be put on what students can do, so that they feel empowered, not helpless.
~{}~
Objectives [] Assessment [] Resources
Guides for each Chapter: 1 – 2 – 3 – 4 – 5 – 6 – 7 – 8
Index of TG Investigations
Guide for Chapter 5:
The Environmental Impact of Populations
5-I. Chinese Population Impact on the Environment. China’s population policy is in flux. Teachers will probably have to check for the most recent changes to provide for accurate information on China. A good source for updates on information is the Population Reference Bureau http://www.prb.org/
China attended the International Conference on Population and Development (ICPD) in 1994 and is a party to its Program of Action. Prior to the ICPD, the Government announced its intention to move from an administrative family planning approach to a reproductive health/family planning service-oriented approach, focused on the needs of clients. This new orientation was reflected in the Guidelines on Family Planning Work in China, 1995-2000. China is also a party to the Platform for Action of the Fourth World Conference on Women, held in Beijing in 1995, and has formulated a Chinese National Platform for Action.
5-II. India’s Impact on the Environment. India is also a nation where population is growing rapidly, and numbers must be updated. The continual natural disasters in India are often a result of misuse of the land by populations. The conditions in its cities are a good topic for a report by students, and some of them might be interested in investigating the work of Mother Theresa and her nuns.
5-IV. Land for food vs. land for dwellings. Some students may be sensitive about what they do or do not eat, and may not be truthful. They have a great deal of difficulty in estimating amounts of food consumed, and may need a great deal of help in measurement. There is a program put out by esha research called the Food Processor which will help with food analysis by students. [site was http://www.esha.com/foodprosql]
Students can obtain pictures of their local area from many years ago and from the present day, and compare the resources available. Sometimes resources may have increased, rather than decreased. A discussion can ensue regarding the renewable and non-renewable resources of the region.
The population of a local area can be analyzed in the same way. How was it 100 years ago as compared to today? What are some of the results of increased population on the student’s living area? Was there migration, or immigration? Was there conflict? Are there increases in pollution? (In some cases, where waterways have been cleaned up, there are decreases in pollution.) What happens to solid waste in your town? Where does the sewage go? Students could benefit greatly from a field trip to the solid waste disposal facility or to the sewage disposal plant. Wealth is hard to define. GNP is often used, but as you can see, it is not infallible as an indicator of wealth. What can be compared is what currency will buy for a comparable standard of living. Some people have used a McDonald’s meal as an indicator for comparison, but this can also be misinterpreted. (http://www.oanda.com/products/bigmac/bigmac.shtml for comparison)
Some say economic growth is a sign of wealth and a healthy economy for all. However, the earth is finite and growth is infinite. There has to be a point where growth slows. No one knows what will happen under those conditions.
~{}~
Objectives [] Assessment [] Resources
Guides for each Chapter: 1 – 2 – 3 – 4 – 5 – 6 – 7 – 8
Index of TG Investigations
Guide to Chapter 6
One Child
Episodes 1-4 are stories that attempt to show what it may have been like to live in China under its very restrictive population policy.
6-I. Why Have Such Policies Been Used in China? contain an explanation for such a policy in China. It is necessary that students examine this topic from all sides since they are very likely to encounter the problems presented in this chapter at some time in their lives.
6-II. Results of China’s Population Control Policy. It is also important that students be informed regarding the position taken by the government of the United States, and by the United Nations under these controversial conditions. They need to know the results of China’s policies and decide whether the results justified the methods used.
6-III. The Case of India. Here students get to see what India has been doing about its population problems, and to decide whether or not they have worked.
~{}~
Objectives [] Assessment [] Resources
Guides for each Chapter: 1 – 2 – 3 – 4 – 5 – 6 – 7 – 8
Index of TG Investigations
Guide to Chapter 7
Can We Limit Human Population Growth?
This is a very controversial chapter, but a very crucial one.
7-I and 7-II
Students should have realized that the earth is finite, and that populations cannot continue to expand at the present rate without major political and social disruptions. They should be able to list reasons why it is important to limit population growth. However, they should also realize that there are no easy solutions.
Contraception and Religionarticle
Students examine religious and cultural stands on population control. Students need to know that there is no method of birth control that works 100 per cent of the time other than total abstinence. They also need to know that there are better solutions than abortion, and that the education of women leads to better methods of controlling population.
You may decide that you wish to use the following information for discussion and debate in your classes:
Many different human groups from different cultures and religions cannot agree on acceptable methods of limiting populations, both at the time of birth, and the time of death. We know that limiting population growth requires that the birth rate be lower than the death rate. Thus, the debate among humans is centered on the discussion of when life begins and whether or not a human embryo is a human being, as well as when life should end. It also centers on what methods are acceptable to prevent conception. Let us begin with what we know about human reproduction and development of human embryos.
The process leading up to the birth of a newborn baby can be divided into many steps:
- About 1 month before conception: An adult male produces thousands of spermatozoa (male germ cells) each second. It would take about 500 of them lined up in a row to total 1 inch in length. They take a month or so to travel through a long tube called the “vas deferens” and are stored in a small reservoir inside the man’s prostate gland, where semen (a mixture of spermatozoa and fluids) is formed.
- Perhaps one day before conception: The woman ovulates and produces one ovum (egg cell) that travels down one of her fallopian tubes. It is about 1/100″ in diameter, and is barely visible to the eye.
- at conception: One very lucky sperm out of hundreds of millions will penetrate the outside layer of the ovum and fertilize it. The surface of the ovum changes its electrical characteristics and prevents additional sperm from entering the ovum. A genetically unique entity is formed shortly thereafter, called a zygote. Half of its 46 chromosomes come from the egg and the other half from the sperm. It has a unique DNA structure. This is the point that most, or all, Pro-Life groups define as the start of pregnancy. They also define this as the transition from life (in the form of an ovum and sperm) to human life as a person.
- 5 days or so after conception: The fertilized ovum, called a blastocyst, has traveled down the fallopian tubes and has started to attach itself to the endometrial, the wall of the womb.
- 12 days or so after conception: The blastocyst has fully attached itself to endometrium This is the event that physicians and most (or all) Pro-Choice groups define as the start of pregnancy. If instructions are followed exactly, a home-pregnancy test may reliably detect pregnancy at this point, or shortly thereafter.
- 2 weeks: It is now called an embryo. It is a very small piece of undifferentiated tissue.
- 3 weeks: The embryo is now about 1/12″ long, the size of a pencil point. It most closely resembles a worm – long and thin and with a segmented end. Its heart begins to beat about 18 to 21 days after conception. By this time, the woman’s period would have been missed; she might suspect that she is pregnant and conduct a pregnancy test. If it is an unwanted pregnancy, she might have arranged and carried through with a deliberate termination of pregnancy by this time.
- 4 weeks: The embryo is now about 1/5″ long. It looks something like a tadpole. The structure that will develop into a head is visible, as is a noticeable tail. The embryo has structures like the gills of a fish in the area that will later develop into a throat.
- 5 weeks: Tiny arm and leg buds have formed. Hands with webs between the fingers have formed at the end of the arm buds. Fingerprints are detectable. The face“has a distinctly reptilian aspect.” 1
- 6 weeks: The embryo is about 1/2″ long. The face has two eyes on the side of its head; the front of the face has“connected slits where the mouth and nose eventually will be.”
- 7 weeks: The embryo has almost lost its tail.“The face is mammalian but somewhat pig-like.”
- 2 months: The embryo’s face resembles that of a primate but is not fully human in appearance. Some of the brain begins to form; this is the “reptilian brain” that will function throughout life. The embryo will respond to prodding, although it has no consciousness at this stage of development.
- 10 weeks: The embryo is now called a fetus. Its face looks human; its gender may be detectable.
- 3 months: The fetus is about 3 inches long and weighs about an ounce. Nails and bones can be seen. Over 90% of deliberate terminations of pregnancies are performed before this stage.
- 4 months: 8″ long and weighing a half pound, the fetus’ movements may be felt. Its heartbeat can usually be detected.
- 5 months: 12″ long and weighing about a pound, the fetus’ has hair on its head. Its movements can be felt. A deliberate termination of pregnancy is usually unavailable at this gestational age because of medical society regulations, except under very unusual circumstances. Halfway through this month, the fetus’ lungs may be developed to the point where it has a chance to live on its own.
- 6 months: 14″ long and almost two pounds. The lungs’ bronchioles develop. Interlinking of the brain’s neurons begins. Some rudimentary brain waves can be detected. State laws generally outlaw deliberate termination of pregnancy at this stage, except under very unusual circumstances.
- 7 months: 16″ long and weighing about three pounds. Regular brain waves are detectable which are similar to those in adults.
- 8 months: 18″ long and weighing about 5 pounds
- 9 months: 20″ long and with an average weight of 7 pounds, the fetus’ is born about this time.
http://www.religioustolerance.org/abo_fetu.htm
The video Life Before Birth or the Mayo Clinic web site (https://www.mayoclinic.org/healthy-lifestyle/pregnancy-week-by-week/in-depth/prenatal-care/art-20045302) also show the above steps pictorially.
There are excellent videos available at minimal cost which show what is being done to control human population. You can find the resources available in your area by going to http://www.google.com and putting in human population videos as your search words.
7-V. Education and Emancipation of Women and 7-VI. Women’s Rights. Students look at the effects of the emancipation of women on population growth. A full investigation and discussion of the rights of women in many nations can be facilitated at this point. A great deal of information can be obtained on this issue at the UN website: https://www.unfpa.org/ and https://www.undp.org/jposc/united-nations-partnerships/unfpa
7-VIII. The Future of Population Growth takes a look at pyramids again to remind students that the age of the population has a definite influence on future demographics.
~{}~
Objectives [] Assessment [] Resources
Guides for each Chapter: 1 – 2 – 3 – 4 – 5 – 6 – 7 – 8
Index of TG Investigations
Guide to Chapter 8
Choosing a World
This chapter ends the book on a positive note; making the point that we all can choose the kind of world we want to live in by making decisions now about our world.
8-I. Tres Amigos
In the story Tres Amigos, a student can read about the difficult decisions being made by people in other countries about how they live their lives. Students can look for other stories and other examples of difficult choices. Perhaps their ancestors had to make such a difficult choice when they chose to migrate to this country.
8-II. Tragedy of the Commons
If time allows, every student, or at least every teacher, should read the Tragedy of the Commons as a basis for discussion. It is copied from http://dieoff.org/page95.htm
(or http://www.constitution.org/cmt/tragcomm.htm)
Footnote references may be found at those websites also.
The Tragedy of the Commons,
Garrett Hardin, Science, 162(1968): 1243-1248.
You may also decide to have students read The Tragedy of the Common Revisited, by Beryl Crowe (1969).
8-IV. Where Do We Go From Here and 8-V. A Sustainable World
Point out to students that we are a a critical time in history when the path we take will determine the future of the planet. How can we make it a better world?
Investigation 8-2. The Road Not Taken
In choosing a world, there are many heroes who took the more difficult road. Below is the story of what one man decided to do about what was happening to the rain forests. Chico Mendes gave his life in a cause he believed in. The movie, The Burning Season, is about the life and sacrifice of Chico Mendes.
December 22nd , 1998 marked the tenth anniversary of the assassination of Amazon rubber tapper, union leader and environmentalist Chico Mendes. In honor of Chico Mendes life and work, on the occasion of the tenth anniversary of his death, the Environmental Defense Fund (EDF) has launched the Chico Mendes Sustainable Forest Campaign, in partnership with the National Council of Rubber Tappers of Brazil. The campaign promotes the creation of new “extractive reserves”, Chico’s concept of reserves managed by forest peoples.
“If a messenger from the sky came down and guaranteed that my death would strengthen our struggle, it would be worth it. But experience teaches us the contrary. It’s not with big funerals and motions of support that we’re going to save the Amazon. I want to live.”
— Chico Mendes
(From an interview December 9, 1988, published posthumously in O Jornal do Brasil.) Image and Quote appear courtesy of The Chico Mendes Sustainable Rainforest Campaign About Chico Mendes: Remembering Chico (Words and photos by Stephan Schwartzman)
So that students do not feel so powerless, they could be asked to find the answers to the following questions, and to read the following quotes:
How many did it take to rescue the man on the Jericho road? One good Samaritan.
How many did it take to confront Pharaoh and lead the Exodus? One man – Moses.
In 1645, one vote gave Oliver Cromwell control of England.
In 1776, one vote gave America the English language instead of German.
In 1868, one vote saved President Andrew Jackson from impeachment.
In 1941, one vote gave Adolph Hitler control of the Nazi party!
Esther, a Jewish girl who was married to a pagan king, broke longstanding tradition, marched into her husband’s throne room, spoke her mind and rescued her nation from a Holocaust. One woman – only one – saved the nation, because she was willing to get personally involved to the point of sacrifice. She said, “If I perish, I perish” (Est 4:16).
Before you say, “Somebody else should be doing this instead of me,” read these words: “I am only one, but I’m still one. I cannot do everything – but I can do something. And because I cannot do everything, I will not refuse to do something that I can do.” In the words of Eleanor Roosevelt, “It’s better to light a candle than to curse the darkness.”
Students could be asked to search for other individuals who made a great difference in the world.
“Never doubt that a small group of thoughtful, committed citizens can change the world, indeed it’s the only thing that ever has”
Margaret Mead, Anthropologist
Students should feel hopeful and empowered upon finishing this book.
~{}~
Objectives [] Assessment [] Resources
Guides for each Chapter: 1 – 2 – 3 – 4 – 5 – 6 – 7 – 8
Index of TG Investigations
Index of Teacher Guide Investigations
- TG-PG1-1. Cells On The Grow
- TG-PG2-1. Mark and Recapture
- TG-PG4-1. Bubble, Bubble, Toil and Trouble
- TG-PG4-2. How Many Kids on the Block?
~{}~
Objectives [] Assessment [] Resources
Guides for each Chapter: 1 – 2 – 3 – 4 – 5 – 6 – 7 – 8
Index of TG Investigations
Resources for Teaching Population Growth
For latest material relevant to Population Growth,
see the Stay Current section of the GSS website.
The list below is from the original development of GSS and is out of date and in no way exhaustive for the resources that are available for teaching ecosystem change and related topics.
Organizations
Population Reference Bureau, from Population Reference Bureau, 1875 Connecticut Ave., N.W., Suite 520, Washington, DC 20009-5728. Various types of information dealing with population education and activities.
World Resources Institute, from World Resources Institute, 1709 New York Ave, N.W., Washington, DC 20006, (202) 638-6300. The institute deals with population education and activities.
World Watch Institute, from World Watch Institute, 1776 Massachusetts Ave. N.W., Washington, DC 20036, (202) 452-1999. This institute deals with population education and activities.
Zero Population Growth, Inc., from Zero Population Growth, Inc., 1400 Sixteenth St., N.W., Suite 320, Washington, DC 20036, (202) 332-2200. Deals with population education and activities.
Software and CD-ROMs
Earthquest Explores Ecology, from Earthquest Inc., 125 University Ave., Palo Alto, CA 94301, (415) 321-5838. Students can explore and learn about the major Earth ecosystems and the vital relationships and cycles that sustain all life through this program.
EnviroAccount, from EnviroAccount Software, 605 Sunset Court, Davis, CA 95616, (800) 688-9006. A personal environmental impact accounting software that enables the user to keep an environmental record as the year progresses.
Ecomap, from Planet Software, P.O. Box 45, Pitkin, CO 81241, (303) 641-5035. A new electronic atlas that helps students and teachers visualize the placement and variety of global ecosystems.
1:2,000,000-Scale Digital Line Graph Data, from U.S.G.S. National Mapping Division, Earth Science Information Center, 507 National Center, Reston, VA 22092, (703) 648-6045. Contains data for all 50 states, organized into 21 geographic regions. The data are from late 1979 to the present. Categories of data include: political boundaries, administrative boundaries, streams, water bodies, hypsography, roads and trails, railroads and cultural features.
World Weather Disc, from CD-ROM Inc. Contains massive meteorological data base that describes the climate of the Earth today and during the past few hundred years. The disc includes many of the sought after meteorological data sets held in the archives of the National Climatic Data Center and the National Center for Atmospheric Research. The data sets offer information on a wide variety of questions ranging from the nature of global temperature trends to inquires about the weather at specific locations around the world.
The USA Factbook, from Wayzata Technology, 800-735-7321 or 612-447-7321. An electronic almanac of the fifty United States and its territories [sic]. Includes information about vital statistics, economies, transportation, geography, traditions, etc. Published annually. Macintosh only.
Alaskan Marine Contaminants Database, from Dr. Jaweed Hameedi, NOAA/OAD, Alaska Office, 222 W. 8th Ave., Anchorage, AK 99513. This disc contains data collected from 35 studies of the marine waters of Alaska and includes information about the areas of study, contaminants, and the quality of the data. The database allows oceanographic chemists to access data from the past decade.
Environmental Data Disc, from Environmental Data Dis, PEMD Education Group, PO Box 39, 178 Vine Street, Cloverdale, CA 95425, 707-894-3668. Contains 70 Data Stacks. It has critical numerical data bearing on a number of environmental challenges. It contains the following: General environmental data from the World Resources Institute, Global Change Climate Data from the Carbon Dioxide Information Analysis Center, United States temperature and precipitation data from 1918-1987, bearing of the Greenhouse Effect, worldwide food and agricultural data, world demographic data, atmospheric ozone data from 106 stations across the world and sample energy, economic and trade data from the industrialized countries. Macintosh only with CD-ROM reader, Hypercard 2.0 (incl.) and System 6.07 (incl.) or 7.0
Bathymetry of Monterey Bay Region, from USGS Department of the Interior, 810 National Center. Reston, VA 22092. High Resolution bathymetry and selected geoscience for the Monterey Bay region.
Global Ecosystems Database, from US EPA, NOAA National Geophysical Data Center, 325 Broadway, Boulder, CO 80303. Major databases on atmospheric data, vegetative patterns, etc. IBM/compatible, DOS format only.
GEO-disc US Atlas, from CD-ROM Inc., 1667 Cole Blvd., Ste 400, Golden, CO 80401, 303-231-9373; FAX: 303-231-9581. A CD-ROM geographic database that contains a complete digital representation of the United States at the 1:2,000,000 scale. It includes major highways, waterways, political boundaries, railroads, federal land areas, and hydological districts [sic]. In addition, it contains a complete place and landmark names file of more than one million entries, each with the appropriate coordinate information to allow it to be placed on the map. Using the Windows/On the World application software program written for the Microsoft Windows 3.0 allows complete interactive vector graphics capability, ability to generate accurate map overlays, ability to display distance, bearing and position information, links to external databases, ability to cut and paste maps to other documents. IBM/compatible, with Windows only.
North American Indians, from CD-ROM Inc., 1667 Cole Blvd., Ste 400, Golden, CO 80401, 303-231-9373; FAX: 303-231-9581. A text/image database on the history of Native Americans. Included are leadership, tribal heritage, religion, family life, and customs. IBM/compatible or Macintosh.
1990 Census Data, from CD-ROM Inc., 1667 Cole Blvd., Ste 400, Golden, CO 80401, 303-231-9373; FAX: 303-231-9581. The 1990 census data are provided in dBase III format, allowing you to use it with a number of third party software programs. In addition, the data are provided by ZIP Code, as well as by tract, place county, state, and the US. IBM/compatible only.
Water Resource Abstracts; Volume 1., from CD-ROM Inc., 1667 Cole Blvd., Ste 400, Golden, CO 80401, 303-231-9373; FAX: 303-231-9581. 1967-present. The entire 225,000 abstracts of the USGS on one disc. Advanced software features make this disc of choice for the USGS and any other users. A NISC DISC Publication. IBM only.
Wildlife and Fish Worldwide — Volume I, from CD-ROM Inc., 1667 Cole Blvd., Ste 400, Golden, CO 80401, 303-231-9373; FAX: 303-231-9581. 1971-present. More than 200,000 citations from the US Fish and Wildlife Services Wildlife Review and Fisheries Review. Excellent subject coverage, taxonomic, and geographic identifiers as specific as the county, community, lake, and stream level make this CD-ROM an excellent choice for the natural resource researcher. Semi-annual updates. IBM/compatible only.
Population Statistics, from CD-ROM Inc., 1667 Cole Blvd., Ste 400, Golden, CO 80401, 303-231-9373; FAX: 303-231-9581. Full range of population and housing characteristics from the 1980 census for states, metro areas, counties, places of 10,000 or more, and other areas. Also Census Bureau population estimates by age, race, and sex for counties through 1984; population and per capita income estimates for 40,000+ areas for 1980 and 1986; and census population projections through 2010. SEARCHER search and retrieval software included with the disc searches the databases, creates and prints reports, generates files for use with other computer programs. IBM/compatible only.
Acid Rain, from University of Vermont, Bailey/Howe Library, Burlington, VT 05405-0036, Attn: Albert Joy, 802-656-8350. A selection of more than 100 Canadian federal and provincial documents, many in French and English. There are also over 6000 images in the two disk set. IBM/compatible only (386+).
Wildlife and Fish Worldwide — Vol. 1, from National Information Services Corp. Citations from the US Fish and Wildlife Service’s Wildlife Review and Fisheries Review. Over 200,000 in-depth records of taxonomic and geographic identifiers.
1989 Toxic Release Inventory, from Government Printing Office, N. Capitol and H Streets, NW, Washington, DC 20401, 202-783-3238. The complete National 1989 Toxic Release Inventory and Hazardous Substances Fact Sheets containing reference materials on the health and ecological effects of the regulated substances. IBM/compatible only.
Pacific Ocean Temperature and Salinity Profiles, from National Oceanographic Data Center, 1825 Connecticut Ave., NW, Room 404, Washington, DC 20235, Attn: Richard Abram, 202-673-5591. Over 1.3 million Pacific Ocean temperature-depth and salinity-depth profiles taken from 1900 and 1988. IBM/compatible only.
Agricola, from Quanta Press, Inc., 2550 University Ave. W., Ste. 345N, St. Paul, MN 55114, 612-641-0714. Contains the bibliographic cataloging and indexing records of the National Agriculture Library, from 1985 to the present. IBM/compatible only.
Earth Science Data Directory (ESDD), OCLC Online Computer Library Center, Inc.
6565 Frantz Rd., Dublin, OH 43017-0702, Attn: Mary Marshall, 614-764-6000. Contains over 155,000 bibliographic records of the acquisitions of four of the USGS libraries since 1975. IBM/compatible only.
Arctic and Antarctic Regions, 1950-Present, from National Information Services Corp. More than 260,000 abstracts and citations from six important databases dealing with the Arctic and Antarctic regions.
Videos
Ozone: The Hole Story, from Ozone: The Hole Story, 5000 Park St., North, St. Petersburg, FL 33709, 800-243-6877. Originally shown on PBS. Three 20-min. segments. Investigates sources of, and possible solutions to, upper level ozone depletion. Through interviews with ozone researchers and computerized graphics, Emmy-award-winning newscaster Bill Kurtis explains some little-understood myths about this critical environmental issues. An accompanying Teaching Guide provides suggestions for using this video effectively.
Infinite Voyage (Crisis in the Atmosphere), from PBS? Deals with connections between many GSS phenomena but focuses mainly on global warming. It shows evidence for the phenomena, current research, and offers solutions. One 15 minute segment deals with DR. Rosenfeld of Cal Berkeley and his research on ways of conserving energy. Excellent video.
World Population (Revised Edition), Zero Population Growth, Inc., and Southern Illinois University at Carbondale, available from ZPG, 1400 16th Street, N.W., Suite 320, Washinton, D.C. 20036 (202) 32-2200. This short (6-1/2 minute) video is a graphic portrayal of human population growth since the year 1 AD. Dots which represent 1 million people each appear on the globe as time progresses in the simulation. The video comes with a guide that contains suggestions for questions and activities for use while viewing the video, and to deepen students’ understanding of concepts such as logarithmic growth.
Bibliography for Population Growth
Climate Change: The IPCC Scientific Assessment, Cambridge Univ. Press, New York. This is THE “scientific consensus” that A Planet Under Siege refers to in Chapter 7. It is full of all the details and figures you’ll ever want to know about climate change processes, effects, uncertainties, modelling, etc. Put together by a team of several hundred renowned scientists from around the world. There is a “Policymakers’ Summary” for this nicely summarizes the guts of the main volume extremely well. Not sure how available it is.
Governmental Publications
USA by Numbers: A statistical portrait of the United States. (Susan Weber, Ed., 1988), from Zero Population Growth, Washington, DC. An update is in progress using the 1990 census. A Teaching Kit is available to accompany the book.
Trends ‘90 (Boden, TA, Kanciruk, P., and Farrell, MP, 1990), from Carbon Dioxide Information Analysis Center, Oak Ridge, TN. A compendium of data on global change. Data tables and graphs from frequently used research reports on atmospheric CO2 and methane concentrations, sources of emissions, and temperature trends. See also the bibibliography in the GSS Population Growth Student Book