TG-PG4-1. Bubble, Bubble, Toil and Trouble

{ GSS Teacher Guide Index } { All GSS Books }
Introduction
It is difficult for students to interpret population trends based on statistics only. A hands-on approach can be used to generate interest in this topic. This activity will involve students in gathering data and using it to develop a survivorship curve for a BUBBLE species.
Objective
To simulate a population of “Bubbles” and to determine the survivorship pattern of that species.
Concept
Survivorship is an expression of how long members of a group of newborns survive. A survivorship curve is constructed by following the fate of young individuals throughout their lives, in order to describe mortality at different ages. Some individuals in a population may die before they mature and reproduce. Other members of the same species may live to an old age. Many factors contribute to the mortality rate. In general, the pattern of mortality is characteristic of a species or of a population.
“…all species have a reproductive potential that will result in a population explosion if a high percentage of offspring survive to adulthood and reproduce. What keeps natural populations in check is environmental resistance, factors which cause the dieoff of a high percentage of young before they reach reproductive age. Until the last century or so this situation pertained to the human species as well.” (1990, Nebel)
Disease often limited populations prior to the late 1800s. Although reproductive rates were high, child mortality rates were also high, so the population remained relatively steady. With the development of medicine, vaccines, and improvements in sanitation, there was a decrease in infant and childhood mortality. This drop in mortality can be seen as an increase in survivorship.
The graph on the student activity sheet (Survivorship Curves graph) indicates the three general patterns of survivorship. Type I shows a population in which most individuals survive their early years and die during the last part of their life span. An example would be in developed nations, like most areas of the United States. Type III demonstrates the other extreme; there is a high mortality during infancy and childhood. This occurs in areas with limited medical technology or proper sanitation. Type II indicates that individuals in the population have an equal chance of dying at any age.
Materials
Each group of 3-4 students will need: one cup of bubble solution 4 straws stop watch or timing device plastic bag, wax paper, or tray
Preparation
It is better to make up the bubble solution the day before performing this activity. To make the solution, you will need to mix 8 cups of water with 1/2 cup liquid dish soap, and 1 teaspoon glycerin (optional). This amount will be enough for 8 groups of 4 students (32 students total). Each group will use 1 cup or less of the bubble solution.
Doing The Activity
Be sure the students understand the following terms:
- species-group of organisms with similar characteristics that can interbreed and produce fertile offspring
- population-a group of members of the same species in an area at a certain time
- life span-longest length of time any one member of a species lives
- survivorship curve-starting with a population of 1000, a survivorship curve indicates the number that will reach each age.
- mortality rate-death rate
Students should be prepared by doing the first part of the lab before “birthing” the bubbles. This pre-lab activity could be done as homework or in- class activity.
Divide students into groups of 3-4. Have students prepare surface by putting a thin layer of bubble solution on plastic trays, bags, or table tops(not wooden).
Explain to students that in creating their bubble population, each individual bubble should be at least 15 cm in diameter. Having a 15 cm circle drawn on the tray or area will help students create standard size bubbles. It is helpful that bubbles do not touch each other. This activity takes two class periods; one to collect data and another for graphing and follow- up questions. If time is limited, teachers may have students pool data to reach the 50 bubble population.
Making Conclusions
The teacher needs to make the connection between survivorship curves and human population growth. It is important to recognize that countries with a high child mortality rate have fewer members reaching reproductive age.
A factor that has had great impact on human population growth was the advancement of medical treatment. Because improved medical treatment decreased childhood diseases, the mortality rate declined.
References
Nebel, Bernard J. (1990). Environmental Science: The Way the World Works. 3rd Edition. Englewood Cliffs, NJ: Prentice Hall. Taggert, (1989). Laboratory Manual in Biology.
Going Further
- Study the effect of female infanticide in China on population growth.
- Visit a local historical cemetery and identify ages of death. Determine trends. Graph data as was done in the Bubble activity.
- Collect obituaries and identify data concerning age of death. Identify patterns based on mortality of 100 individuals.
BUBBLE SURVIVORSHIP
Objective: To simulate a population and demonstrate a survivorship pattern.
Introduction:
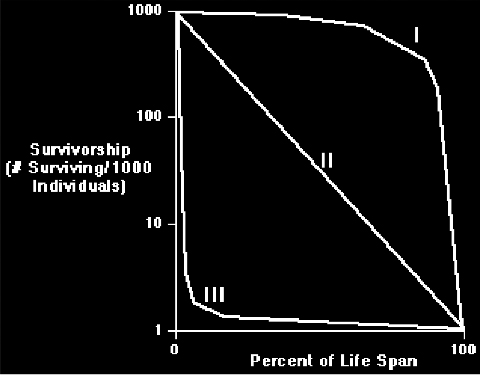
Individuals in a population may die before they mature and reproduce. Other members of the same species may live to an old age. In general, the pattern of mortality is a characteristic of each species. This pattern of mortality can be shown by a type of graph called a survivorship curve. A survivorship curve is constructed by following the fate of young individuals through their lives, in order to describe mortality at different ages. There are three general types of survivorship curves. Study the graph and answer the questions based on your interpretations.
This Figure Illustrates the Three Types of Survivorship Curves
In some populations (I), nearly all individuals survive for the potential life span and die almost simultaneously (e.g., human). In others (II), survivorship remains the same throughout the life span (e.g., Hydra). In some others, survivorship of young individuals is low but survivorship is high for the remainder of the life span (e.g., many marine invertebrates with planktonic larvae).
Interpretation questions:
- Which survivorship curve shows that most of the individuals die at an early age?
- Which survivorship curve shows most of the offspring surviving to maturity?
- Which survivorship curve shows an initial period of high mortality due to genetic defects or accidents during development, birth, or hatching, then a constant number of individuals dying at any age?
- Which survivorship curve would be for fish or insects?
- Which survivorship curve would be for prosperous human populations?
- Which survivorship curve would be associated with animals, like polar bears, that devote considerable care to a few young?
Procedure:
- Wet your tray with bubble solution and practice blowing bubbles onto the tray.
- Give “birth” to a bubble and time its life span in seconds. Bubbles should be about 15-20 cm in diameter.
- Record the data on your Bubble Population Data Sheet
- Repeat for a total population of fifty bubbles.
- Graph your results by plotting the age in seconds along the horizontal axis and the percentage surviving along the vertical axis.
- Examine your survivorship curve and answer the analysis questions.
Download .pdf of data sheet.