TG Losing Biodiversity
{ GSS Teacher Guide Index } { All GSS Books }

~{}~
Objectives [] Assessment [] Resources
Guides for each Chapter: 1 – 2 – 3 – 4 – 5 – 6 – 7 – 8
Teaching Objectives
Goal 1: Students appreciate how we depend on the biodiversity of our planet.
- Objective 1A: Students can tell others about changes they have observed in their local environment, and categorize the changes by the impact on people and other species.
- Objective 1B: Students can describe the many values of biodiversity, and explain why the extinction of species is a problem.
- Objective 1C: Students can describe ethical issues related to sustaining biodiversity and give examples of laws that support environmental ethics.
Goal 2: Students perform scientific and mathematical studies and experiments that reveal the importance of conserving biodiversity.
- Objective 2A: Students can draw, map, document, and compare the diversity of species in a study plot.
- Objective 2B: Students can apply mathematics to: comparing species diversity, graphing population growth, simulating natural selection, and predicting the outcome of hybrid crosses.
- Objective 2C: Students can design and conduct experiments to investigate the properties of soil.
Goal 3: Students recognize the interdependence of life in the global system.
- Objective 3A: Students can give examples of renewable resources and why they are vulnerable to human impact. Objective 3B: Students can explain the concept of a keystone species, and give an example of how loss of a keystone species can impact the biodiversity of an entire region.
- Objective 3C: Students can explain the concept of natural selection and give examples of how this process can lead to the evolution of a new species.
- Objective 3D: Students can explain why it is important to conserve Earth’s library of genetic codes.
Goal 4: Students identify the many human activities that are impacting other species.
- Objective 4A: Students can identify, read, and collect news articles on biodiversity issues.
- Objective 4B: Students can give examples of how habitat destruction, overharvest of species, new technology, pest control, introduced species, plastics in the ocean, and military operations have contributed to the loss of biodiversity.
- Objective 4C: Students can conduct supermarket research to identify and compare the impacts of products on the environment.
Goal 5: Students recognize the important roles that individuals play in preserving diversity of life on our planet.
- Objective 5A: Students can describe several different perspectives of people who consider themselves conservationists.
- Objective 5B: Students can describe the work of several people wellknown for their work to conserve biodiversity.
- Objective 5C: Students can describe several kinds of community and youth action projects that are improving environmental conditions for people and other species.
Goal 6: Students contribute to educating others about the importance of conserving biodiversity, and take steps to reduce their own impact on the environment.
- Objective 6A: Students can recommend practical ways of improving the biodiversity of study plots.
- Objective 6B: Students can research both sides of a local issue and make recommendations for solutions based on evidence.
- Objective 6C: Students can share their findings about “green” products with others in the community.
- Objective 6D: Students can discuss their plans for reducing their own impact on the environment.
~{}~
Objectives [] Assessment [] Resources
Guides for each Chapter: 1 – 2 – 3 – 4 – 5 – 6 – 7 – 8
Assessment Tasks
1. Portfolio
We especially encourage the use of portfolios as a means of providing feedback to students and to demonstrate evidence of student progress to parents. Portfolios for Losing Biodiversity might include:
- Drawings, maps, and descriptions of organisms observed during the “Biodiversity Assessment” Field study.
- Mathematical calculations for “Estimate the Number of Bison Killed”.
- A graph of bison population growth.
- A letter to a newspaper editor about an environmental issue.
- Lab reports on “Comparing Soils.”
- Report for “Product Research” activity.
- A final essay for Chapter 8.
In addition to portfolios, we suggest that you use assessment tasks both before and after presenting the unit. The papers that students’ complete before beginning the unit will help you diagnose their needs and adjust your plans accordingly. Comparing these papers to the students’ responses on the same tasks after completing the unit will allow you to determine how their understanding and attitudes have changed as a result of instruction. The following are two tasks that can be used for pre- and post- assessment:
2. Questionnaire
These questions are designed to determine how students’ knowledge of key concepts have changed during the unit, and whether or not they have changed their opinions concerning personal actions and environmental issues.
[Losing Biodiversity Questionnaire page 2]
3. Concept Map
Asking students to create a concept map before and after the unit is one way to determine which concepts they have learned and their understanding of the connections among these concepts. If students have not had experience in concept mapping, you might want to start them out with a hand-out showing an example (master on p. 7), a general idea of what they are to map, and starting word(s) to help get them started. Once they have had experience with concept maps, they can create them on blank sheets of paper (no photocopying required). Alternatively, they can use concept mapping software such as
- Inspiration (http://www.inspiration.com)
- Decision Explorer (http://www.banxia.com).
- CMap (http://cmap.ihmc.us/conceptmap.html – free for noncommercial use).
- Omnigraffle (http://www.omnigroup.com/applications/omnigraffle Mac OSX)
- Freemind (http://freemind.sourceforge.net/wiki/index.php/
- Main_Page – open source software for mind-mapping.)
- Microsoft Draw (comes with Microsoft Office)
Losing Biodiversity—Concept Map
A concept map is a way of displaying your knowledge about a certain subject area. It consists of a set of words in boxes representing the most important ideas. The boxes are connected by lines and words showing how the ideas in the boxes are related. For example, at right is a concept map about the United States.
Your task is to create a concept map about the way life on Earth is diverse and interdependent. Your concept map should show ways of thinking about how species differ and affect each other. Start with the word “Life” at the top. (If you’d like more space, you can draw your concept map on the back, or on another sheet of paper.)
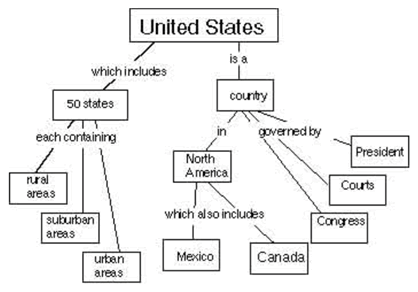
Life
Some possible key words to use: biology, biodiversity, extinct, extinction, species, inheritance, soil, bird, predatory, ocean, sustainable, habitat, bison, renewable, buffalo, Darwin, natural selection, evolution, population, organism, trait, mutation, genetic, diversity, soil, prairie, organizm, dust bowl, predatory bird, bird, ornithologist, ornithology, DDT, falcon, peregrine, ocean, ecosystem, food web, coral, coral reef, wetland, jellyfish, audubon, sea turtle, whale, dolphin, manatee, sea lion, marine, pollution, plastic, tuna, conservation, conserve, desert, old growth, forest, environmental ethics, ferret, Endangered Species Act, condor, woodpecker, wolf, eagle, owl, coyote, toxin, bald eagle, compost, garden, gardening, organic, organic gardening.
Interpreting Student Responses
The tasks should be interpreted in terms of the objectives listed above This is straightforward in the case of the questionnaire, where questions correspond to the objectives as follows:
| Goal | Objective | Questionnaire # |
| 1 | 1B | 1, 2 |
| 2 | 2B | 3 |
| 3 | 3A | 2, 3 |
| 3B 3C | 2 3 | |
| 4 | 4B | 4 |
| 4C | 5 | |
| 5 | 5B | 5 |
| 5C | 5 | |
| 6 | 6B | 4 |
| 6D | 5 |
The Concept Map is more loosely related to specific objectives. Comparing students’ papers before and after instruction may show that they have learned more about some objectives than others, and that some misconceptions persist while others have been corrected.
Pair students’ pre-and post-assessment papers and compare them. With the list of objectives in mind, look for changes in the students’ attitudes and understanding. As you look through the papers, write comments for individual students concerning main points they may have missed, or praise them for their insights and ideas. After looking over all of the papers, write down some generalizations for what the class as a whole learned or did not learn during the course.
–Get PDF of the Assessment Tasks—
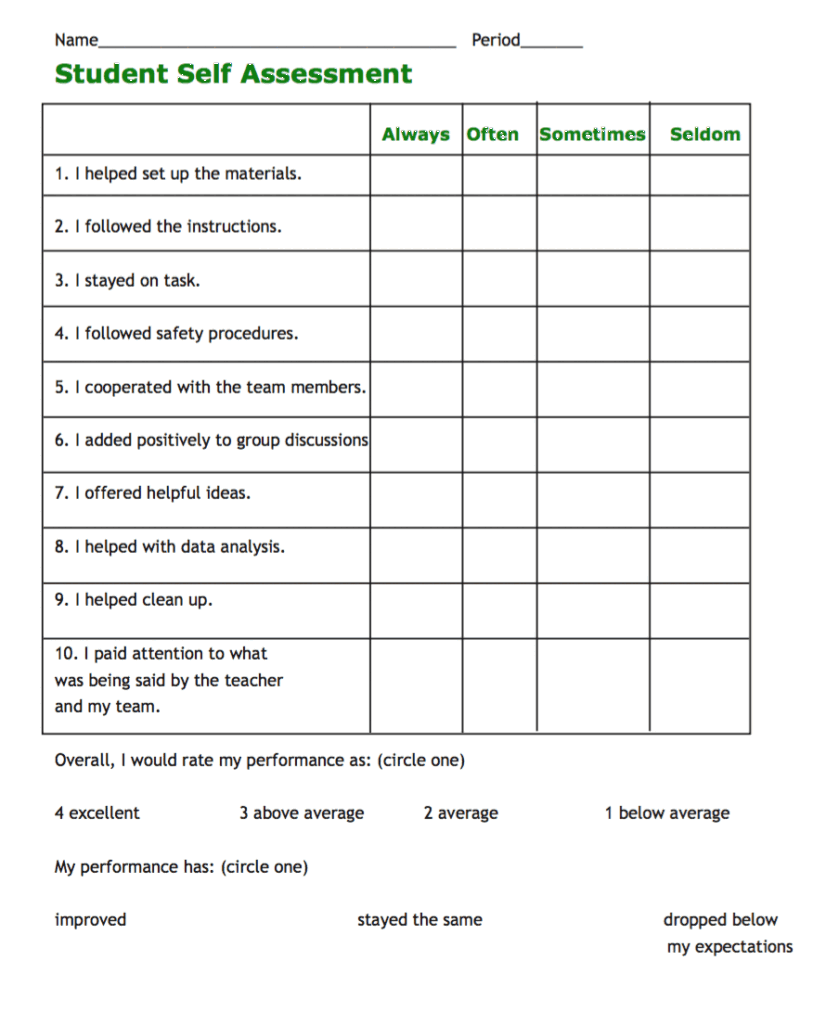
Student Self Assessments
Developed by Janet Baker and Valerie Ayala
Student self assessments can be particularly useful in providing
feedback about group work. It is difficult for teachers to observe all aspects of teamwork. The self assessment can serve as a powerful reminder to the student that cooperative skills are an important aspect of learning. The following sample assessment can be used with many of the group activities in this unit.
~{}~
Objectives [] Assessment [] Resources
Guides for each Chapter: 1 – 2 – 3 – 4 – 5 – 6 – 7 – 8
Guides for Each Chapter
Before You Start
- At least a day or two before you begin Losing Biodiversity, distribute copies of the two assessment tasks on the previous pages and ask your students to answer the questions. Explain that they will not be graded on these. The purpose is for them to show you what they already know so that you can plan the course accordingly.
- Invite students to bring in news clippings about the diversity of life on our planet, endangered species, and other related topics. Put these on a bulletin board, or in a clipping file, organized by topic. Relate the articles to class discussions, and make them available for students to use when they are selecting a topic for the final essay
Guide for Chapter 1:
Seeking Biodiversity
- Most urban youth have little experience with environmental studies. The intent of this chapter is to give them a taste of the amazing and enjoyable work of the ecologist, and to sharpen their awareness of the changes occurring in their communities.
- For openers, facilitate a class brainstorm of the changes to the local environment students have seen in the last few years. Ask them, “In what ways do these changes make the environment better or worse for people? In what ways do the changes benefit or harm other species that inhabit the area?
- Show students the Losing Biodiversity Student Guide, and define “biodiversity” as the total of all life forms on Earth, including the different varieties as well as all the habitats that support them. Explain that biodiversity refers to the number of different kinds of organisms, as well as the variety of natural environments. Point out that humans have evolved as part of Earth’s living systems, so people and their cultures are also an important part of Earth’s biodiversity.
- Give students about 10 minutes to read the first three pages. Draw their attention to this graph, and ask for a volunteer to identify the approximate time of the first great extinction (440 million years ago) and the approximate % of species lost (50%). Have another volunteer identify the extinction that removed 80% of ocean species (240 million years ago).
- Point out that this graph is based on the number of fossil ocean species identified in sedimentary rocks. What might we infer happened to land species?
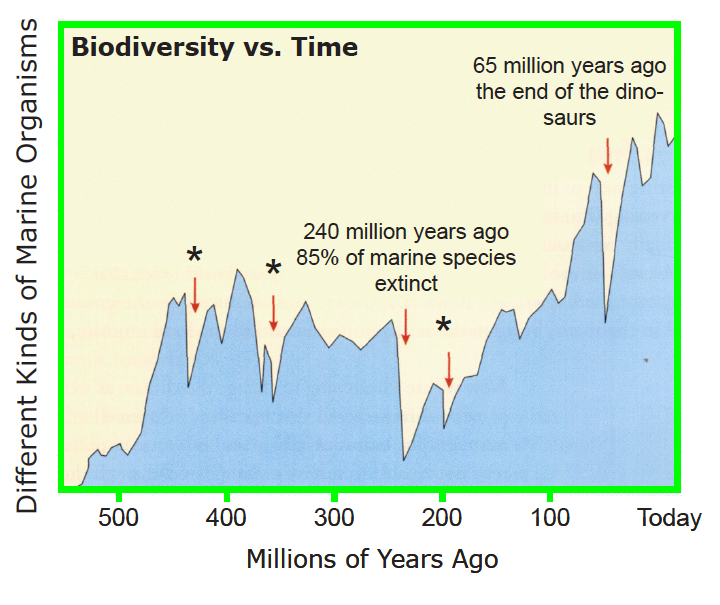
- Direct students to examine the graph of Human Colonization and Associated Species Loss at the end of section II. In which region was the percent of species lost the smallest? (Africa) Invite their ideas to explain this graph. (One possible explanation is that humans and large animals co-evolved in Africa, so that species were better adapted to survive human hunting.
- Ask students why they think the large species tended to be more susceptible to extinction (lower reproductive rate, including longer time to maturation, more limited habitat, more visible and slower, to name a few).
- Invite volunteers to comment on why they think people are concerned about the loss of biodiversity
~{}~

TG-LB1-1. Investigation:
Biodiversity Assessment
Modified from an activity developed by Deborah Crough of Saddleback High School, California and Deborah Bennett of Hamilton County High School, Florida
You may choose to have students conduct this project: A) as a group within your daily class periods, studying a site on or adjacent to school; or B) as team projects conducted mostly outside of class and at sites selected by the teams. Option A is preferable if your students have no field experience and have limited access to appropriate study sites.
Materials
Materials for the class:
- string or flagging for marking boundaries
- chart paper or overhead transparency
- several dissecting microscopes
- field guides of flora and fauna
- several meter sticks
- digital camera
Materials for each team:
- clip board
- Site Inventory Cover Sheets
- 20-30, 3’ x 5’ index cards
- magnifier
- several zipper lock plastic bags
Advance Preparation
- Choose a site close to the school so that the class may easily visit the area. An abandoned weedy area may well contain more species of plants and animals than the tended landscaping.
- If there is a park close to school, contact the park superintendent to determine if your efforts may be combined with an existing park initiative. Park staff may be able to provide assistance with identifying various species.
- If the area is larger than an acre, mark and number study plots ahead of time. If your boundary markers are inconspicuous, there will be less chance that vandals will disrupt the site. Ten square meters is a good working space for a team of students
- If you plan to have several classes contribute to the study, mark additional plots, so that the areas aren’t trampled by repeated observations.
- Gather the materials and duplicate copies of the Site Inventory Cover Sheets for each team
Introducing the Activity
- Announce that students will conduct field research in the manner of restoration biologists. The goal of the class effort is to produce “Habitat Action Plans” that can be used to increase the biodiversity of the area.
- Define the project period (we recommend one to two weeks), and explain access to equipment, (school microscopes, field guides, camera).
- Give students time to read the Biodiversity Assessment assignment, then review the project. Stress the importance of accurate recording on the cards and Site Inventory Cover Sheet.
- Explain that they need to note every different kind of living organism they find whether they can identify it or not. The purpose of this activity is to tally the number of species, not to identify them at this point.
- If time remains, visit the site. Point out the importance of leaving the area just as they found it. Warn students of poisonous plants, and clarify your expectations of their behavior while outdoors. As homework, they should form teams of 3-4 and bring materials such as note cards and plastic bags from home.
In the Field
- When you get to the site, keep the class together for a few minutes and discuss the issue of human impact and major characteristics of the area.
- Before the teams go to their various plots, remind them to draw a map of the site.
- Students tend to be more interested in big furry mammals rather than crawly insects. Circulate among the teams and encourage close observation to detect the small insects and plants living on or in the soil. Emphasize the need to use all of their senses when gathering data. Suggest that they close their eyes to hear different sounds. Remind students to keep an eye out for indirect evidence such as tracks and scats to locate and identify animals.
Back in the Classroom
- Give teams time to organize their findings and write a “Baseline Summary.”
- Teams will vary in the number of species they observe and record. Invite them to suggest strategies for combining their results to make a more accurate whole-class inventory.
- Lead students in a brainstorm of ways to improve the sites for native species.
- Provide time for the teams to discuss their ideas for their “Habitat Action Plan.” Ask them to prepare written recommendations for the future of the area as a whole.
Extensions
- Revisit the site to observe seasonal changes.
- Have students develop a species library of drawings, photos, scientific articles, and other information for each organism observed.
1-IV. Why Conserve Biodiversity?
- Begin the next class session with the question: Why Conserve Biodiversity? Record their responses on chart paper that can be saved.
- Point out that rain forests and the ocean depths are obvious frontiers for finding unknown species, but even in North America there are many habitats that need more study. Curiosity and delight in finding new things have always driven humans to explore, yet in every area of the world, people are greatly changing natural environments without first knowing what lives there.
- You may want to show students the June 20, 1994 Issue of Time, in which Eugene Linden describes the 1992 expedition of Vietnamese biologists who explored the isolated mountains along the border of Vietnam and Laos. Describe how the research team discovered several new genera of large mammals related to cattle. Add the article to the class clipping collection for students to borrow.
- Tell students that as they progress through the unit you expect them to gather scientific and societal evidence from various sources to support the arguements for conserving biodiversity.
~{}~
Objectives [] Assessment [] Resources
Guides for each Chapter: 1 – 2 – 3 – 4 – 5 – 6 – 7 – 8
Guide for Chapter 2
The Trail Back from Near Extinction
The drama that unfolded on the vast grasslands of North America will be the example for understanding the world-wide problem of extinction. The story of the near-extinction of the buffalo and the Indian nations provides the following lessons about biodiversity.
- Unregulated competition for resources can lead to species extinction (Brown et al. 1994, Dunlap 1988, Hornaday 1913, National Research Council 1994, Rorbacher 1970, Youth 1994).
- Declining populations of some species can cause a chain reaction of negative effects on people, other species, and environments (Sunquist 1988, Wilson 1988).
- Wars can have large negative impacts on species and environments, as well as on indigenous cultures (Parfit 1989, Nabokov 1978, Shaller 1995, Waldman 1985).
- With wise management, endangered resources like bison can be renewed and sustained (Ausuble 1996, Hodgson 1994).
- There is a need to improve the ways people interact with each other and the environment that sustains all communities and nations. (Convention on Biodiversity 1994, Harrison 1993, Sale 1990).
- If possible, show students segments from the movie Dances with Wolves, to provide a powerful visual recreation of the prairie ecosystem and Native American way of life in the 1800’s.
- Assign students to read section 2-II. What Happened To the Buffalo?, and encourage them to share their reactions. Ask them to help you list some modern day examples of species near the brink of extinction (California condor, manatee, right whale, whooping crane, black footed ferret, to name a few).
- You may want to use the wolf as an example of a species that once had a distribution even greater than the bison. Wolf populations have been reduced to fewer than 1000 animals in the lower 48 States.
2-I. Bison–A Keystone Species
- Provide some further examples of keystone species by describing the northern tundra ecosystem which supports vast herds of caribou feeding on lichens, dwarf trees, and shrubs. The Masai Mara plains and Serengeti plains of East Africa, are additional examples in which the wildebeest are a keystone species, shaping the land and vegetation, while supporting a diversity of predators and scavengers.
~{}~
TG-LB2-1. Investigation:
Estimate the Number of Bison Killed
Direct students to work in pairs on this math investigation. Give them about 5 minutes to make their calculations and discuss their inferences. Circulate among students lending assistance where needed.
Invite a volunteer to demonstrate the calculations on the board.
- How many bison were killed over the 13-year period?
($3,000,000 paid, divided by $8/ton of bones = 375,000 tons of bones shipped. 375,000 tons of bones x 100 bison/ton of bones = 37,500,000 bison killed in 13 years) - What was the average number of bison killed per year? (Round your answer to the nearest hundred thousand.)
(37,500,000 dead bison divided by 13 years = 2,884,615 bison killed/year, rounded to 2,900,000)
Encourage students to share their inferences about the information from the sale of the skulls, and to suggest reasons why the estimated number killed/year might be less than the actual harvest.
(Skulls vary in weight so there could be quite a difference between the number of skulls estimated depending on the proportion of young animals in the population; some skulls may have been lost or broken; the babies of mothers killed may have eventually died.)
- Kansas City was the major center for railroad shipments East, but there were other smaller trade routes to the north and along the rivers. What does this tell you about how the number of bison estimated above relates to the total number that were actually killed?
(The average annual harvest of bison was probably higher than 3 million animals per year, because bison bones were also sent east along more northerly routes from Canada, and southern routes from Texas. In addition, bison were hunted by Native Americans and died of natural mortality factors such as predation by wolves.)
Draw to their attention that people were not counting and monitoring the bison populations in the 1800’s (Shaw 1995), so the bone trade records are one of the few sources of information.
2-II. What Happened To the Buffalo?
This section describes the sociological forces impacting the bison, including the California Gold Rush in 1848, the Civil War, the Homestead Act in 1862, the trans-continental railroad, and the on-going military campaign against Native Americans.
- Describe the 1800’s as a period of tumultuous transformation of North America, from vast forests and grasslands supporting cultures of Native Americans, to farmlands and cities populated by people from Europe, Africa, and Asia (Hornaday 1913, Nabokov 1978).
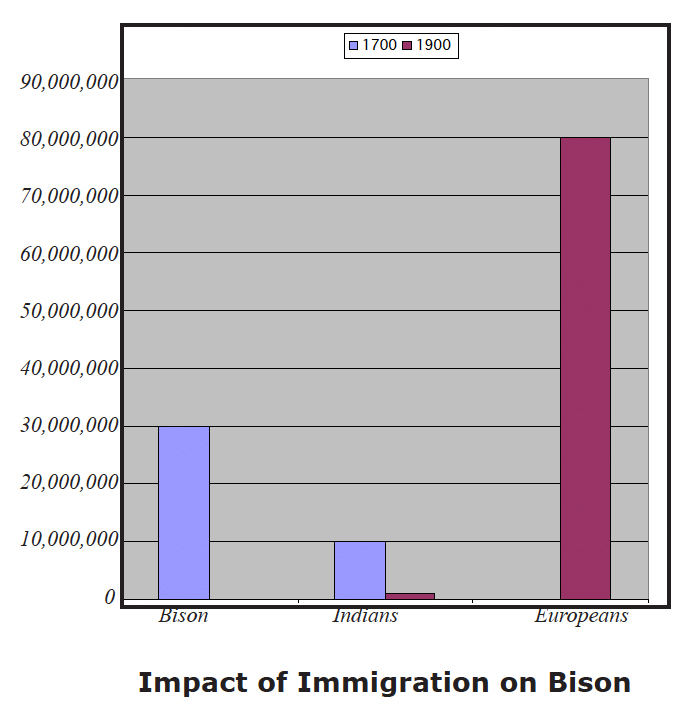
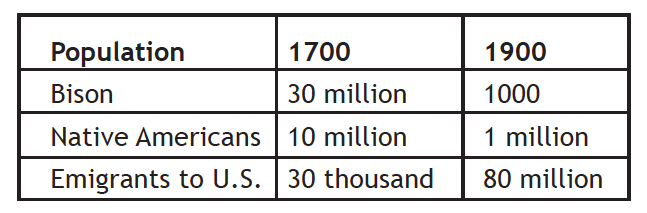
- Sketch a bar graph on the board to illustrate the dramatic changes in the population of Native Americans, bison, and emigrants to the United States:
- Provide time for a discussion of the military campaign against the Indians. Genocide continues today in various parts of the world. We suggest you craft the session so that students examine the global picture of genocide and the loss of human and biological potential that accompanies such destructive efforts.
- Encourage students to also suggest losses to human society that result from the loss of individual cultures (knowledge about the land and medicines, ideas for solving human problems, human biological diversity, art, and technology, to name a few).
- Use the following video documentaries to provide insights into the demise of Native American cultures:
Ishi, Last of the Yahi, The American Experience Series of WBGH Boston, 1994 Shanachie Entertainment Corp.
Attack on Culture, 500 Nations productions, a Jack Leustig Film, 1994, TIG Productions.
2-III. Renewable Resources
- Point out that during the same period of 1700- 1900, the vast hardwood and conifer forests east of the Mississippi were clearcut and converted to farmland. Another example of overharvest, is the case of the commercial feather trade for women’s hats, which caused the extinction of some species and dramatically reduced the populations of many other bird species (Dunlap 1988, Hornaday 1913).
- Explain that during those times of unregulated consumption of the nation’s natural resources, what seemed to many to be unlimited supplies of wildlife, timber, and land, were depleted and often wasted.
- Ask students if they can think of some modern day examples of rapid consumption of what appear to be vast natural resources (Amazon forests, ocean fisheries).
2-IV. Who Helped Save the Buffalo?
This section describes the grass roots and legal efforts, from the 1860’s through the early 1900’s, to save the bison. It serves as a powerful case study for the sustained efforts of people from diverse backgrounds.
TG-LB2-2. Investigation: Graph the Population of the Buffalo
Explain to students that the dates shown in the chart are not when the researchers lived, but rather the time period for which they made the estimates. Furthermore, the population numbers were not based on actual counts of animals.
The estimates are based on quite a variety of methods, including the accounts of pioneers traveling west who estimated the size of various herds, and estimates based on the assumed carrying capacity of the land (Shaw, 1994).
Published estimates of pre-1500’s bison numbers range as high as 100 million, but in recent years biologists, like T. McHugh (1994), have revised the estimates downward.
The bibliography at the end of this teacher’s guide includes the references for bison population estimates.
~{}~
TG-LB2-3. Investigation:
Biodiversity Issues
Encourage students to help you list additional examples of the impact of technology on biodiversity, both positive and negative. For example, modern highways and aqueducts can pose insurmountable barriers along the traditional migratory routes of species such as deer and newts (a kind of salamander). On the other hand, new biological techniques have been very useful in breeding endangered species and in assisting in efforts to identify and prosecute poachers.
Describe how successful solutions for maintaining the integrity of natural systems must also address the needs of local people and should include those local communities in the planning and implementation. Biodiversity Issues may be assigned as an individual project, a final essay, or structured in the form of a town hall meeting in which students play the roles of the various interest groups.
Call on volunteers to describe examples of the different viewpoints local people may have about land use issues. Stress that the intent is not to be judgemental, but rather to recognize that there are usually several different perspectives for every issue.
Encourage students to examine the pros and cons of the proposals from the different perspectives. Point out that it is important for people to work together to find long term solutions to complex resource conflicts. Invite students to suggest strategies they would use to help get different interest groups together to “buy in” or support a joint planning process.
Extensions
Point out the path of the Buffalo Trace on a large road map of the East Central States of Virginia, Kentucky, Indiana, and Illinois. You can find it on today’s maps as U.S. Route 50, which travels across Illinois. In Kentucky, the Buffalo Trace and the Wilderness Road are followed almost exactly in many places by Routes U.S. 150 from Louisville to Mount Vernon, and route 25E over the Cumberland Gap. In Indiana the route is less well defined, and is lost in many places. However, the ancient bison crossing on the Wabash, now in the city of Vincennes, is marked by a big bridge and the Clark Memorial.
Describe for students how bison traveled through the hardwood forests of the East along well-used ancestral routes. One long bison path cut westward across Virginia, Kentucky, Indiana, and Illinois. This wide compacted trail, or “trace” as it was called by the early settlers, was heavily traveled, both by animals, Native Americans and settlers. In many places it was wide enough for the early wagons. Daniel Boone and Ben Logan used much of the trace when establishing the “Wilderness Trail” leading into Kentucky. Abraham Lincoln’s father, took the family from Kentucky along the Buffalo Trace into Indiana, near Vincennes. Eventually a log road was laid on the muddy Buffalo Trace, and much later it became a paved highway that went through Lawrenceville due west to East St. Louis on the old route of the bison (Eifert 1955).
Arrange several blocks of time during lunch time to show Never Cry Wolf, a full-length motion picture by Disney. It is a true story about a Canadian scientist (Farley Mowat) who is assigned by the government to find out what is decimating the Arctic caribou herds. The wolf is the suspected culprit. Mowat discovers, through studying a family of wolves, that the wolves have been feeding almost exclusively on mice. Thinking that no official would believe his observations, he decides to carry out his own experiment. By eating only mice himself, he demonstrates that wolves can survive on a diet of small animals. This is an outrageously funny, beautiful and intriguing story. Native Eskimo cultures, hunting and predator-prey relationships are clearly shown. Most students have not seen this movie, which makes it extra special. Warning—a little nudity involved (but tastefully done). Based on the book Never Cry Wolf by Farley Mowat (Penguin Books).
Suggest that students read and review a book that provides insights into cultures and/or scientific studies of organisms and their environment.
For example:
- Dogsong. Gary Paulson
- Ishi in Two Worlds. Theodora Krober
- Julie of the Wolves. Jean C. George, Harper Collins Publishers, New York, 1972.
- Never Cry Wolf. Farley Mowat, Bantam Books, New York, 1984. On the Frontier with Mr. Audubon. Barbara Brenner Coward, McCann & Geoghegan, New York, 1977.
- The Talking Earth. Jean C. George, Harper and Row, New York, 1993.
~{}~
Objectives [] Assessment [] Resources
Guides for each Chapter: 1 – 2 – 3 – 4 – 5 – 6 – 7 – 8
Guide for Chapter 3:
The Origin of Species
This chapter adopts an historical approach to show how Darwin and Wallace synthesized their ideas from the results of extensive scientific observations and the ideas of other theorists like Charles Lyell and Thomas Malthus. In the last two decades, there have been more than 100 scientific studies that directly demonstrate that natural selection occurs in populations of plants and animals. New species of fruit flies, bacteria, yeast, and viruses have evolved in the laboratory, and DDTresistant varieties of insects have arisen in the wild. Darwin’s and Wallace’s work stimulated a flurry of scientific research and debate that is still going strong today.
The Theory of Evolution draws on physical evidence from many fields of biology, earth science, and chemistry. To make this abstract theory tangible, teachers should give students a variety of experiences that include observations and comparisons of fossils and living organisms, simulations of complex processes, and opportunities to discuss explanations for observed phenomena.
The National Science Education Standards (1995) identify biological evolution as a content area to be learned by all students grades 9-12. The content examples listed include: “Natural selection and its evolutionary consequences provide a scientific explanation for the fossil record of ancient life forms, as well as for the striking molecular similarities observed among the diverse species of living organisms…The millions of different species of plants, animals, and microorganisms that live on Earth today are related by descent from common ancestors.”
This topic remains controversial, especially with respect to religious beliefs, therefore, it is important to present the theory in the context of the nature of scientific inquiry.
The Benchmarks for Scientific Literacy provide the following national guidelines: “Controversy is an important aspect of the scientific process. Students should realize that although virtually all scientists accept the general concept of evolution of species, scientists do have different opinions on how far and by what mechanisms evolution proceeds.” (page 122) “In the short run, new ideas that do not mesh well with mainstream ideas in science often encounter vigorous criticism. In the long run, theories are judged by how they fit with other theories, the range of observations they explain, how well they explain observations, and how effective they are in predicting new findings.” (page 13)
The National Center for Science Education has a number of excellent pamphlets, newsletters, books, and videos that are designed for high school teachers and students. The organization also provides assistance and information for teachers who are under pressure not to teach the science behind the Theory of Evolution. (See the Resources section at the end of this book.)
3-I to 3-IV
- Have students read these sections, during which they are introduced to the following concepts: variation of traits within a population, competition for scarce resources, and natural selection of favorable traits.
- Invite students to comment on Darwin’s trip and what it might have been like to work as a naturalist for five years aboard a ship.
- Point out that many scientists encouraged Darwin and Wallace to make public their ideas in the joint paper, “On the tendency of Species to form Varieties and on the Perpetuation of Varieties and Species by Natural Means of Selection”, presented to the Linnean Society in 1858. The paper stimulated great scientific dialogue, much of it in support of the new ideas. Partly because of the abstract nature of the theory, it has continued to be misinterpreted and misrepresented by many who are unfamiliar with the extensive research revealing the process of evolution.
- Ask volunteers to explain how the populations of finches and pepper moths changed over time.
3-III. The Theory of Natural Selection
- Every population includes individuals with a variety of physical and behavioral characteristics, or “traits” that are inherited.
- Every population produces more offspring than can survive.
- Competition for scarce resources and the natural hardships of living favor the survival of individuals whose traits make them well-adapted to their environment.
- The better-adapted offspring survive in greater numbers to pass on their characteristics. Over many generations, the population is dominated by individuals that have inherited the most favorable traits for that environment.
- Organisms less suited to the environment have a greater risk of dying young from predation, starvation, and other mortality factors or of failing to produce offspring.
Your students might enjoy hearing you read a passage from letter written during, the voyage of the Beagle. The following excerpt is from The Autobiography of Charles Darwin and Selected Letters, edited by his son Francis Darwin (1892, 1958).
May 18, 1832, to J. S. Henslow (Cambridge professor and friend):
“Here [Rio], I first saw a tropical forest in all its sublime grandeur— nothing but the reality can give any idea how wonderful, how magnificent the scene is. If I was to specify any one thing I should give the preeminence to the host of parasitical plants….I am now collecting freshwater and land animals; if what was told me in London is true, viz., that there are no small insects in the collections from the Tropics, I tell Entomologists to look out and have their pens ready for describing.” page 141.
~{}~
TG-LB3-1. Investigation: Simulate Natural Selection with “Beetles”
Inspired by Simulating Evolution by Robert Stebbins and Alan Brockenbough 1975.
The following activity is just one of many ways to simulate natural selection. We featured this version in the student guide because it is a simple and fun way to give students a feel for how natural selection occurs in the world around them. The activity can be done by one student as homework, or may be re-structured for a group project in the classroom.
Materials
For each team of 3 or 5 students
- a large piece of colorful patterned wrapping paper (at least 4 feet x 2 feet) 30 each of 5-6 colors of candy or paper dots
- (There are several kinds of candy that are packaged in a variety of colors. Although students enjoy this edible activity, you may easily substitute colored paper dots, toothpicks, or colored pasta for the candy.)
- 3 or 5 cups for containing the captured prey
- graph paper
- pencil
Introduce the Activity
- Introduce the activity by telling students that scientists often experiment with simulations as part of studying natural phenomenon that are difficult to observe directly. Point out that the process of natural selection occurs over generations, making it difficult to observe all of the on-going changes.
- Have students read Investigation 3-I and discuss the parts of the simulation.
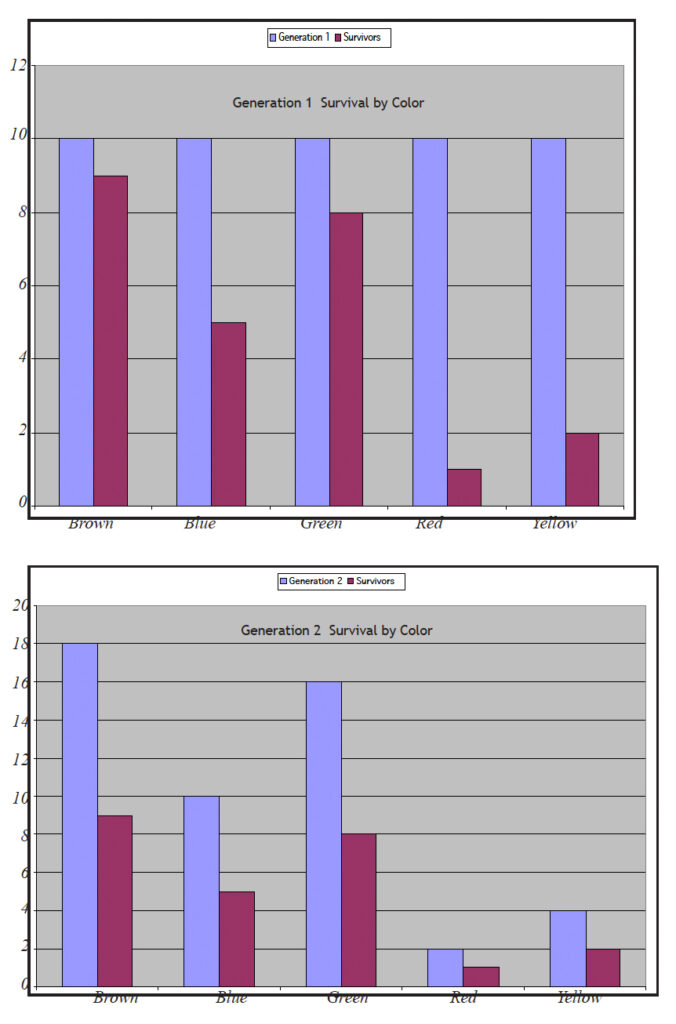
- Explain that a population of “beetles” is represented by different colors of candy, paper dots, or pasta. For example, there are six colors of “m & ms”: red, orange, yellow, green, blue, and brown. Teams of students will distribute ten of each color randomly across a patterned paper that represents the environment.
- Point out that the activity is structured in the form of an experiment to discover which color is best camouflaged on the paper background. For this reason, an equal number of each color of “beetle” is spread across the environment, and subjected to the same conditions of predation.
- Tell students they will role play birds catching beetles, then make a bar graph comparing the original numbers of each color of “beetle” (10) to the number of survivors.
Outline the Procedure
- Organize students in teams of 3 or 5, and have students tape the piece of paper on the top of a table.
- Invite them to predict which color(s) will be best camouflaged on the simulated environment.
- Team members will count out 10 of each color of 60 “beetles” and scatter them across the paper.
- Pretending to be bird predators, each student will collect “beetles” by picking them up one at a time and putting them aside in a cup that represents their stomach.
- The total number of “beetles” collected by a group of students should be half of the total population. For example, if the population is 60,gm together the team will capture a total of 30. If there are 5 students in the team, each student will collect 6 beetles. Using a predation quota like this is necessary to inhibit students from scrambling to collect the most “beetles”.
- Outline rules for the “bird predators”: – Team members walk in a circle around the table—keep moving.
- Pick up “beetles” one at a time (don’t scoop them) and put them in a cup.
- Turn your eyes away each time you capture a “beetle”.
- Don’t search for one favored color, but rather pick up the color that first catches your eye.
- Only capture your allotted number of “beetles”.
- Don’t eat the candy beetles until given the OK by the teacher. (The “beetles” will be needed again if students simulate additional generations.)
- Have students make a bar graph comparing the original numbers of each color of “beetle” to the number of survivors. Invite them to predict what will happen to the proportion of the different colors in the population if each survivor reproduces one offspring and the “hungry birds” return for another feeding.
- Ask students to describe how this simulation is simplified from natural selection in the wild.
~{}~
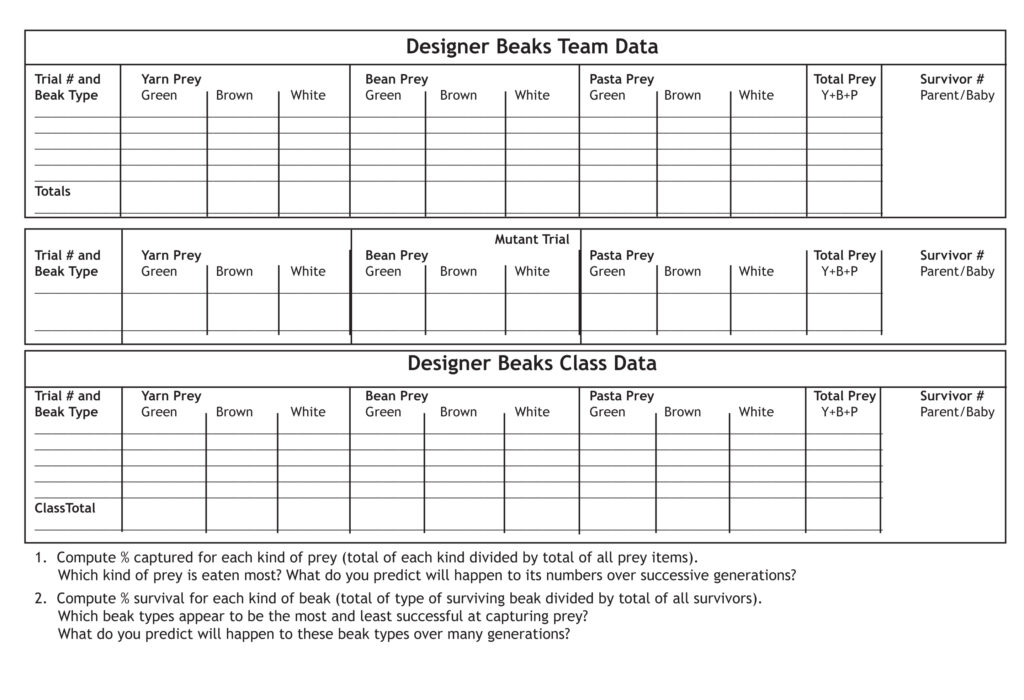
TG-LB3-2. Investigation: Designer Beaks
by Janet Baker, Catalina H. S., CA., Valerie Ayala, Valley H. S., CA
Overview
This adaptation of the popular Bird Beaks activity simulates natural selection in both predator and prey populations. Students use a variety of utensil “beaks” to represent the feeding adaptations of different kinds of finches. Foraging on a lawn environment, students search for different kinds of food (yarn, beans and pasta) each having three color variants.
Working in groups of three, (one as recorder and two as “finches”) students have just 60 seconds to collect at least one food item apiece for four finch nestlings and two parents, all of which are represented by a circle of cups at the edge of the feeding area. Students must keep one hand behind their backs as they mimic finch feeding behavior, returning to the nest of cups with each captured prey.
Over the course of 3 trials, every student has a chance to forage and record data. In the last trial, some students can be given “mutations” which limit or enhance their feeding behavior (use left hand, walk backwards, or use both hands, carry pouch, etc.) The data from the trials is combined and displayed in bar graphs that show survival by beak type in the finches and by color in the prey. Students can also determine the easiest food for each species of finch to capture.
Materials
For the class:
- 100 pieces each of green, off white, and brown yarn cut in 5-cm lengths
- 100 pieces each of green, off white, and brown rainbow rotini pasta
- 100 each of green, off white, and brown dried beans
- 3 large plastic bags for holding the foods
- 3 data charts or overhead transparencies
For each team of 3 students:
- 6 small cups
- 2 sets of the same kind of simulated “beak” (chop sticks, crucible tongs, spoons, pliers, toothpicks, and other kitchen or lab utensils)
- pencil and data sheet
Designer Beaks
Darwin studied birds in the Galapagos Islands off the coast of South America. He found 13 species of finches that were similar, but their bills were specialized for different kinds of food. The purpose of this activity is to simulate the process of natural selection that resulted in the evolution of finch species with very different types of beaks.
You will represent parent finches gathering food for your nestlings and yourself. Your nest will have 6 cups that represent 4 babies with two parents. To survive, each nestling must be fed one piece of food and the foraging parents must also get one piece of food during each of three trials.
Getting Ready
- Form a group of three. In each of three trials you will rotate tasks: Data Keeper, Forager 1, Forager 2.
- Get 6 cups and label them: Forager 1, Forager 2, and Nestling 1, 2, 3, and 4.
- Get two utensils of the same kind to simulate your beaks, and record “Beak Type” on your data sheet.
- Assign tasks to your team, then establish a nest site at the edge of the foraging area.
Rules
- When your teacher says “forage” two team members will gather food for 60 seconds. If any cup is empty at the end of a trial that bird is dead. (Don’t forget to feed yourself!)
- Each forager may collect only one piece of food at a time, and must return it to a cup before getting another piece.
- Your utensil “beak” must be held in one hand with the other hand behind your back. DON’T LET YOUR FINGERS OR HAND TOUCH THE FOOD, or you’re dead for that trial.
Procedure
- There will be three 60-second trials. At the end of each trial, record the number of each kind and color of food in the cups, and the number of birds that survived, then rotate tasks.
- If there is time, in a 4th trial, one Forager will simulate a harmful or helpful mutation during the foraging. Agree upon one mutation, (such as walking backwards, or using one finger from the left hand to assist) and describe the mutation on the data sheet.
- When all the trials have been run, return to the classroom and record your results on the class data charts.
- Using the combined class data, make bar graphs showing the percent survival by beak type, kind of food, and color of food.
Questions
- How did predation change the prey population?
- How did beak type relate to choice of prey?
- Do you think that one kind of worm or one kind of beak will be eliminated after many years of bird predation? Use the data from this experiment to support your prediction.
- Describe the results of your mutation experiment.
- Explain your interpretation of “survival of the fittest”. Use examples from this experiment to support your explanation.
- Assign students to read the remainder of the chapter.
- Scientist E.O. Wilson (1975) was one of the first to theorize and demonstrate with mathematical models how the social behavior of giving up one’s life defending one’s relatives can provide a survival advantage to the genes of the altruist. Important genetic traits common to both the altruist and the surviving relatives can thereby be passed on to the next generation.
- Have students work in small groups to list examples of social behaviors that have improved survival of our species.
- Rotate among the groups, calling on volunteers to share examples.
- Assign question 4.1, “Looking for Human Variation” as homework, to encourage students to look for examples of genetic variation. Direct students to choose a characteristic that can be inherited such as face, nose, or ear shape, and make a tally of all the different examples they can identify during a TV broadcast.
Chapter Extensions
by Janet Baker and Valerie Ayala
Assign students library research on niche invasion by introduced species such as starlings, English sparrows, Africanized bees in the United States, and rabbits and foxes in Australia.
Work with the social studies teacher to promote student research on the Scopes trial and current efforts to inhibit teaching of evolution in states such as Tennessee and Kansas.
Have students write and illustrate a poem or a haiku about natural selection, adaptations, predator prey relationships, or extinction.
Request that students write a review of a book written by a scientist who is describing his or her work, such as:
- The Voyage of the Beagle. Charles Darwin
- Hen’s Teeth and Horse’s Toes. Stephen J. Gould
- King Solomon’s Ring, Konrad Lorenz
~{}~
TG-LB3-3. Investigation:
Ideas for Research Projects
Loss of Biodiversity due to Non-native Species
Direct students to read the activity, then invite them to help you list additional examples of introduced species.
Facilitate a discussion about the issue of non-native species. We certainly consider crops, pasture grasses, and organisms like the honeybee highly beneficial to people. Some non-native species have become so commonplace that it would be impossible to eradicate them.
The tiny zebra snail, which has invaded the Great Lakes and is rapidly spreading through the rivers and lakes of the East, is an example of an accidental introduction that will probably cause the extinction of many North American species of aquatic snails. The native species cannot compete with this hardy invader that is without its natural predators and diseases.
Explain that the U.S. Fish and Wildlife Service is responsible for conducting inspections of people and materials entering the country to prevent species from other areas of the world from invading North American ecosystems and agriculture. Control and management of introduced pests and non-native species is a major sector of wildlife research.
Tell students they may choose the topic of non-native species for their final essay. Refer them to 8-Final Essay for the essay guidelines.
~{}~
TG-LB3-4. Investigation:
Evolution of Symbiotic Relationships
by Susan Green Miami Beach Senior High School, Florida
Discuss with students some of the incredible symbiotic relationships that exist between certain species, and the possible ways in which the organisms could have evolved such a co-dependence. Provide examples such as the girdler beetle and mimosa tree, clown fish and sea anemones, and cecropia tree with its Azteca ants.
Have students work in pairs to develop and draw two species and their symbiotic relationship. These relationships can be drawn from nature or be fictitious, but the imaginary creations must have logical ways of surviving. Pairs of students should then discuss their pictures with each other, describing the implications of habitat loss, over harvesting, and pollution for survival of their species.
Resources
Cambridge Encyclopedia of Human Evolution, Cambridge University Press, 1992, ISBN 0-521-323703. This is an excellent resource for brushing up on the human evolutionary perspective. A range of subjects are included: genetics, primatology, fossil origins, human biology and ecology, demography, and disease. Special emphasis is placed throughout on the biological diversity of modern people and the increasing evidence
Darwin’s Revolution, Program 8 of the series, The Day the Universe Changed.
~{}~
Objectives [] Assessment [] Resources
Guides for each Chapter: 1 – 2 – 3 – 4 – 5 – 6 – 7 – 8
Guide for Chapter 4
The Puzzle of Inheritance
This chapter provides a very brief sketch of the complex field of genetics and DNA science. The purpose is to provide students with a sense of how this field continues to emerge, revealing the natural processes that enable the continuity of life and the evolution of new species.
The following topics are introduced: Mendel’s mathematical model Cell division—mitosis Formation of sex cells—meiosis Mutations— crossing over, jumping genes, polyploidy, radiation damage DNA structure Molecular evidence for evolution Natural Selection for Sickle-Cell
Inform students that they will just scratch the surface of this amazing area of research. Invite them to dive more deeply into the fascinating subject by visiting some of the engaging web sites referenced at the bottom of this page.
The following topics are not addressed in this unit: incomplete dominance, gene linkage, sex chromosomes, sex linkage, polygenic inheritance, genes with multiple alleles, and DNA replication.
Have students read the introduction. Direct their attention to the diagram of Five Kingdoms of Life Forms. Point out that the ovals depict only a minute sample of organisms, showing the broad relationships between the major groups of life and implying a common ancestor for plants, fungi, animals and protists.
Tell students that by the end of the chapter, they should be able to answer the following questions:
- How do organisms pass on their traits to their offspring?
- Why do certain traits, such as blue eyes or straight hair, seem to be absent in offspring, but then show up several generations later.
- Why do offspring have only some of the traits of their parents but not others?
- What causes mutations?
- How is understanding genetics important to the problem of losing biodiversity
Introduce Father Gregor Mendel as the first person to publish a scientific investigation of inherited traits. He was a contemporary of Darwin, but neither scientist was aware of the other’s work. Mendel’s studies did not catch the attention of scientists until after his death in 1900.
Mendel was lucky in his choice of the pea plant, which shows several very visible traits that can be inherited independently. Mendel was able to develop a mathematical model to predict the frequency that “masked” traits would show up in successive generations. His model is still useful for understanding some basic genetic relationships, although today we know that inheritance of traits can be affected by many additional factors (location on the chromosome, sex of the offspring, multiple genes contributing to the trait, and tendency for the chromosomes to exchange segments).
~{}~
TG-LB4-1. Investigation:
Hybrid Cross Coin Toss
The purpose of this activity is simulate a hybrid cross and give students experience using a Punnett Square to: predict the probability of combinations of two independent characteristics, observe and record the actual results, and calculate the ratios and percents of the theoretical and actual outcomes.
Materials for each pair of students
– Student Guide version of activity
– 2 pennies
– 1 shoe box to provide boundaries for the tossed coins
– paper and pencil
– optional extension, 2 additional pennies marked with tape or dots to distinguish heads and tails.
Procedure
- Tell students they will use a simple yet elegant visual system, the Punnett Square, named for the man who promoted it as a mathematical aid.
- Have them read the activity, then organize pairs of students to conduct the Hybrid Cross Coin Toss.
- Ask students to copy the blank punnet square at the bottom of the page onto a blank piece of paper. Tell them to designate heads as the dominant “gene” and tails as the “recessive” gene.
- Distribute two pennies to each pair of students and give about 5 minutes to conduct trials, make calculations, and compare results to the theoretical results shown.
- While students are working, sketch a large Punnett Square on the chalkboard.
- Invite some volunteers to share their results. Ask how they think their results might change if they tossed the coins for additional trials.
- If students don’t suggest it, point out that the class can combine the tallies from the student pairs and compare those results to the theoretical probabilities. Assign two volunteers to tally the tosses of the pairs and record the results on the large Punnett Square. Encourage students to comment on the results.
- Draw comparisons between the coin tosses and the hybrid crosses conducted by Mendel.
- Have students read 4-III, 4-IV, and 4-V, and invite some volunteers to describe in their own words why some traits can remain hidden for several generations.
Extensions
- Show students how to modify the Punnett Square to simulate a hybrid cross with two sets of traits, for example flower color (R-red and w-white) and surface of the seed (C-crinkled and s-smooth). Distribute additional pennies marked with tape to indicate C-heads and s-tails. Point out that these marked pennies represent the second set of traits, such as smooth seed and crinkled seed. Each side of the Punnett Square would display the following combinations of the two sets of traits: RC, Rs, wC, ws. The theoretical probabilities would be RRCC 1/16; RRCs 2/16; RwCC 2/16; RRss 1/16; RwCs 4/16; Rwss 2/16; wwCC 1/16; wwCs 2/16; wwss 1/16. Show students how to arrive at the total for each observable combination: Red Crinkled = 9/16, Red smooth = 3/16; white Crinkled = 3/16; and white smooth = 1/16. Have pairs of students conduct about 20 trials and calculate their results.
Organize a laboratory session with microscopes for students to prepare and observe slides of onion root tip cells in various stages of mitosis and their own cheek cells. Students should stain the tissue with iodine or methelene blue to make the cell structures more visible.
Provide time for students to read 4-III,4-IV, and 4-V, and use overhead transparencies of mitosis and meiosis to lead the students through the simplified stages of cell division.
Assuming this is an introductory course, don’t ask students to memorize the detailed sequences of the two kinds of cell division. The important points they should gain from the comparison are:
- Mitosis is how the body grows, providing more new cells identical to the cells that are dividing;
- Meiosis results in sex cells with half of the total compliment of chromosomes. For this reason sex cells exhibit various combinations derived from the total set of paired chromosomes. Sexual reproduction enables new combinations of genes.
- When two sex cells unite the new growing organism has one of each kind of chromosome from each parent.
- A mutation during meiosis can be inherited by the offspring.
Internet Web Sites for Genetics Education
- DNA Learning Center at Cold Spring Harbor http://www.dnalc.org/home.html
- Genetics Education Center, University of Kansas Medical Center http://www.kumc.edu/gec/
- Science Explained, The Cloning of Dolly http://www.synapses.co.uk/science/clone.html
~{}~
Objectives [] Assessment [] Resources
Guides for each Chapter: 1 – 2 – 3 – 4 – 5 – 6 – 7 – 8
Guide for Chapter 5
Soil: the Living Skin of the Earth
- In this chapter students learn how the fate of individual species is linked to the quality of their habitats, and ultimately to the health of the soil that supports terrestrial life. As an introduction, invite students to speculate on what Earth would be like without its covering of soil.
- Following a discussion about the value of soil, assign students to read sections 5-I and 5-II .
- Invite their comments on the controversy surrounding the “Rivet Popper Hypothesis” and the “Redundancy Hypothesis”. Encourage their suggestions for research projects that could provide useful information to support each premise.
- Two examples of biodiversity research are described briefly to give students ideas for designing their own soil experiments. Both the Minnesota study and the Ecotron experiments focused on growth of plant matter as the indicator of productivity.
- Recent scientific research on how species diversity affects productivity is providing information to help resolve the controversies over which species should be saved. Ask student to propose possible improvements, extensions and new experiments related to the two studies described in the Student Guide.
~{}~
TG-LB5-1. Investigation: Comparing Soils
Getting Ready
1. This activity will be more interesting if you and your students collect a variety of different soils. Several weeks in advance, poll students to determine if any live or will be traveling near the following soil types: alluvial soil near streams, forest soil, well developed soil from a meadow, garden soil, and others. Ask volunteers to collect enough soil for several groups to use. Caution them to avoid roadside areas where dog droppings may be common, and areas around gas stations or urban industry where the soil might be contaminated with chemicals.
2. On the day of the activity bring in a fresh sample of soil that is rich in soil organisms.
In addition to having students observe the sample with hand lenses, you may want to set up the following simple collection system for small organisms:
- Put a small piece of steal wool or plastic pot scrubber (must not contain cleansers) in the bottom of a funnel.
- Position the funnel over a container of water.
- Place 1-2 cups of fresh soil in the funnel.
- Position a lamp with an incandescent bulb above the soil, with the bulb shining about eight inches above the soil.
3. Springtails, mites, worms, isopods, thrips and other organisms will move downward through the soil and steel wool to escape the heat. They will float on the surface of the water, and can be collected in an eye dropper and viewed under a microscope or with a hand lens.
Introducing Comparing Soils
- Very briefly describe the worldwide problem of destruction of soil. In the United States alone, thousands of acres of agricultural soil are destroyed each day as a result of being covered with roads and buildings, contaminated with chemicals, or eroded because of deforestation and overgrazing by cattle and sheep. New soil can take hundreds or thousands of years to develop depending on the climate and the plants and animals living in the soil. Desert areas of the world are increasing, in part due to soil erosion caused by human activities.
- Describe soil as a living “coat” of the earth upon which humans and all other terrestrial life depend. Most people in our culture have little experience working with soil and generally have strong taboos about touching it.
- Have students read the investigation.
- Show students the materials and tell them their first step will be to compare the color, texture, and composition of their soil samples. Some students may be reluctant to carefully observe the soil because they regard it as “just dirt.” Reassure them that the soil was collected from “clean “ environments.
- Demonstrate how to put some soil on a piece of white scratch paper and encourage them to observe as many characteristics as possible. Tell them they should be able to identify at least 10 observable characteristics of their sample.
- Organize students in teams, review procedures, and direct them to get their lab notebooks, soil samples, and necessary supplies.
- Visit the different teams to encourage their investigations. If you are willing to touch and observe the soils yourself, your example may help reluctant students to overcome their unnecessary fears.
- Write two headings, “Organic” and “Inorganic” on the chalkboard and invite students to define these terms. Explain that organic substances contain the element carbon and are alive or once were alive. Have students categorize the materials they found in the soil samples as you list the materials under the two headings. Point out that the proportion of organic to organic material in a soil greatly affects soil fertility.
Conducting Water Soil Profile Tests
1. While students are describing their soils, draw 3-4 large outlines of a plastic vial on the chalkboard. Leave space between each drawing for you to label the layers. Prepare to demonstrate the “water soil profile test.”
2. Direct students to put their papers and materials aside while you demonstrate the “water soil profile test” as one way of identifying and measuring the different components of soil:
a. Wrap a piece of clear tape around the middle of the vial and write your name on it.
b. Mark a line 1 inch up from the bottom of a vial, and fill the vial to the mark with potting soil.
c. Add a pinch of salt* (exact quantities do not matter)
d. Fill the vial to the top with water; cover, shake vigorously, and then let stand for one minute.
e. Show the class the layers that result when the lighter material floats and the heavier material sinks.
f. Invite a volunteer to draw in the layers of the “water soil profile” on the first chalk outline of a vial.
* Explain that the salt causes the fine clay particles to stick together and sink to the bottom, thereby clearing the water more quickly.
3. Tell students they have 10 minutes to make the soil tests and draw a picture of the test results.
4. Visit the teams and encourage them to compare their soil profiles: Are the colors similar? Are the same layers of material visible in all vials? What is the layer floating on the surface? (dead leaves, twigs, roots, etc.) What is the material at the bottom? (rocks and sand)
5. Direct students to put all unused soil back in the bags to be used in future experiments. Ask the teams to put the soil profiles in the tray for further observation. Have them clean up all other materials. (This is a good place to break the activity if you need to.)
Comparing the Water Soil Profiles
- Draw students’ attention to the chalkboard drawing of the potting soil profile. Invite students to share their ideas about what is in each layer. Suggest that they start with the bottom layer.
- Write the students’ descriptions of the layers next to the chalkboard drawing of the potting soil. For the bottom layer they will probably describe things like rocks, sand, and heavy stuff. For the layer floating on the top, they may list things like bark, leaves, and lightweight things. The middle layers they may describe as dust, fine sand, mud, etc.
- Ask if anyone found a soil profile that is very different from the potting soil profile. Invite the student(s) to draw the profile(s) next to the picture of the potting soil profile. Again write the descriptions of the layers next to the drawings.
Introducing Content from Soil Science
- Tell students that soil scientists have found that some of the world’s most fertile soils tend to contain similar amounts of the three major components they tested: organic matter, clay, and sand.
- Explain that when the organic matter is well decomposed it is called humus, and provides nutrients for plants. Because the humus is light and crumbly, it helps hold water in the soil and provides spaces for plant roots and small animals.
- Clay is rich in minerals that plants need to grow. Clay soils that contain a lot of iron are a reddish color; those that contain a lot of magnesium tend to be bluish in color. Each clay particle is very tiny and flat, so clay soils tend to become compacted and hard for plant roots to penetrate. They may have observed that the runoff from clay sample was cloudy with clay particles.
- Sand can hold very little water and has few minerals for the plants, but it helps keep the clay in a soil from becoming compacted.
Comparing and Rating the Soils
- Tell students they will be using a rating system to compare their different soils. Rating A: soils that have about the same amounts of all three major layers: organic matter; clay; silt, sand, pebbles Rating B: soils that have all three major layers but one or two of the layers are very thin. Rating C: soils that are missing one or two of the three major layers.
- Ask students to identify the different layers for their own soils and label their drawings. Each team should then agree on a rating for each soil and write the letter of the rating on the clear tape on the vial.
- Direct students to decide which soils seem to have the least ability to provide nutrients and retain water in the soil. Each student should then list ingredients that could be added to his or her soil to make it more like a fertile loam.
- Have someone from each team share the ratings and ideas for improving the soils. Take a tally of the number of soils with each rating.
- Designate a place in the room where teams may store their soil profiles. Eventually most of the suspended clay and floating organic matter will settle to the bottom, so you may want students to make another drawing in a day or so.
Comparing Seedling Growth in Soils
- Give teams 10-15 minutes to design and plan an experiment involving soil properties and plant growth. The Student Guide suggests that they create and test a “super soil” by planting bean or pea seeds. Wisconsin Fast Plants are also ideal for classroom projects that must be completed within 5 weeks.
- Circulate among the teams, asking questions that help focus students on how to control variables. If some teams have similar ideas, suggest that they collaborate so that they can compare results.
- Require that teams hand in their plans plus a list of the equipment they plan to use. This will give you time to review their ideas and provide suggestions.
- Allocate a class period for setting up the experiments, then provide time for daily checks. As the experiments progress, give students time to update and extend their lab reports. Encourage them to make drawings as well as written observations.
- These experiments can provide students with important information and expertise in conjunction with a school or community garden project.
Extensions
- Set up a classroom worm composter and establish a system for enriching garden soil around the school.
- Have students conduct plant growth studies to test the importance of nutrients such as nitrogen, phosphorus, calcium, and potassium.
World’s Productive Land
- The map at the end of 5-II. Research in the Ecotron illustrates that humans already cultivate the most fertile areas of Earth. While there still are large regions that may be productive for cropland, the percentage of arable land in these undeveloped regions may be as low as 25% or less. The map doesn’t show the soil degradation that has occurred on every continent as a result of poor farming and grazing practices.
- Point out to students that the stippled area of the map represents the “25% or more potential cropland”. Have them work in pairs for a few minutes to make a list of inferences or questions they draw from the map.
~{}~
TG-LB5-2. Investigation: BLM and Money
The Bureau of Land Management charges ranchers a fee to graze cattle on public rangelands. The fee is based an “Animal Unit Month” (AUM) which is the unit of forage needed to support a cow and her suckling calf for one month. This amount of food is roughly 1,000 pounds of grass/month. In the semi-arid regions of the West, a cow may need to graze 100 acres/month of rangeland to get this amount of food. In 1995 the standard BLM grazing rate was $1.65/AUM. The BLM uses an estimated Fair Market Value of $10/AUM when it fines ranchers whose cattle accidentally stray onto public land.;
- Have students calculate the BLM fees and necessary acreage for a hypothetical Nevada family ranch that has 1,000 cattle. They should assume that the family grazes the BLM land for 6 months of the year, and feeds the cattle in their own pastures for the other six months.
- How many acres of BLM land will the family need over the six-month period?
- What is the total AUM costs at the current rate of $1.65/mo./cow?
- Approximately how much money does the family save by grazing its cattle on public land rather than paying the competitive rate for private grazing land? (Use the estimated Fair Market Value AUM of $10.)
- Organize teams of 3-4 students and have them enact an imaginary discussion among a farmer, a conservationist, a BLM official, and a local merchant about a proposed new Congressional bill that may raise the rate for grazing on public land. The goal for each team is to reach a win-win agreement in making recommendations to the House and Senate subcommittees that are reviewing the bill for possible modifications.
Additional Resources
Hicks, Craig, “Minimum Standard Needed to Protect U.S. Rangelands,” NewsReport National Research Council, Spring 1994, pg. 12-15. A new report from the National Research Council’s Committee on Rangeland Classification concludes that protecting the ecological health of the nation’s rangelands should be the first consideration in decisions about grazing, recreation, or other uses. Unfortunately the criteria for determining the health of the range have varied between federal agencies such as the Department of Agriculture’s Soil Conservation Service and Forest Service, and the Department of the Interior’s Bureau of Land Management.
Pimentel, David et al. “Environmental and Economic Costs of soil Erosion and Conservation Benefits,” Science February 24, 1995 Vol. 267 pg. 1117-1122.
This article from Science magazine contains a very complete overview of the rate of worldwide soil loss and the economic costs. The article describes the nature of damage to soils and how this affects plant productivity. Students may find it very helpful in providing ideas for their soil experiments.
~{}~
Objectives [] Assessment [] Resources
Guides for each Chapter: 1 – 2 – 3 – 4 – 5 – 6 – 7 – 8
Guide for Chapter 6
Field Trip:
Predatory Bird Research Group
- This chapter is a view into the lives of scientists on the job. The Predatory Bird Research Group (PBRG), at the University of California at Santa Cruz, provides the setting for the research efforts that helped to bring the peregrine falcon back from near extinction. Brian Walton and Janet Linthicum, the two biologists featured in this field trip, are involved with several fascinating studies of predatory bird populations, including bald eagles, golden eagles, burrowing owls, and Harris hawks.
- The Predatory Bird Research Group web site was http://www2.ucsc.edu/scpbrg/
- The case of the peregrine falcon, briefly described here through the PBRG research, raises the issue of toxins in the food web. The web site includes the biology behind the effects of DDT/DDE on bird reproduction.
- You may want to give students extra credit for reading Rachael Carson’s, eloquent Silent Spring, which continues to be one of the most powerful stories of investigative science and the conservation efforts of concerned citizens.
- The topic of “toxins in the food web” is addressed again in Chapter 8 of the Losing Biodiversity Student Guide.
- Encourage students to visit the Ventana Wilderness Society web site where they can view the Condor release site through the Condor Cam. This site also posts the monthly Condor field notes, and annual Bird Banding Totals for the the species found in the area. http://www.ventanaws.org
~{}~
Objectives [] Assessment [] Resources
Guides for each Chapter: 1 – 2 – 3 – 4 – 5 – 6 – 7 – 8
Guide for Chapter 7
One Global Ocean
- The ocean is ultimately the source of all life on the planet, yet this vast system is very vulnerable to the impacts of our technological society. This chapter examines the productivity of this vast system, how we are reducing the biodiversity of the global ocean, and what people are doing to prevent the destruction of marine organisms and environments.
- We suggest that you show a video segment from one of the many inspirational programs that features Jacques Cousteau’s marine explorations.
- The Cousteau Log and Dolphin Log, published by the Cousteau Society, are excellent sources of reports on the activities of citizens working to improve the public’s understanding of ocean environmental problems. (Visit the web site: http://www.cousteau.org)
- The Discovery Channel program Blue Planet is available as a series of videos, and may also be accessed on the internet at www.discovery.com.
- Give students time to read section 7-II, then facilitate a discussion of the International Bill of Environmental Rights. Invite students to share their thoughts and impressions about the impact Cousteau has had on public education.
~{}~
TG-LB7-1. Investigation:
Ocean Food Web Game
From LHS MARE:Marine Activities, Resources and Education
This version of the popular Food Web Game is a powerful and quick way to simulate the relationships between various ocean organisms. Students will identify energy connections between different species, and describe the potential effects to the food web when some become extinct.
Materials for a class of 30 students
- 30 different ocean organism cards—each card should have a picture and the common name of the species, a description of its food, and the names of organisms that eat it. Include plant species such as diatoms and kelp, as well as herbivores, omnivores, and predators.
- a large ball of string or yarn.
Procedure
- Have students sit in a large circle, each holding a picture or name card of a marine plant or animal.
- Toss a ball of string to one student who displays an ocean organism. Holding the loose end of the string firmly, the student tosses the ball to someone else having a species that eats or is eaten by the first organism.
- As students receive the ball, they hold onto part of the string before tossing the ball to another person with an organism in the food chain. Soon all students are linked by a complex string web representing feeding relationships.
- When every student is part of the web, select one organism, i.e. the tuna, and announce that is has become extinct due to overharvest. The student holding the tuna card releases the web while other students pull lightly on the web to identify other organisms that are affected by the loss.
- As you continue to remove species from the web, students identify the impact on other organisms that had a relationship with the extinct species.
- Ask students to help you list examples of ways that humans and other terrestrial animals depend on the ocean. (marine algae and diatoms produce oxygen, ocean is source of planet’s water, land animals depend on food from the sea, etc.)
~{}~
TG-LB7-2. Investigation:
An Apple as the Planet
From LHS MARE:Marine Activities, Resources and Education
Most Americans take their water supply for granted and are not aware of how little of the total water on Earth is actually fresh water. With systems as large as the ocean or the earth itself, it is hard to visualize the dimensions and relationships between the various parts. The following analogy of an apple and the earth gives students a feel for the relative amounts of land and water resources on the planet, and highlights the vulnerability of these resources we share.
What You Need For the Class
- an atlas with rainfall maps
- several globes of the earth For each pair of students
- 1 paper plate to make a pie chart
- 1 ruler
- 1 plastic knife
- 1 medium apple
- 1 set of colored markers
An Apple as the Planet—Student Worksheet
You will dissect an apple into slices to show the proportions of ocean and land that support human cultures.
What You Need
- 1 medium apple
- 1 ruler
- 1 plastic knife
- 1 paper plate for a pie chart
- colored markers
- globe of the earth
Look at a Globe of the World
- Locate the four oceans of the world on a globe.
- Turn the globe upside down so that you can view the Pacific, Indian and Atlantic oceans as one large ocean. You are looking at Earth’s final frontier and its biggest reservoir of unknown life forms.
Use an Apple as the Planet— How much is land?
- Cut an apple into 4 equal pieces from top to bottom. Set three of the pieces aside for the ocean part of the activity. One-forth of the apple represents land.
- Make a Paper Plate Chart by drawing a cross through the center of the plate to make 4 equal quarters. Label one quarter “Land” and three quarters “Ocean.”
- Cut 1/4 of the apple (the land) into 2 equal pieces. Hold up one piece (1/8 of the world). This represents the land that is too dry, too wet, too cold, or too hot for people. The other piece is habitable land.
- Add to your Paper Plate Chart. Divide the “Land” into two equal slices. Label one slice “Uninhabitable,” the other “Habitable.”
- Cut the 1/8 piece of Habitable land into 4 equal pieces of apple.
- Add to your Paper Plate Chart. Label the four pieces: Cities, Rangeland, Forests, Farmland.
- Cut the thinnest possible slice from the Farmland piece. This thin slice represents 3/100 of 1% (3/10,000) of the earth’s surface which supplies all of our drinkable water!
- Add to your Paper Plate Chart. Draw a thin line at the edge of the “Farmland” piece and label it “Drinking Water”.
Use an Apple as the Planet— How much is ocean?
- Cut 1 of the 3 quarters representing the ocean in half. Take one of the halves and cut it in half again. This piece, 1/16 of the world’s surface (or 9.9% of the ocean), represents the productive coastal zones of the ocean. Over 90% of the world’s fisheries occur in this slice! This area of ocean productivity is found over the shallow continental shelves. Set aside the remaining pieces that represent the unproductive ocean.
- Add to your Paper Plate Chart. In the “Ocean” portion of the plate, mark a slice, 1/16th of the whole and label it “Productive Zone”
- Take the 1/16th piece and cut the thinnest possible slice from the apple to represent the 3/4000 of the world’s surface (or 1/1000 of the ocean). This tiny slice represents the tremendously productive upwelling areas found within the coastal zones. These are the richest areas of the ocean that attract migrating birds, seals and whales. About 1/4 of the entire world’s upwelling zones lie off the coast between Alaska and Baja California.
- Add to your Paper Plate Chart. Mark a thin line along the edge of the “Productive Zone” and label it “Coastal Upwelling”.
- Remove the peel from one of the “Ocean’s” quarter pieces. This piece of skin, though it is too thick to be truly accurate, represents the Photic Zone. All seaweed and phytoplankton grow in this zone.
- Add to your Paper Plate Chart. Mark a thin line along the outer edge of one of the “Ocean” quarters, and label is the “Photic Zone.”
- Look at the 2 thin slivers of apple on the plate and the fragment of apple peel. One represents drinkable water, the resource necessary for life on land. One represents the upwelling zones, the most productive places on Earth. The peel represents the photic zone, where all of the ocean’s primary productivity takes place. These three tiny pieces represent the area that supports most life on Earth. These slivers also represent the parts of the land and ocean that humans impact the most!
Questions:
- What are some problems you foresee for a growing human population?
- The photic zone and forests are where the majority of the plants on earth responsible for The uptake of CO2 and the production of O2 occur. What problems do you foresee if these areas are further reduced or damaged?
- What might be the short term and long term consequences of a large oil spill off the west coast of the U.S. in the up welling zone?
7-III. Where Have All the Fish Gone?
- Give students time to read the section, then have them tally the different kinds of fish mentioned in the text and on the map which they have eaten at some time in their life (National Research Council 1994).
- Students will have questions about the terms “depleted” and “fully exploited”. Explain that these are very general ratings. “Depleted” refers to species that have declining fish catches and populations; whereas, “fully exploited” refers to species in which the fish catch has remained about the same for the past few years, and fish populations seem to be remaining about the same.
- Remind students that fish are renewable resources, and Invite them to suggest ways to build cooperation among people and nations for sustaining the world’s fisheries, including corral and reef fish (Derr 1992, Lawren 1992, Craft, 1994).
Shrinking Wetlands
There are many different wetland environments distinguished by unique communities of plants, animals, and microorganisms. They range from brackish water mangrove forests of the tropics to fens and bogs in temperate regions. Find out what aquatic environments are located in your area, and contact local park and water resource agencies for educational materials to help you describe local wetlands.
- A field trip to a local wetlands area (pond, stream, marsh) will stimulate student interest and make the science of aquatic biology come alive. The activities, Habitats of a Pond (OBIS 1984) and Water Canaries (Aquatic Project Wild 1988) guide students through several sampling techniques as they investigate the environmental quality of the area.
- If a field trip is not possible, arrange to show segments of a video documentary of an aquatic area, and ask students to be on the look out for examples of relationships between the land and water environments. For example, they may observe the following: a food web that includes aquatic and terrestrial organisms; erosion of soil coupled with sedimentation; breeding and migratory cycles that include land and water environments; and water pollution, to name a few.
- Organize a microscope laboratory session to investigate and compare the amazing diversity of organisms in samples taken from different water environments.
- Have students work in groups to list products that come from wetland environments. How many of the items have their families eaten or used?
7-VI. Plastic Jellyfish
- Direct students to read this section. Introduce the phenomenon of plastics by inviting students to speculate on how their lives would be different without these amazing substances. Point out that the plastics industry has benefited from the availability of cheap waste and byproducts from the petroleum industry. The emergence of plastics in the second half of the 20th century has had a major impact on economics, environments, and cultures around the world.
- Ask students to suggest some of the warning signs they have noticed in their own lives, that plastics might pose problems (litter that doesn’t break down, children and animals harmed by eating plastic objects, some students may live in neighborhoods subjected to emissions from plastics factories, etc.).
- Poll students to fine out how many of them recycle plastics with their families. Invite them to describe some of their successes and frustrations. This can serve to validate their efforts and generate problem solving ideas.
- Many people who diligently recycle plastics may wonder if their seemingly small contributions make a difference. Local municipal recycling groups can supply impressive data on the annual recycled plastic tonnage from your area. Mention the jobs and services created by recycle efforts.
- Draw students’ attention to Question 7.1 at the end of the section. Invite them to suggest additional questions that they have about the plastics industry and recycling.
- States and cities vary greatly on the extent and kind of recycling services they provide. Some western states have little or no plastic recycling programs. Point out that there are many opportunities for students to initiate educational programs on recycling.
- Plastic recycling is a growth industry. Describe some examples of companies that are creating jobs and profits from reusing our discarded plastics. The book Good Green Jobs by Joel Makower (1995) describes how Talco Plastics, Inc. in Whittier, California has become one of the top ten recyclers of post consumer plastics in the country, working to make recycled plastic products cost-competitive with those made from new materials.
- The Lawrence Hall of Science, Science Education for Public Understanding (SEPUP) Program has excellent activities and materials on plastics that allow students to conduct tests and explore the issues.
7-VII. How Can Consumers Help?
Direct students to read this section.
TG-LB7-3. Investigation:
Product Research
The Product Research activity may be done as a homework assignment or a final project, with students responsible for visiting stores in small groups over a weekend. Alternatively, you may take the entire class on a field trip to a nearby supermarket.
We recommend that you contact the following organizations several weeks in advance, for educational materials on their system of assessing and rating products.
Green Seal
1730 Rhode Island Ave., NW Suite 1050
Washington DC 20036-3101 (202) 331-7337
http://www.greenseal.org
Scientific Certification Systems
Ordway Building One Kaiser Plaza Suite 01
Oakland, CA 94706 (510) 832-1415
http://www.scs1.com
A week in advance, enlist your students’ help in collecting 10-16 examples of products that claim to be less harmful to the environment. (Detergents, paper towels and other paper products, household cleaners, and tuna products often include brands making environmental claims.)
Gather 20 to 30 magazine advertisements that display a variety of persuasive appeals to consumers. For example, the following are common strategies exhibited by adds: scientific claims, environmental claims, claims backed by experts such as mothers of America, endorsement of popular people such as actors, linking a competitor with a negative symbol or incident, claims of enhancing popularity and sex appeal, etc.
Materials
For each group of 3-4 students – magazine advertisements using different appeals – a product that makes an environmental claim – chart paper – water-based marking pens in several colors
Introducing Advertising Appeals
1. To enhance students’ awareness of advertising “pitches”, organize teams of 3-4 and have them compare and discuss several magazine advertisements. Ask them to identify and list the kinds of claims the manufacturers are making.
2. Record their observations on chart paper, and ask if there are other advertising appeals people can think of.
3. Invite suggestions of ways that consumers can find out if advertisements are accurate, and list these.
4. Display the materials you have collected and encourage them to bring in additional information to assist consumers.
~{}~
TG-LB7-4. Investigation:
Introducing Product Evaluation
by Patricia Brown, Brownell-Talbot School Omaha, Nebraska
1. Direct students to work in small groups as if they are members of Green Seal or Scientific Certification Systems (SCS), companies that employ scientists, engineers and lawyers to evaluate products.
2. They are to choose one product from the samples and examine its ingredients and packaging to answer the following questions below.
3. Each group should record its decisions on large chart paper that can be shared with the class.
- What are the product qualities you would evaluate to determine if the product meets your high standards of certification?
- What are 5 questions you would ask to determine the product’s impact on the environment?
- What criteria would you use to give the product your seal of approval?
4. Have the groups post their questions and criteria. Using colored markers to color-code items, facilitate efforts to identify a set of questions and criteria that can be used by everyone during product evaluation. Identify qualities and criteria that are specific to certain kinds of products.
5. You may want to show them the categories that SCS uses for its Environmental Report Card. Note that some of the categories require information that may not be available to the students. Life of the Product Impact: Production (harvest, mine, manufacture, package) Distribution Use by consumers Disposal Nature of the Environmental Burdens: Resource depletion Energy use Air pollution Water pollution Solid waste
6. Point out that a report card system such as the one used by SCS, enables the consumer to compare the total impact of products. SCS uses the example of two brands of paper towels. Towel A is made entirely of virgin wood products; Towel B is made of 100% recycled paper products, and results in no depletion of wood resources, 50% reduction in energy use, 7 times reduction in pollution, and 9 times reduction in land fill garbage.
Introducing Product Research
- Announce that consumer concerns about environmental impacts of products are having an important influence on the decisions that manufacturers make about their products. Invite students to describe some examples of how consumers have reduced environmental impacts (tuna boycott, reduction in Styrofoam products, more fuel efficient cars, use of recyclable materials, use of fluorescent lights).
- Tell students they will work in teams to identify a product research question they would like to investigate. They will then plan a strategy for conducting their product research.
- Guide students in identifying the kinds of information they plan to collect, so that teams may compare their results.
- Help them agree on a data collection format that everyone will use. For example, the class may come up with a standard form that provides some blank space for drawings, special features, and a place for the manufacturer’s address or telephone number.
- Encourage students to come up with guidelines for appropriate behavior in stores. Remind them that they are conducting a product study that can potentially benefit everyone by providing useful information.
- Have students generate a list of possible stores to visit, then give teams time to plan how they will conduct their product research.
Results and Applications
- When the teams complete their field work, have them prepare a brief written summary of their findings.
- Give each team about five minutes to tell about their experiences and results. Encourage students to discuss methods that could be improved. Also encourage them to share thoughts about their own attitudes related to consumer studies.
- Conduct a brainstorm session of possible next steps for sharing their findings with the school and community.
- Invite ideas about how to compile the class findings so that the information might be interpreted more easily.
- Point out that organizations like Green Seal have a responsibility to the public to provide sound evidence. Ask students what procedures they want to use to make certain that the information they share is accurate and unbiased.
- Encourage and assist students in their plans to disseminate their findings.
Extensions
- Conduct one or more of the following activities from Aquatic Project Wild (Western Regional Environmental Education Council 1987): Net Gain, Net Effect; Water We Eating; Wetland Metaphors; Where Have All the Salmon Gone?
- Conduct the computer assisted simulation Fish Banks (Meadows et al. 1993).
- Suggest that, for additional class credit, students read and review a book that provides insights into cultures that are dependent on the ocean for their livelihood, for example: Island of the Blue Dolphins. Scott O’Dell, Dell Publishing, New York, 1987. Shark Beneath the Reef. Jean C. George, Harper Collins, New York, 1989.
~{}~
Objectives [] Assessment [] Resources
Guides for each Chapter: 1 – 2 – 3 – 4 – 5 – 6 – 7 – 8
Guide for Chapter 8
Champions of a Sustainable World
In this chapter, students examine the evolution of stewardship ethics and how students, scientists, journalists, citizens, and lawmakers have worked together to solve environmental problems.
- While students are reading this chapter, draw the Venn diagram from 8-I. What is Conservation?
- Ask students in which circles of the diagram they would place John Muir (resource preservation) and Gifford Pinchot (resource use). Write Aldo Leopold’s name in the circle representing maintenance of global stability, and explain that Leopold was one of the first scientists to address issues of ecosystem management.
- Point out that people who consider themselves to be conservationists and environmentalists may vary in their perspectives, depending on the issue at hand. For example, Leopold favored the wise use of resources as did Pinchot. Their viewpoints overlapped on certain resource issues. (Shade in or indicate the overlap of circles.) While Pinchot tended to focus on the crop to be harvested, Leopold was concerned with the whole ecosystem and relationships between the species affected by harvest. Both men were in favor of parks and shared some common ground with people like John Muir (Point to the overlapping areas with preservationists).
- Encourage students to suggest the names of people past and present who might be classified as conservationists or environmentalists. As you list these on the board, invite them to suggest how they might classify the person’s position with respect to the Venn diagram.
- Caution students that the purpose of using the diagram is not to label or pass judgment on people—just the reverse. The intent is to recognize that there are many different perspectives that need to be acknowledged in order to promote constructive dialogue about controversial issues.
- Because there is so much competition for our dwindling natural resources, it is increasingly important for conservationists to look for common ground and ways to collaborate with others in finding solutions to sustaining biodiversity.
- Ask students to write down an environmental issue that is important to them. Tell them to sketch a Venn diagram showing where they would classify their own perspective. Have them jot down their ideas for how they might seek common ground with other conservationists and environmentalists to build support for their cause.
- Comment on the important role students have played in educating the public about environmental issues, and encourage them to share their knowledge with family and friends.
~{}~
TG-LB8-1. Investigation: Environmental Debates: Dittoheads Versus Eco-Nuts
by Dora Coleman, Provine H. S., MS; Gilbert Richardson, Shabazz H. S. WI; and Elizabeth Stewart, Westside H. S. TN
Students work in teams to research and debate the following issues: protection of spotted owl habitat, ozone depletion, global warming, and acid rain. Each team is assigned a topic and given opposing statements by Al Gore and Rush Limbaugh as a starting point for their library research. Half of each team will debate the “Dittoheads” or Rush Limbaugh viewpoint, while the other team members present the “Eco-Nuts” or Al Gore position.
The purpose of this activity is to improve students’ reasoning and debating skills while raising their awareness of and objectivity towards opposing viewpoints on environmental issues. During their library research and presentations, students will learn to identify and question claims that are unsubstantiated by reliable evidence.
Note: The titles “Dittoheads” and “Eco-Nuts” (from Rush Limbaugh) are used in this activity as a factious reminder that derogatory labels or “put downs” drive people apart and have no place in honest scientific debate.
If your school has a debate coach, work with that person to develop the rules and procedures for the team debates and a system for judging the results. Invite other classes to join the audience. You may also want to encourage students to interview scientists as direct sources of information. Students will need class time spread over about two weeks to research and choreograph their presentations.
Materials
For the class
- articles and clippings on the debate topics
For each team of 6-8 students
- 1 set of position statements on each topic for the Dittoheads and for the Eco-Nuts
Procedures
- Announce that the class will be conducting a series of environmental debates between the fictitious “Dittoheads” and “Eco-Nuts”. Explain that these are the names that Rush Limbaugh has used in his books debating environmental issues. Point out that while the titles “Dittoheads” and “Eco-Nuts” are fun and humorous for the class to use, name-calling hinders the search for truthful information, and isn’t appropriate in the scientific debates they will be presenting.
- Divide the class into four groups, and give each group one of the topics. Have volunteers from each group read the various position statements.
- Explain that each group will research the pros and cons of the issue, collecting evidence for a debate. Half of each team will present the “Dittoheads” arguments and half will speak for the “Eco-Nuts”.
- Encourage teams to develop props, visual aids, and a simulation of a real life situation (presentations to Congress, “60 Minutes” in depth coverage, courtroom drama, and town hall meeting, to name a few).
- Point out that teams will be assessed by a panel of judges on the following aspects of their presentations:
• how thoroughly they presented both positions,
• how well they defended each position and rebutted opposing arguments,
• how well their arguments were supported by documented scientific evidence, and
• how well the team worked together to present the two positions. - Conduct a class discussion to address student questions and facilitate the exchange of ideas about possible ways to proceed.
- Periodically provide students with group time during class to plan and develop their presentations.
- After the debates and wrap-up discussions, encourage students to comment on their feelings about being labeled “Dittoheads” and “Eco-Nuts”.
References
Earth in the Balance by Al Gore
(quotes at http://www.ontheissues.org/Earth_in_the_Balance.htm)
See I Told You So by Rush Limbaugh
(quotes at http://www.ontheissues.org/Told_You_So.htm)
The Way Things Are by Rush Limbaugh
The Way Things Aren’t by Steven Rendall, Jim Naureckas and Jeff Cohen
Group 1 — Global Warming
“Dittoheads” on Global Warming
Radio Talk-show Host, Rush Limbaugh
“Yet we saw in the last chapter there is nothing resembling a consensus on this [global warming] issue among the scientists who have some expertise in this area. In fact, a majority clearly does not believe global warming has occurred.” (page 198, See I Told You So.)
“Eco-Nuts” on Global Warming
Former Vice President, Al Gore
“Global warming is also a strategic threat. The concentration of carbon dioxide and other heat absorbing molecules has increased by almost 25% since World War II, posing a world wide threat to the Earth’s ability to regulate the amount of heat from the sun retained in the atmosphere.” (page 29, Earth in the Balance.)
Group 2 — Acid Rain
“Dittoheads” on Acid Rain
Radio Talk-show Host, Rush Limbaugh
“Steve Kroft of 60 minutes finally tracked down the acid rain story. A government commission spent $500 million and ten years studying the problem and concluded that the problem was minor and correctable. Kroft confronted one of the acid rain fanatics with the evidence. The guy refused to admit he was wrong and mumbled that we will need funding for further research.” (page 163, The Way Things Ought to Be.)
“Eco-Nuts” on Acid Rain
Former Vice President, Al Gore
“Some of the successes in dealing with air quality have created new problems. For example, the use of tall smokestacks to reduce local air pollution has helped to worsen regional problems like acid rain. The higher the air pollution, the farther it travels from its source. Some of what used to be Pittsburgh’s smoke is now Labrador’s acidic snow…Air pollution now reaches every place on Earth. Air samples in Antarctica make the same point.” (pages 82-83, Earth in the Balance.)
Group 3 — The Spotted Owl
“Dittoheads” on the Spotted Owl
Radio Talk-show Host, Rush Limbaugh
“My argument follows simple pure logic. If a spotted owl can’t adapt, does the Earth really need that particular species so much that hardship to human beings is worth enduring in the process of saving it? Thousands of species that roam the Earth are now extinct. Do you hear anyone making the case that the Earth would be better off if dinosaurs were still roaming the planet?…There is no reason to put the timber business out of commission just because of twenty-two hundred pairs of one kind of owl.” (page 162, The The Way Things Ought to Be.)
“Eco-Nuts” on the Spotted Owl
Former Vice President, Al Gore
“The spotted owl is a so called keystone species whose disappearance would mark the loss of an entire ecosystem and the many other species dependent upon it.” (page 121, Earth in the Balance.)
Group 4 — Ozone Depletion
“Dittoheads” on Ozone Depletion
Radio Talk-show Host, Rush Limbaugh
“Evidence is mounting all the time that ozone depletion, if occurring at all, is not doing so at an alarming rate. Even The Washington Post—that haven of liberal mythology—published a front-page story on April 15, 1993, that dismissed most of the fears about the so-called ozone hole.” (page 197-198, See I Told You So.)
“Eco-Nuts” on Ozone Depletion
Former Vice President, Al Gore
“A thinner ozone layer allows more UV radiation to strike the Earth’s surface and all living things on or near the surface. Increased levels of radiation can suppress the immune system which may actually help to increase our vulnerability and to hasten the emergence of several new diseases of the immune system. In Queensland, NE Australia, more than 75% of all its citizens who have reached the age of 65 now have some form of skin cancer. Children are required by law to wear large hats and neck scarves to and from school to protect against UV radiation.” (page 85-86, Earth in the Balance.)
Endangered Habitats and Species
- Have students read 8-IV to 8-IX and the Biodiversity Timeline at the end of the book.
- Explain that the timeline provides only a small sample of all the events that have influenced public policy about the environment. While students read and discuss the timeline in pairs, ask that they jot down any additional events they think of that could be added to the timeline.
- Invite students to comment on trends they notice in the timeline. (increase in setbacks, relationships between citizen action and government action, etc. )
- This would be a good time for you and your students to present information about local environmental initiatives and success stories.
8-IX. How Can We Protect Habitats?
- Some students will have powerful and negative experiences related to environmental justice issues described in this section. Remind students of classroom protocol in discussing sensitive topics. Point out that the goal of the discussions is to inform and educate each other in a safe environment. Participants should share feelings without making accusations, and should speak in turn without being interrupted.
- Direct students to this section, then invite their discussion of the term “environmental justice.” This term implies that all socioeconomic and ethnic groups should bear an equal burden or benefit from environmental conditions, laws, and policy. For example, employers should be required and monitored to provide equally safe working conditions for all employees regardless of whether the worker is at minimum wage or in management.
~{}~
TG-LB8-2. Investigation: Final Essay
- Give students a few minutes to the final essay prompt at the end of the chapter.
- Provide your own guidelines for how they are to proceed in preparing their “Final Essay” for the unit. You may want to have small teams of students work together to prepare an oral presentation to the class or a community group.
- Lead students in a brainstorm of potential topics for an essay. Organize their ideas into categories such as those used in the “Losing Biodiversity Timeline” (setbacks, legal action, citizen action, international action), by environments (oceans, wetlands, forests, deserts, prairies, etc.), or by types of technologies (warfare, agriculture, transportation, energy use, etc.)
- Encourage students to select topics that still have relevance to current policy and public debate. For example, if students were interested in the impact of the Mineral Leasing Act of 1920, they should include the current status and impact of the act and provide recommendations for citizen and government action.
- Outline your format and requirements for the assignment. If students will be working in teams, provide suggestions for ways to divide the project.
- You and your students may want to compile the essays into a volume that can be reproduced and distributed to interested groups and members of the community.
- Students can call the National Wildlife Federation’s (NWF) Enviro Hotline (202) 797-6655 for the latest information on pending environmental legislation. The NWF’s monthly environmental news digest “EnviroAction” is a good source of information about the environmental voting records of congressional leaders.
~{}~
Objectives [] Assessment [] Resources
Guides for each Chapter: 1 – 2 – 3 – 4 – 5 – 6 – 7 – 8
Resources for
Teaching Losing Biodiversity
For latest material relevant to Losing Biodiversity,
see the Stay Current section of the GSS website.
The list below is from the original development of GSS and is out of date and in no way exhaustive for the resources that are available for teaching ecosystem change and related topics.
Organizations
Convention on Biological Diversity. The Convention on Biological Diversity is now located in Canada. The address is: Secretariat for the Convention on Biological Diversity World Trade Center, 413 St. Jacques St., Office 630, Montreal, Quebec, H2Y 1N9, Canada Tel. (514)-288-2220, Fax. (514)-288-6588, e-mail address: http://www.unep.ch/biodiv.
Cousteau Society, 7 rue de l’Amiral d’Estaing 75116 Paris; Telephone (1) 53 67 77 77. Founded in 1974, the Society has extensive educational materials for teachers and students that focus on worldwide overharvest of marine life and pollution. The Society continues to circulate the “Petitions for the Rights of Future Generations”, and publishes Calypso Log and Dolphin Log.
Green Seal, 1730 Rhode Island Ave., NW Suite 1050 Washington DC 20036- 3101. (202) 331- 7337. This non-profit organization provides educational materials about products and companies that have earned the “Green Seal” of approval.
National Audubon Society, P.O. Box 52529, Boulder CO 80322-2529. Membership information Tel. 1-800-274-4201. This organization provides educational materials and programs for teachers and the public, and publishes the magazine: Audubon.
National Center for Science Education Inc. This organizations has an extensive collection of educational materials on evolution for teachers and the public including: pamphlets, books, newsletters, book reviews, and video programs. P.O. Box 9477, Berkeley, CA 94709
National Geographic Society, P.O. Box 96583 Washington DC 20078-9973. The Society has extensive educational materials for teachers and the public, inlcuding National Geographic, and World, and dozens of video productions on wildlife. For information on the Radio Expeditions Program with National Public Radio (which has CDs, audio cassettes, and Teachers” Kits) call 1-800-555-2875. Visit the Radio Expeditions World Wide Web site at http://www.npr.org/RE/
National Wildlife Federation, 8925 Leesburg Pike, Vienna, Virginia 22184. This organization has extensive educational materials for teachers and the public, and publishs: National Wildlife, International Wildlife, EnviroAction News Digest, Ranger Rick, and Your Big Backyard.
World Resources Institute, from World Resources Institute, 1709 New York Ave, N.W., Washington, DC 20006, (202) 638-6300. The institute deals with population education and activities.
World Watch Institute, from World Watch Institute, 1776 Massachusetts Ave. N.W., Washington, DC 20036, (202) 452-1999. This institute deals with population education and activities.
CD-ROM
Bathymetry of Monterey Bay Region, from USGS Department of the Interior, 810 National Center. Reston, VA 22092. High Resolution bathymetry and selected geoscience for the Monterey Bay region.
Birds of America: Multimedia, from CD-ROM Inc., 1667 Cole Blvd., Ste 400, Golden, CO 80401, 303-231-9373; FAX: 303-231-9581. Full text and images on CD-ROM contains Audubon’s Original 1840 1st Edition Octavio Set with full-text and beautiful full color lithographs. Bird calls form Cornell University Library of Natural Sounds, IBM or Macintosh.
Audubon’s Mammals: Multimedia, from CD-ROM Inc., 1667 Cole Blvd., Ste 400, Golden, CO 80401, 303-231-9373; FAX: 303-231-9581. John James Audubon’s beautiful, classic mammal prints are now available on multimedia CD-ROM disc. The rare and complete 1840 edition of “Quadrupeds on North America” includes plates in full color and the text, as well as CD quality sounds from Cornell University’s Library of Natural Sounds for many of the mammals. One of the leading naturalists of his time, Audubon compiled detailed information about each mammal. This disc is a companion to Birds of America: Multimedia and is ideal fro students, history buffs, fine art collectors, libraries, and schools, IBM/compatible or Macintosh.
Wildlife and FIsh Worldwide — Volume I, from CD-ROM Inc., 1667 Cole Blvd., Ste 400, Golden, CO 80401, 303-231-9373; FAX: 303-231-9581. 1971-present. More than 200,000 citations from the US Fish and Wildlife Services Wildlife Review and Fisheries Review. Excellent subject coverage, taxonomic, and geographic identifiers as specific as the county, community, lake, and stream level make this CD-ROM an excellent choice for the natural resource researcher. Semi-annual updates. IBM/compatible only.
Aquatic Sciences and Fisheries, from Cambridge Scientific Abstracts Contains citations, abstracts, etc., from leading journals and other publications. Coverage includes biological, ecological, social, economical, and technical aspects of marine, freshwater, and brackish environments. IBM/compatible only.
1989 Toxic Release Inventory, from Government Printing Office, N. Capitol and H Streets, NW, Washington, DC 20401, 202-783-3238. The complete National 1989 Toxic Release Inventory and Hazardous Substances Fact Sheets containing reference materials on the health and ecological effects of the regulated substances. IBM/compatible only.
Science Activities
O.B.I.S. Outdoor Biological Instructional Strategies, Eureka! Lawrence Hall of Science, UC Berkeley, CA, 94720-5200, 510- 642-1016. Series of stand-alone activities that enable students to explore biology outdoors in the grasslands, woods, streams, and rivers or urban environments within their community. The activities range from the collection of organisms to experiments and similation games.
Video References
Attack on Culture, 500 Nations productions, a Jack Leustig Film, TIG Productions 1994.
Blue Planet, Discovery Channel, 2002, Champions of the Land, with David Hartman;, broadcast, 1/11/1995, Rediscovering America, Discovery Productions of Communications Inc.
Ishi, Last of the Yahi, The American Experience Series of WBGH Boston, Shanachie Entertainment Corp., 1994.
The Medicine Man
Never Cry Wolf
New Range Wars, National Audubon Society, World of Audubon TV Series, 1987.
Bibliography for Losing Biodiversity
Adams, L.W. and Dove, L. E.Wildlife Reserves and Corridors in the Urban Environment. National Institute for Urban Wildlife, Columbia, MD, 1989.
Adams, L.W. and Leedy, D. L. editors, Wildlife Conservation in Metropolitan Environments. National Institute for Urban Wildlife, Columbia, MD, 1991.
Adler, J. and Hager, M. How Much is a Species Worth? National Wildlife1992:30(3): 4-15.
Allison, A.C. Abnormal hemoglobin and erythrocyte enzyme deficiency traits. pp. 101-122 in D.F. Roberts, ed., Human Variation and Natural Selection. Symp. Soc. Study Hum. Biol.1975:13.
American Association for the Advancement of Science, Project 2061, Benchmarks for Science Literacy. Oxford University Press, New York, 1993.
American Institute of Biological Sciences, High School Biology. Biological Sciences Curriculum Study, Green Version, Rand McNally & Co., Chicago, 1963.
Angermeier, P. L. and Karr, J. R. Biological Integrity Versus biological Diversity as Policy Directives. BioScience, 1994: 44(10): 690-697.
Ausubel, J. H. Can Technology Spare the Earth? American Scientist, March/April 1996. 84:166-178.
D’Antonia, C. and Dudley, T. L. Alien Species: How Inadvertent Immigrants Affect Habitats. Pacific Discovery 1993:46(3): 8-11.
Arthur, D. and Holechek, J.L., The North American Bison. Rangelands, June 1992: 4(3):123-125.
Bibliography for Losing Biodiversity Baker, O. Where the Buffaloes Begin. Puffin Books, 1984.
Bakken, G.S. 1990. Creation or Evolution? National Center for Science Education Inc. series, P.O. Box 9477, Berkeley, CA 94709.
Baskin, Y. Ecosystem function of biodiversity. BioScience, 1994: 44(10): 657-660.
Bennetta, W.J. ed. Scientists Decry a Slick New Packaging of Creationism. Science Teacher, May 1987:36-43.
Berg, P., Magilavy, B. and Zuckerman,S. A Green City Program for the San Francisco Bay Area and Beyond. Planet Drum Books, San Francisco,1989.
Blaustein, A. et al. UV Repair and Resistance to solar UV-B in Amphibian Eggs. Proceedings National Academy of Science, 1994:91:1791-1795.
Bohlen, J.T. For the Wild Places: Profiles in Conservation. Island Press, Washington, DC 1993.
Boldenkov, S. V. Reintroduction of the European Bison, Bos Bonasus in the Ukraine. XIIIth Congress of Game Biologists, 1977.
Boy Scouts of America, Jaques Cousteau, Keeper of the Sea. Boy’s Life, Sept.1994: 20-22.
Brickson, B. A Drop of Blood, a Tuft of Hair, and a Little DNA. Pacific Discovery, 1994: 47(4):25-30.
Brown, L., Hane, H., and Roodman, D. (ed. Starke, L.) Vital Signs. W. W. Norton and Co., New York, 1994.
Burdick, A. Invasion of the Naure Snatchers. The New York Times Magazine, Nov. 13, 1994.
California State Department of Fish and Game, Plastic Jellyfish. Aquatic Wild, Western Regional Environmental Education Council, 1987.
Carson, Rachel, Silent Spring. Houghton Mifflin Company Boston, 1962.
Chadwick, D.H. What Good is a Prairie? Audobon, Magazine of the Audubon Society, 1995. 97(6):36- 47.
Chadwick, D. H. Dead or Alive: The Endangered Species Act? National Geographic, 1995:187(3):2- 41.
Costanza, R. Ecological Economics, the Science and Management of Sustainability. Columbia University Press, New York, 1991.
Cousteau, Jacques, The Ocean World of Jacques Cousteau. The Danbury Press, 1973.
Cousteau, Jacques, The Cousteau Almanac, an Inventory of Life on our Water Planet. Doubleday & Co., Inc., New York, 1981.
Craft, L. $20,000 for One Fish? International Wildlife, National Wildlife Federation, 1994:24(6):18- 21.
Darlington, Philip J. Jr. Evolution for Naturalists. John Wiley & Sons, New York, 1980.
Darwin, Charles, Autobiography. Edited by Nora Barlow, New York: Norton, 1969.
Darwin, Charles, The Origin of Species by Means of Natural Selection, 1859. Avenel Books, New York, 1979 ed.
Darwin, Charles, Charles Darwin’s Beagle Diary. Edited by R.D. Keynes. Cambridge: Cambridge Univeristy Press, 1988.
Darwin, F. ed. The Autobiography of Charles Darwin and Selected Letters. Dover, NY, 1958.
Dary, D.A. The Buffalo Book, the Saga of an American Symbol. Avon Books, 1974.
Dasmann, Raymond F. The Destruction of California. Macmillan Company, NY, 1965.
Dunlap, T. Saving America’s Wildlife. Princeton University Press, Princeton, NJ, 1988.
Durrell, L. Gaia State of the Ark Atlas, World Conservation in Action. Anchor Books, Doubleday, New York, 1986.
Edwards, M. Pollution in the Former U.S.S.R. National Geographic, 1994:186(2): 70-99.
Edwards, M. Chernobyl. National Geographic, 1994:186(2):100-115.
Ehrlich, Paul R. and Anne H. Ehrlich, Extinction: the Causes and Consequences of the Disappearance of Species. Ballantine, New York, 1983.
Eifert, V.S. The Buffalo Trace, Nature, 1955:65-68.
Eldridge, N. The Monkey Business: A Scientist Looks at Creationism. New York: Washington Square Press, 1982.
Emerson, Ralph Waldo, Nature. in Nature, Addresses and Lectures, the Works of Ralph Waldo Emerson. Standard Library edition 14 vols. Boston, 1883.
Endler, J.A. Natural Selection in the Wild. Princeton University Press, 1986.
Evans, J. E. Charles Darwin, Revolutionary Biologist. Lerner Pub. Inc., Minneapolis, MN, 1993.
Farb, P. Tragedy on the Plains. in Ecology. Time-Life Books, New York, 1963.
Fleischner, T. L. Ecological Costs of Livestock Grazing Western North America. Conservation Biology, 1994:8(3):629- 644.
Friend, T. Power Tool. National Wildlife, National Wildlife Federation, 1995:33(6):16-23. Garber, S. D. The Urban Naturalist. Wiley, New York, 1987.
Ghiselin, M. T. Alfred Russel Wallace and the Birth of Biogeography. Pacific Discovery, 1993:46(2):17-23.
Gilbert, B. Earth Day Plus 20, and Counting. Smithsonian, 1990:21(1): 47-55.
Goodavage, M. The Plastic Tide. Adopt-A-Beach School Education Program, California Coastal Commission, 1992.
Gore, Al, Vice President, Earth in the Balance, Ecology and the Hmman Spirit, Plume Books, New York, 1992.
Gould, S. Ever Since Darwin. W.W. Norton & Co., New York, 1977.
Gould, S. Hen’s Teeth and Horse’s Toes. W.W. Norton & Co., New York, 1980.
Gould, S. The Panda’s Thumb. W.W. Norton & Co. New York, 1980.
Graham, F. Jr. Winged Victory. Audubon, Magazine of the National Audubon Society, 1994:96(4): 36-40.
Harrison, G.H. Is there a Killer in your House? National Wildlife, National Wildlife Federation, 1992:33(6):10-21.
Harrison, P. Wildlife and People: Scrambling for Space. People and the Planet. United Nations Population Fund, World Conservation Union & Internation Planned Parenthood Federation, 1993: 2(3):6-9.
Harter, J. ed. Animals,1419 Copyright-Free Illustrations of Mammals, Birds, Fish, Insects, etc. Dover Publications Inc., New York, 1979.
Heck, J.G. Heck’s Pictorial Archive of Nature and Science. Dover Publications, N.Y.
Heizer, R.F. and Kroeber, T. Ishi the Last Yahi. University of California Press, Berkeley, 1989.
Hicks, C. Minimum Standards Needed to Protect U.S. Rangelands. NewsReport, Vol.XLIV No. 2, National Research Council, Office of News and Public Information, Washington DC, 1994.
Hodgson, B. Buffalo—Back Home on the Range. National Geographic, 1994:185(5):64-89.
Hornaday, W.T. Our Vanishing Wild Life. Charles Scribner’s Sons, New York, 1913.
Howe, H.F. Managing Species Diversity in Tallgrass Prairie: Assumptions and Implications. Conservation Biology, Sept.1994:8(3): 691-704
Hyman, R. Rise of the Rubber Tappers. International Wildlife, National Wildlife Federation Sept.-Oct.1988:18(5): 24- 28.
Jimenez, J. In the Mouth of a Whale. Pacific Discovery Winter 1996. pg. 3.
Katz, P. The New Urbanism: Toward an Architecture of Community. McGraw-Hill, New York, 1993.
Kettlewell, H. B. D. A survey of the frequencies of Biston betularia L.(Lep.) and its melanic forms in Britain. Heredity 1958:12: 51-72.
Kroeber, T. Ishi in Two Worlds, A Biography of the Last Wild Indian in North America.
Kutner, L. A. and Mares, R. Environmental Discrimination: An Annotated Bibliography. Council of Planning Librarians Bibliography Series (Issue #306), Justice Booksellers, Washington, DC.
Lawren, B. Net Loss. National Wildlife, National Wildlife Federation Oct.- Nov. 1992:33(6):46-53.
Lean, Carston, Olympic Battleground. 1994.
Leopold, Aldo, A Sand County Alamanac, And Sketches Here and There. Oxford University Press, New York, 1949.
Limbaugh, Rush, The Way Things Ought to Be. Pocket Star Books, New York, 1992.
Limbaugh, Rush, See I Told You So. Pocket Star Books, New York, 1993.
Linden, Eugene, Ancient Creatures in a Lost World Time, June 20, 1994:143(25): 52-54.
Lipske, M. Green Seal of Approval. National Wildlife, National Wildlife Federation June-July 1994:32(4): 22-24.
Makower, J. Good, Green Jobs, How Business is Putting the Environment to Work for California. California Department of Conservation, 1995.
Marsh, George Perkins, Edited by David Lowenthal, Man and Nature. originally published in 1864, Harvard University Press, Cambridge, 1965.
Marshall, R. Impressions from Wilderness. Nature Magazine, 1951:44:481.
McCollister, B. ed.Voices for Evolution. National Center for Science Education Inc., 1989.
McDonald, J. N., North American Bison: Their Classification and Evolution. University of California Press, Berkeley, 1981.
McHugh, T. The Time of the Buffalo. A.A.A. Knopf, New York,1994.
McIntosh, P. Embracing Dilemmas the World Over. International Wildlife, Nov-Dec. 1990:20 (6): 12-16.
McKisson, M. and MacRae-Campbell, L. Endangered Species: Their Struggle to Survive. Zephyr Press, Tucson, AZ 1990.
Maxwell, J. True Nature. Audubon, Magazine of the Audubon Society, July-Aug. 1994:96(4): 28-33.
Meadows, D., et al. “Fish Banks” Institute for Policy and Social Science Research, Univeristy of New Hampshire, 1993.
Meagher, M. Bison, Big Game of North America, Ecology and Management. ed. John L. Schmidt and Douglas L. Gilbert, Stackpole Books, 1990.
Meagher, M. The Bison of Yellowstone Park. National Park Service Scientific Monograph Series, No. 1, 1974.
Meagher, M. and Meyer, M.E. On the Origin of Brucellosis in Bison of Yellowstone National Park: A Review. Conservation Biology, 1994:8(3): 645-653.
Miller, B., Ceballos, G. and Reading, R. The Prairie Dog and Biotic Diversity. Conservation Biology, 1994:8(3): 677-681.
Miller, J. and Van Loon, B. Darwin for Beginners. Random House, New York,1985.
Mitchell, J.G., Saved Just in Time, the Buffalo Graze Again on Our Plains. Smithsonian, 1981:12(2): 71-79.
Mitchell, J.G., Our Polluted Runoff. National Geographic, 1996:189(2):106-125.
Nabokov, P. ed. Native American Testimony: An Anthology of Indian and White Relations, First Encounter to Dispossession. Thomas Y. Crowell, 1978.
Nash, R. Wilderness and the American Mind. Yale University Press, New Haven, CN,1967.
National Geographic, 1491 America Before Columbus. 1991:180(4): 4-99.
National Research Council, Ecological Knowledge and Environmental Problem-Solving. National Academy Press, Washington DC, 1986.
National Research Council, Improving the Management of U.S. Marine Fisheries. National Academy Press, Washington DC, 1994.
National Wildlife Federation, People Who Make a Difference. National Wildlife, 1993: 31(6): 44-51.
Naeem,S., K. Haakenson, L.J. Thompson, J.H. Lawton and M.J. Crawley. Biodiversity and plant productivity in a model assemblage of plant species. Oikos, 1996:76:259- 264.
O’Hara, K., Iudicello, S., and Bierce, R. A Citizen’s Guide to Plastics in the Ocean. Center for Marine Conservation, Washington DC, 1988.
Parfit, M. Facing Up to Reality in the Amazon. Smithsonian, 1989:20(8): 58-77.
Parkman, Francis, The Oregon Trail: Sketches of Prairie and Rocky-Mountain Life. Boston, 1873.
Paulson, Gary, Dogsong. Puffin Books, New York, 1985.
Pick, M. How to Save Your Neighborhood, City or Town: The Sierra Club Guide to Community Organizing. Dell, New York, 1993.
Pimentel, David et al. Environmental and Economic Costs of soil Erosion and Conservation Benefits. Science Feb. 24, 1995:267:1117-1122.
World Resources 1994-95, Short Duration Grazing: Reclaiming or Ruining the Range. World Resource Institute. 1709 New York Ave. NW, Washington, DC, 20006.
Poten, C.J. A Shameful Harvest, America’s Illegal Wildlife Trade. National Geographic. 1991:180(3):106-132.
Pyle, R.M. The Thunder Tree: Lessons from an Urban Wildland. Houghton Mifflin, New York, 1993.
Reading, R.P. and Kellert, S.R. Attitudes toward a Proposed Reintroduction of Black-footed Ferrets (Mustela nigripes). Conservation Biology, 1993:7(3): 569-580.
Register, R. Ecocity Berkeley: Building Cities for a Healthy Future. North Atlantic Books, 1987. Rendall, S., Naureckas, J. and Cohen, J. The Way Things Aren’t. 1993.
Roger, Lewin, Thread of Life, The Smithsonian Looks at Evolution. Smithsonian Books, Washington, DC, 1982.
Rorabacher, A.J., The American Buffalo in Transition, an Historical and Economic Survey of the Bison in America. North Star Press, 1970.
Sale, K. The Conquest of Paradise. Alfred A. Knoph, New York, 1990.
Salopek, P. Gorillas and Humans: an Uneasy Truce. National Geographic, 1995:188(4):72-83.
Seal, U. S. Conservation Biology and the Black-footed Ferret. 1989.
Seton, Ernest Thompson, The Buffalo. Lives of Game Animals, Vol. III, Hoofed Animals. Literary Guild of America Inc. New York, 1937.
Shaw, J.H. How Many Buffalo Originally Populated the Western Rangelands? Rangelands, 1995:17(5):148-150.
Shaller, G. Gentle Gorillas, Turbulent Times. National Geographic, 1995:188(4):65-69.
Slack, G. Natural Law: Congress Reconsiders the Endangered Species Act. Pacific Discovery, 1992:45(2):22-31.
Slack, G. Emerald Cities. Pacific Discovery 1994: 47(2):27-33.
Smith, C. H., editor, Alfred Russel Wallace: An Anthology of his Shorter Writings. New York, Oxford University Press, 1991.
Stebbins, R. and Brockenbrough, A. Simulating Evolution. American Biology Teacher, 1975:37(4): 206-211.
Stebbins, R. and Nathan, W. A Natural History of Amphibians. Princeton University Press, Princeton, NJ, 1995.
Stegner, W. It All Began with Conservation. Smithsonian, 1990:21(1): 34-43.
Stein, S. The Evolution Book. Workman Publishing, New York, 1986.
Stein, S. Noah’s Garden: Restoring the Ecology of Our Own Backyards. Houghton Mifflin, New York, 1993.
Steinhart, P. The City: An Evolutionary Crucible. Pacific Discovery, 1994:47(2): 6-9.
Steinhart, P. California’s Wild Heritage, Threatened and Endangered Animals in the Golden State. California Department of Fish and Game, 1990.
Sunquist, F. Zeroing in on Keystone Species. International Wildlife, National Wildlife Federation. 1988:18(5):18- 23.
Swan, L.W., The Scientific Spiritualist. Pacific Discovery, 1993:46(2):24-25.
Thelander, C.G. Ed. Life on the Edge, a Guide to California’s Endangered Natural Resources: Wildlife. Biosystems Books, Santa Cruz, CA 1994.
Thomas, J.W., Forsman, E.D., Lint, J.B., Meslow, E.C., Noon, B.R. and Verner, J. A Conservation Strategy for the Northern Spotted Owl, U.S. Government Printing Office, Washington, DC, 1990.
Thoreau, Henry David, Walking. in Excursions, the Writings of Henry David Thoreau. Riverside edition, Boston, 1983.
Tilman, D. and J.A. Downing. Biodiversity and stability in grasslands. Nature (London), 1994:367:363-365.
Trefethen, J. An American Crusade for Wildlife. Winchester Press, 1975.
Trefil, J. A Scientist in the City. Doubleday, New York, 1994.
U.S. Fish and Wildlife Service, The National Bison Range. Refuge Leaflet 12-R, U.S. government Printing Office, 1961.
Vessel, M.F. and Wong, H.H. Natural History of Vacant Lots. University of California Press, Berkeley, 1987.
Waldman, C. Atlas of the North American Indian. Facts on File Publications, New York, 1985.
Wallace, Alfred Russel, The Malay Archipelago. Dover Books, 1962.
Watkins, T.H., What’s the Matter with the Endangered Species Act? Audubon, Magazine of the National Audubon Society, Jan.-Feb. 1996.
Weiner, J. The Beak of the Finch, A Story of Evolution in Our Time. Alfred A. Knopf, New York, 1994.
Western Regional Environmental Education Council, Project Wild, Revised 1986.
Wexler, M. Americans Speak Out. National Wildlife, National Wildlife Federation,1995:33(3): 34-37.
Wilson, E.O. Sociobiology. 1972.
Wilson, E.O. The Current State of Biological Diversity. in Biodiversity, National Academy Press, Washington, DC, 1988.
Wilson, E.O. and Peter, F. M., editors Biodiversity. National Academy Press, Washington, DC, 1988.
Wilson, E.O. “E. O. Wilson to the Defense.” National Wildlife, National Wildlife Federation, 1996:34(1):10-17.
World Resources Institute, The 1992 Environmental Almanac. Houghton Mifflin Company, Boston, 1992.
Youth, H. Flying into Trouble. World Watch, 1994a: 7:10- 19.
Youth, H. Birds are in Decline. In L. Brown, H. Hane, and D. Roodman, (ed. L. Starke) Vital Signs. W.W. Norton and Co., New York, 1994b.
Zihlman, A.L. Human Evolution Coloring Book. New York: Harper & Row, 1982.
Index of Teacher Guide Investigations
- TG-LB1-1. Biodiversity Assessment
- TG-LB2-1. Estimate the Number of Bison Killed
- TG-LB2-2. Graph the Population of the Buffalo
- TG-LB2-3. Biodiversity Issues
- TG-LB3-1. Simulate Natural Selection with “Beetles”
- TG-LB3-2. Designer Beaks
- TG-LB3-3. Ideas for Research Projects
- TG-LB3-4. Evolution of Symbiotic Relationships
- TG-LB4-1. Hybrid Cross Coin Toss
- TG-LB5-1. Comparing Soils
- TG-LB5-2. BLM and Money
- TG-LB7-1. Ocean Food Web Game
- TG-LB7-2. An Apple as the Planet
- TG-LB7-3. Product Research
- TG-LB7-4. Introducing Product Evaluation
- TG-LB8-1. Environmental Debates: Dittoheads vs Eco-Nuts
- TG-LB8-2. Final Essay