LC13. What Does Earth’s Past Tell Us About Our Future?
Chapter 13
In Life and Climate we have seen how Earth’s changing climate and evolving life forms have influenced each other over the past 4.6 billion years of our planet’s history. In the first part of this chapter we briefly review highlights of this fascinating story. In the last part of the chapter we turn to the important question—how can an understanding of our history help us predict the future?
I. Major Periods and Important Cycles
Scientists do not know how life began, but fossil stromatolites are evidence that living organisms existed on Earth as early as 3.5 billion years ago. These early life forms, known as blue-green algae, injected into the atmosphere huge quantities of free oxygen—a gas that did not exist in large quantities on the early Earth. By 2.1 billion years ago, Earth’s atmosphere had enough oxygen for entirely new kinds of life forms to develop—those that derived their life energy from chemical reactions with oxygen gas.
Plants and animals participate in natural cycles that continuously modify the atmosphere. For example, in the oxygen cycle plants take in carbon dioxide and produce oxygen through photosynthesis, while animals absorb oxygen and produce carbon dioxide through respiration. As a result of these processes oxygen is continuously cycled between plants and animals.
Another important cycle is the long-term carbon cycle in which carbon dioxide is removed from the atmosphere by rainwater to form carbonic acid. This acid rain reacts with minerals on Earth’s surface and flows to the oceans where it becomes trapped in sediments. Eventually the carbon dioxide returns to the atmosphere through volcanic eruptions. Irregularities in this cycle contribute to great swings in climate, from tropical conditions to ice ages.
Yet another source of climate change is Earth’s relationship to the Sun, including both changes in Earth’s orbit and the tilt of its axis. Although these cyclic changes have been too slight to affect the climate during warm periods, it has become important in the last 33 million years as Earth cooled enough to begin a cycle of ice ages.
II. Earth’s Changing Climate
Unfortunately, there is little evidence of Earth’s earliest climate history. Although paleoclimatologists can build computer models of what the earliest atmosphere and climate must have been like, the knowledge of the first 4 billion years of climate history is only vaguely perceived.
However, a variety of methods have proven to be of value in reconstructing climates as early as the beginning of the Cambrian period. These methods have been described in previous chapters.
On the following pages are a series of graphs, some from earlier chapters, that show what is currently known about climate history from the Cambrian period to the present. Climates of the most recent periods are better understood, so the graphs of more recent times are more accurate and detailed.
Since the time scale of these graphs vary, it is sometimes difficult to visualize how they relate to each other. Therefore, shaded areas on each page show how the time scale of each graph relates to the previous graph.
Graph A
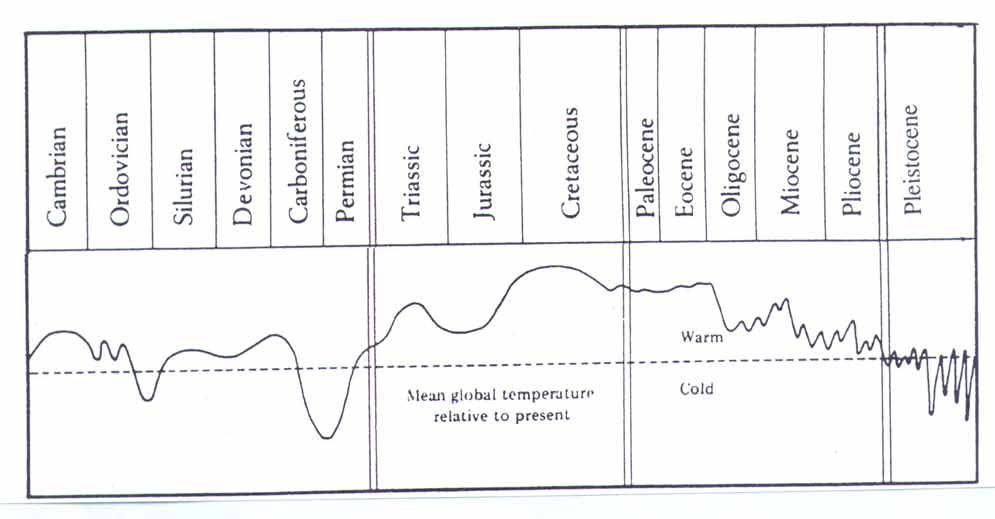
Graph A shows average global temperature from Cambrian period to the present.
Question 13.1.
What may have caused the ice age at the end of the Ordovocian period?
Question 13.2.
What may have caused the ice age at the end of the Carboniferous period?
Question 13.3.
What may have caused the long-term cooling that started with the Oligocene period?
Question 13.4.
What may have caused the recent cycle of ice ages?
Graph B
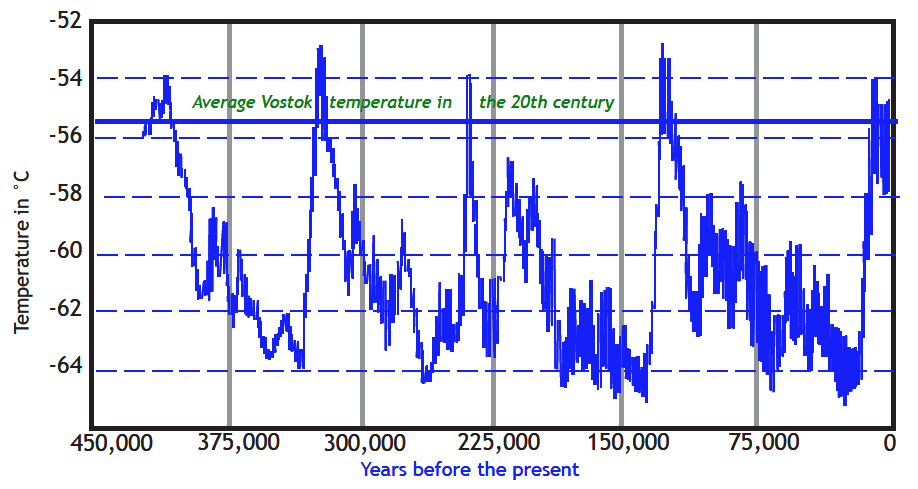
Graph B shows the temperature at Vostok, Antarctica, over the past 420,000 years. Although it was colder in Antarctica than elsewhere, the major ups and downs in temperature are thought to reflect ice ages and interglacial periods worldwide.
Question 13.5.
Point to the current interglacial period and the previous four interglacials.
Question 13.6.
What is the difference in temperature between an interglacial period and an ice age?
Question 13.7.
Approximately how many years apart are interglacial periods?
If the pattern continues, when might the next ice age begin?
Graph C
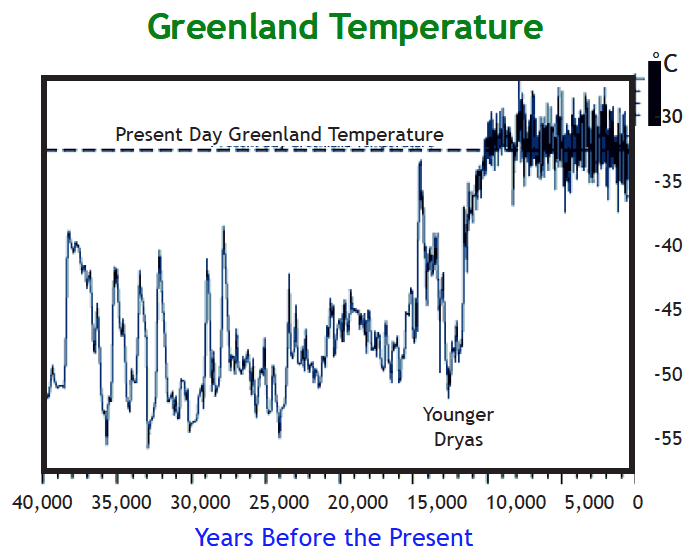
Graph C shows central Greenland temperature over the past 40,000 years. Although it was colder in central Greenland than elsewhere, the pattern of temperature change was similar throughout the world.
- Describe temperature changes since the last ice age.
- Describe what may have caused the Younger Dryas.
Question 13.12
Point out the period of time starting with the agricultural revolution to the present. How was Earth’s climate during this period different from previous times? What effect might this relatively stable climate have had on human history?
Graph D
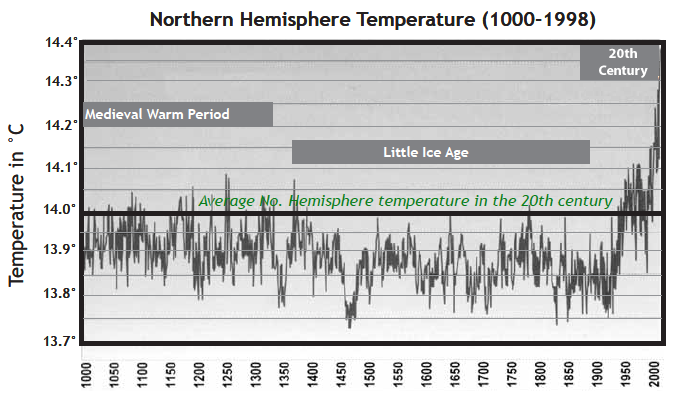
Graph D shows temperature in the Northern Hemisphere over the past 1,000 years.
Question 13.13.
How does the difference between the lowest and highest temperatures during this period compare with changes since the last major ice age ended about 10,000 years ago?
Question 13.14.
How does the temperature during the 20th century compare with temperatures during the previous nine centuries?
Graph E
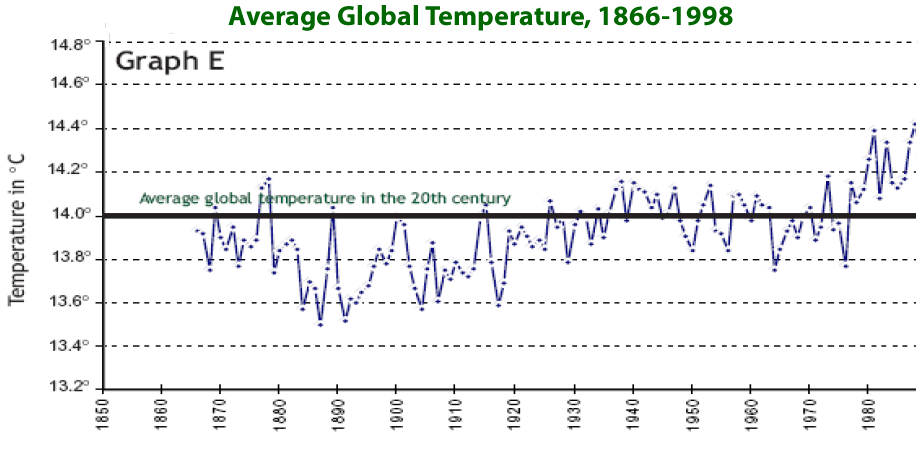
Graph E shows annual temperatures since 1866. The theory of global warming attributes the warming in the past 100 years primarily to widespread burning of fossil fuels. Those who disagree with this theory say that the warming is almost entirely due to a natural climate cycle.
Question 13.15.
How do the graphs support the theory of global warming?
Question 13.16.
How do the graphs support the theory of a natural cycle?
III. Evolution of Life and Climate—An Overview
As we have seen in the preceding chapters, there are many factors that have influenced the development of life forms. Shifting continents and even impacts from space have significantly affected the environment so that some life forms multiplied and prospered while others became extinct. Earth’s changing climate has affected the evolution of life, and at certain key points in Earth’s history, life has affected Earth’s climate. This story—the history of life and climate—is summarized in the following chart.

| Eon/Period/Epoch | Life | Climate |
|---|---|---|
| Holocene epoch (approximate start) 11,000 years ago (ya) | Humans expand worldwide, domesticate animals and plants; complex civilizations develop | most recent ice age ends, interglacial period; global warming in the last 150 years |
| Extinction of large, plant-eating mammals and their predators | (mammoths, saber-tooth tigers, etc.) | |
| Pleistocene epoch 1.6 million years ago (mya) | first members of genus homo; anatomically modern humans evolve | long ice ages with brief interglacial periods; Earth cooler and drier than now |
| Pliocene epoch 5.3 mya | first hominids (upright primate) evolve in Africa | cooling continues, ice ages begin in Northern Hemisphere |
| Miocene epoch 24 mya | forest-dwelling species in most regions (great apes and hominid apes) | climate fluctuates; large ice sheets in Antarctic; overall drier than today; forests give way to grasslands |
| Oligocene epoch 37 mya | large mammals, whales, birds expand worldwide; apes emerge | cooling of deep ocean begins; first ice sheets in Antarctica |
| Eocene epoch 58 mya | larger mammals (horses, mammoths, monkeys); whales and dolphins evolve | temperatures warmer than now, then becoming cooler and drier |
| Paleocene epoch 65 mya | mammals and reptiles survive extinction and evolve into many new species | temperatures warmer than now |
| Great mass extinction— | 50% of all living families, and all of the dinosaurs | |
| Cretaceous period 144 mya | flowering plants; variety of small mammals, fish, and insects; dinosaurs | very warm; carbon dioxide five times greater than today; Pangaea split in two |
| Jurassic period 208 mya | flourishing of dinosaurs; diversification of reptiles and insects; earliest bird | temperatures continue to warm |
| Triassic period 245 mya | Age of Reptiles begins; first dinosaurs; conifer-like plants, ferns; first mammals | Alternate heavy rains and dry periods; warm; deserts to forests and swamps |
| Greatest mass extinction— | 90% of marine species, reptiles, flora, coral reefs, etc. | |
| Permian period 286 mya | diverse reptiles; decline of amphibians; plant profusion | all continents form Pangaea; generally warm temperatures after ice age |
| Carboniferous period 360 mya | Age of Amphibians; first reptiles; diverse insects, fernlike and seed-bearing plants | coal-forming swamps and forests; warm, followed by several ice ages |
| Devonian period 408 mya | Age of Fish; first amphibians, insects, and forests; diverse land plants | two land masses; warm except for a brief, mild ice age |
| Silurian period 438 mya | first fish with jaws; first land animals | high carbon dioxide level; warm surface temperatures |
| Ordovician period 505 mya | marine life forms evolve and expand; first land plants | high carbon dioxide level; warm surface temperatures |
| Cambrian period 570 mya | diverse multi-cellular life forms evolve and expand; first land plants | high carbon dioxide level; warm surface temperatures |
| Deepest ice age— | Beginning of multicellular life | |
| Proterozoic eon 2,500 mya | single-celled life forms | extreme cold (ice ages) alternating with warmer temperatures than today |
| Archaean eon 3,500 mya | blue-green algae (stromatolites) | algae produce oxygen; increasing ozone; conditions suitable for life |
| Hadean eon 4,600 mya | no known life forms | cloudy, moist hydogrn-rch atmosphere; some CO2; later, clearing skies |

LC13.1. Investigation: Timeline II
In Chapter 2 the class created a timeline of Earth’s entire history, and updated this timeline chapter by chapter. Check the timeline against the previous chart, adding key developments to the timeline wherever they may have been left out. Make sure the following key developments are prominently labeled:
- First life forms—probably blue-green algae
- First simple plant life
- Appearance of complex life
- Major extinction event at the end of the Permian period
- Beginning of the Age of Reptiles
- Major extinction event at the end of the Cretaceous period
- Beginning of the Age of Mammals
- The first primates
- First hominids
- The first anatomically modern humans
- Beginning of human cultures
- The invention of agriculture
IV. Predicting the Future
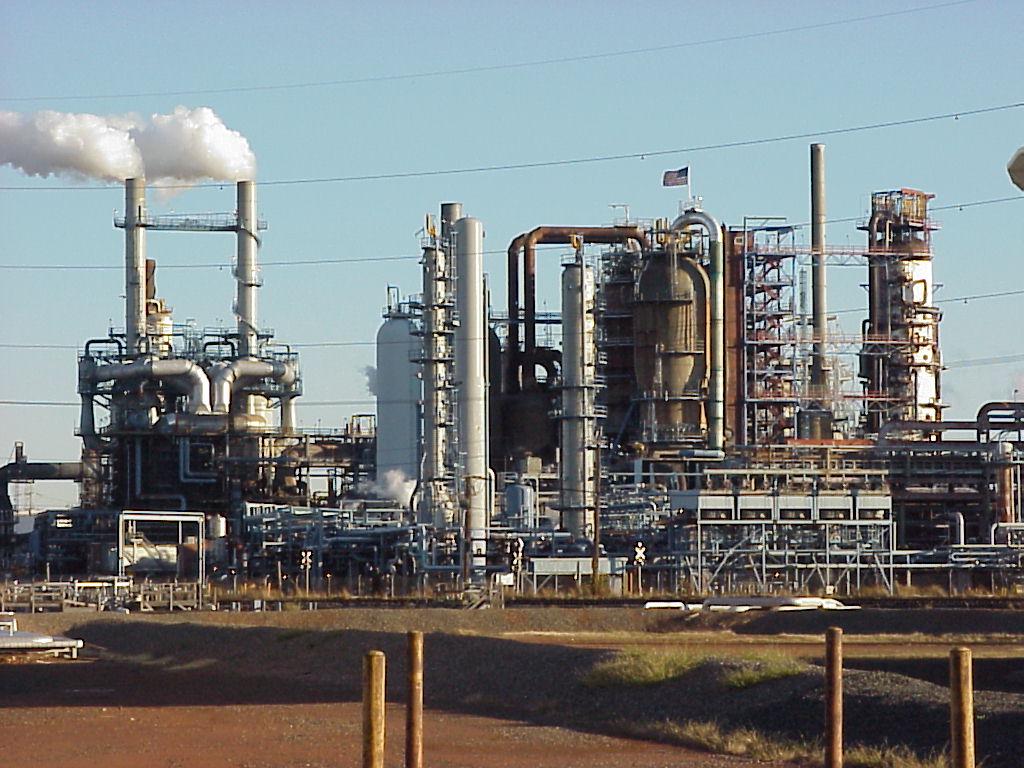
In the past 100 years—a blink in Earth’s long history—human activities have changed the atmosphere. By burning coal, natural gas, and oil (fossil fuels) for energy, people have increased the concentration of carbon dioxide in the air. Similarly, farming and manufacturing have caused an increase of methane, nitrous oxides, and a variety of other gases. As a result, we are faced with a significant environmental issue.
In recent years, the theory of global warming—that changes in the atmosphere as a result of human activities is causing Earth’s average global temperature to rise—has generated considerable concern and controversy. Two sets of data support the theory. One set is the collection of measurements showing that the concentration of carbon dioxide and other greenhouse gases in the atmosphere has increased in the past century or so. The other set is taken from thousands of temperature measurements showing that Earth’s average global temperature has increased during the past 100 years by about 0.5° Celsius. [See Temperature Scales.] The theory of global warming ties these two sets of data together by proposing that the increase of greenhouse gases in the atmosphere is causing the increase in global temperature. If this relationship is correct, then we can expect the climate to become even warmer as the human population increases.
Additional studies show that a warmer climate may result in:
- Sea level rise and inundation of low-lying islands and coastal areas,
- Increase in violent storms, resulting in major damage,
- Increased rainfall in some areas, droughts in other areas,
- Loss of forests and increase in desert area,
- Increased incidences of diseases carried by insects and shortages of food or fresh water,
- Changes in growing season and precipitation,
resulting in increased production in some places
and reduced production in other places.
An international panel of 2,500 scientists has issued reports in recent years that summarize what is known about climate change. In brief, these reports show that scientists agree that the concentration of carbon dioxide, methane, and other greenhouse gases is increasing; Earth’s average temperature has warmed 0.5°C in the past 100 years; and the climate will become warmer as the concentration of greenhouse gases in the atmosphere increases.
World leaders are considering a number of steps that can be taken to slow the increase of greenhouse gases. These possible actions are controversial because many of them will cost money and jobs. In the United States, there have been congressional hearings on this topic, but Congress is far from agreeing on what steps can and should be taken. However, most politicians agree that scientific research on climate change should continue.
Some of the questions still being researched are:
1. Has the warming observed so far caused any noticeable effects?
2. How much of the increase in Earth’s average temperature is part of a natural cycle, and how much is due to human activities?
3. How rapidly will the concentration of greenhouse gases increase, and how will it affect Earth’s climate in the future?
4. How will life on Earth be affected by climate changes?
LC. Investigation: What Does Earth’s Past
Tell Us About Our Future?
Imagine that the U.S. Congress has set aside $100 million for the study of past climate changes. The purpose of this research will be to learn about Earth’s past in order to better predict future climate changes.
The Request for Proposals states that individual scientists may apply for up to $2 million to study a particular period in Earth’s history. Your job is to submit a proposal to conduct further studies of life and climate during a particular period of time. Successful proposals must
- show that the period studied will reveal important principles about how life and climate interact;
- describe a method of study that will reveal information about climate and life that is not already known; and
- explain how information about this period would apply to current dilemmas concerning the theory of global warming and the anticipation of future ice ages.
Your instructor may have further guidelines for you to use in preparing a written or oral presentation of your research proposal.
V. Conclusion
The many scientists who have contributed to the immense body of knowledge so briefly summarized in these chapters were in large part motivated by curiosity—that human desire to understand our origins and the history of our planet. The interaction between climate and life is a key aspect of that story.
But there is another important reason for wanting to learn about the history of climate and life, and that is to try to predict the future, based on what we know about the past.
Billions of years ago blue-green algae changed the composition of the atmosphere. Today, a different species is changing the atmosphere. We are. The added carbon dioxide, methane, and other greenhouse gases in the atmosphere are gradually changing its heat-trapping properties. We also know that people who live in the developed nations such as the United States burn more fossil fuels per person than people in less developed nations.
Unlike blue-green algae, we are aware that we are changing the atmosphere, and we can make choices. As citizens of an industrialized nation, our choices have a major impact on the environment.
In the coming decades, you will have opportunities to choose where and how you will live. These decisions—along with the choices made by many others—will determine future human activities, which in turn will affect the global climate.
The purpose of this volume is to prepare you for those choices by helping you understand the complex relationship between climate and life. Now that you have completed this volume, you have the power to collaborate with others in determining the future environment of our planet.