
DEW2.2. Spatial Analysis: Area
Materials
- AnalyzingDigitalImages software
- Image:
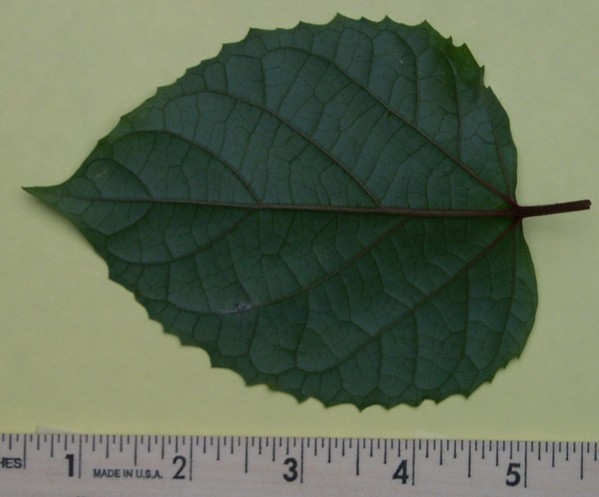
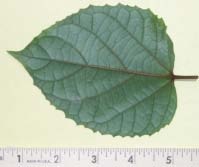
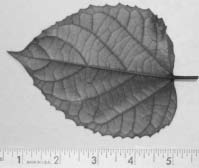
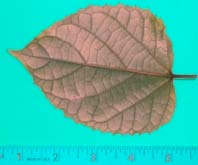
Plant Leaf with Ruler
(or any image including an object of known size such as a ruler to determine scale).
Open the Plant Leaf image
the same way as done in Investigation 2.1.
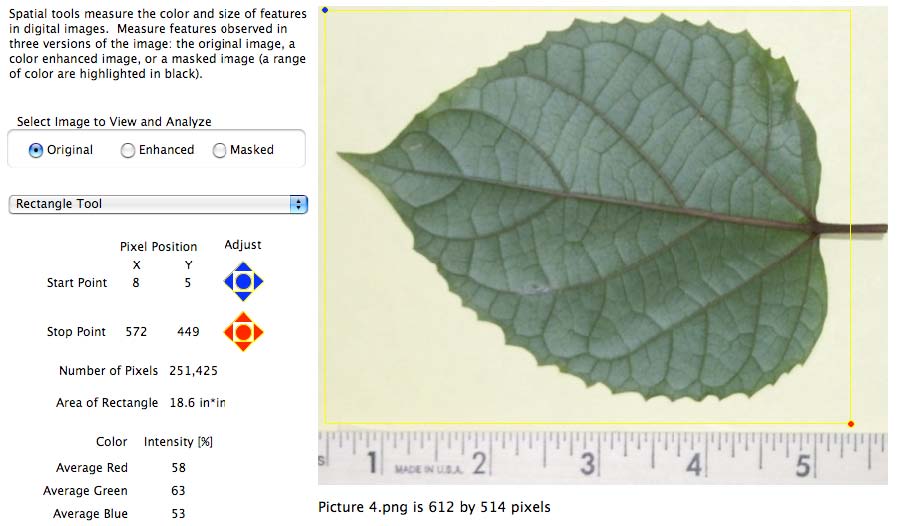
Method 1: Rectangle Tool
In the tools dropdown menu, select the Rectangle Tool. Then click and drag to draw a rectangle around the object of interest. To adjust the size of the box, either click and drag the blue or red corner of the box or click the small arrows that appear to the left of the image.
As one would expect, this would not yield very accurate area measurement for objects that aren’t rectangles.
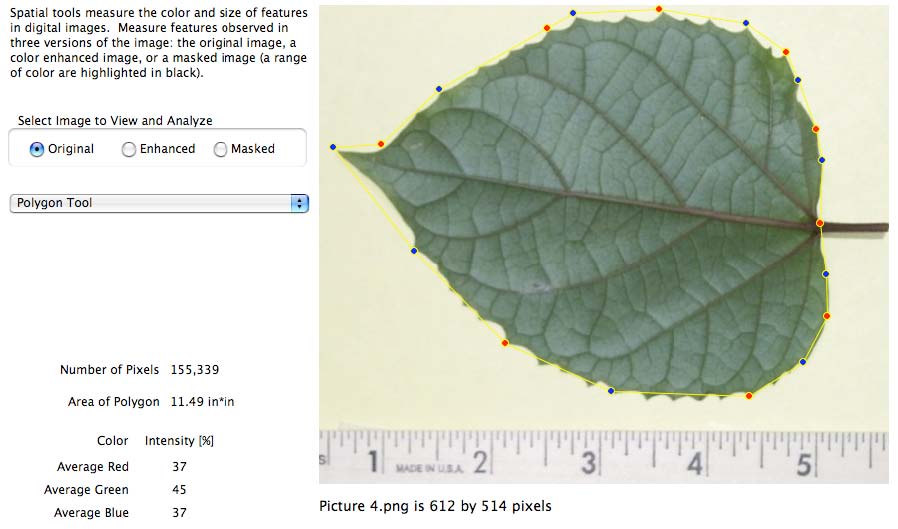
Method 2: Polygon Tool
1. Draw a polygon around the object using the Polygon tool. Click on the image to place each corner of the polygon. Note: you may draw up to 20 corners to define a polygon. A warning appears after the 19th corner is drawn.
2. To adjust the size or shape of the polygon, click near a corner and drag.
If this method provides a sufficient precision for your needs, save your measurements and process your next picture.
Method 3: Masking Colors
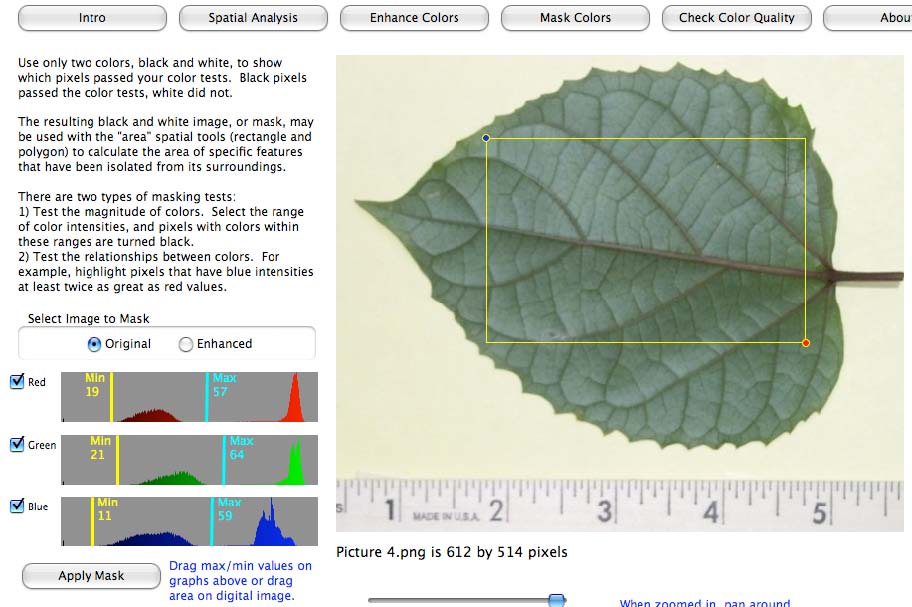
This method provides the most precise area measurement provided the color of the feature is sufficiently uniform and different from the surrounding features.
Selecting a color range or relationship to isolate specific features is called “masking”.
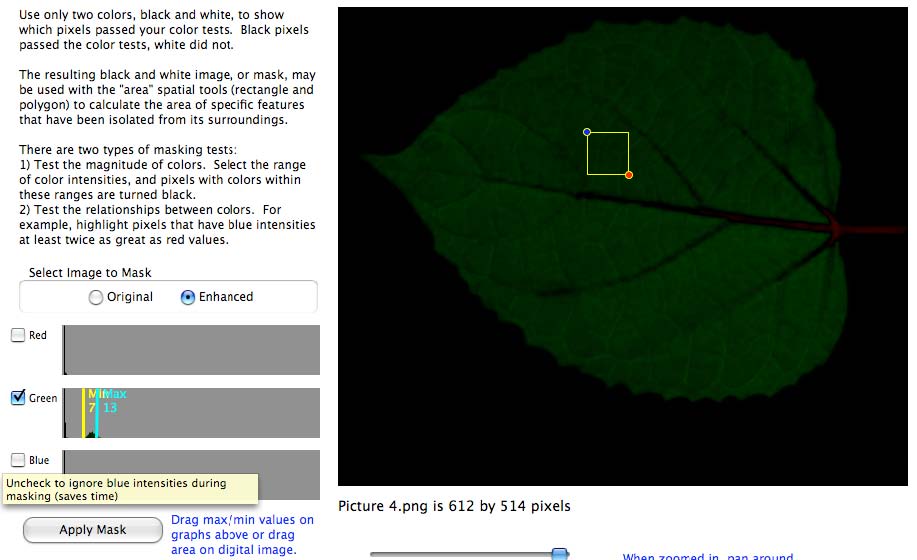
1. To set a color range, go to the “Mask Colors” window and draw a rectangle inside the feature of interest. To adjust the size of the box, click and drag the blue or red corner of the box. The range of colors inside the rectangle is automatically selected.
TIPS:
- To adjust the selected range of colors, click and drag the minimum (min) or maximum (max) lines for red, green, or blue intensities.
- Using the histograms of colors, which represent the frequency of color intensities for the complete image, you may decide only one or two colors are best to use to mask the image.
- To ignore a color during masking, toggle the check box to off by clicking on it.
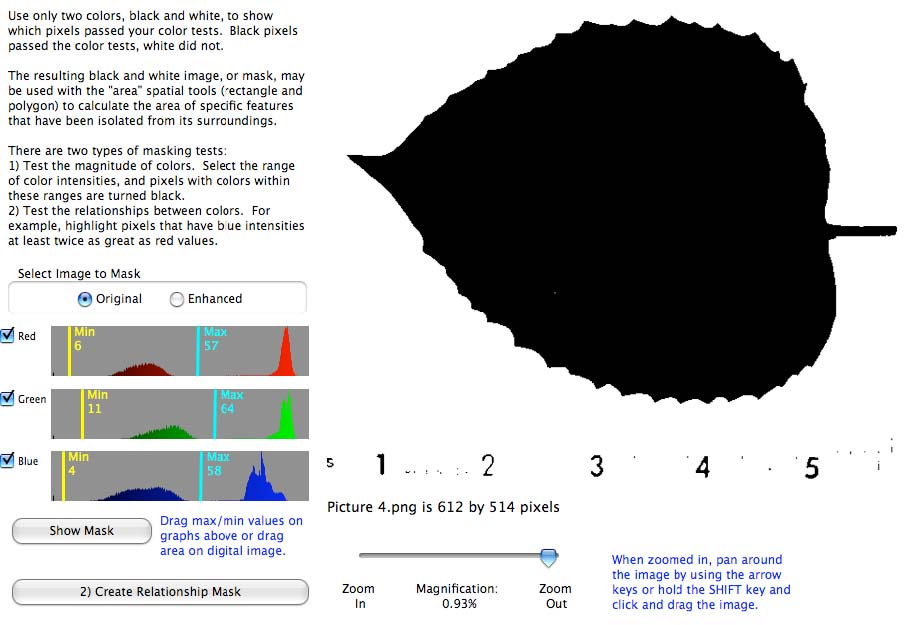
2. Click “Apply Mask” to blacken all pixels with colors within the selected range of colors. Pixels with colors outside this range will turn white.
TIP: To see if the desired feature has been accurately masked, click on the radiobutton labeled “Original”. To see the mask again, click the “Show Mask” button. Compare boundaries of the feature in both images.
3. Another way to mask colors is to create a mathematical relationship between red, green, and/or blue at each pixel. To do this, click the button in the lower left: Create Relationship Mask. Use this feature if the range of colors cannot isolate the desired feature. Note that this option takes much longer to process the image than the first masking option, so be patient when applying.
4. When satisfied that the mask isolates the feature you want to measure, return to the “Spatial Analysis” window and use either the Rectangle or Polygon tool to draw around just the highlighted feature. Notice that the blackened pixels of the ruler are not inside the rectangle drawn below – these will not be counted in the area calculation.
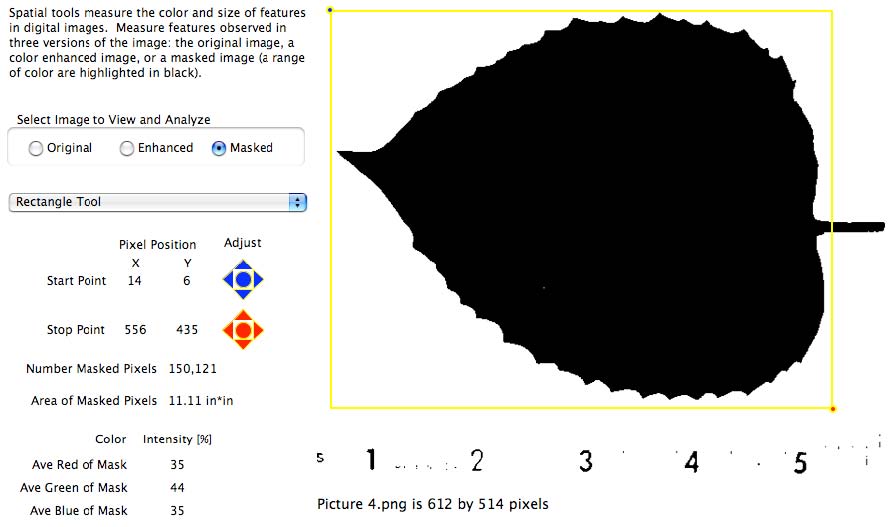
Note that when using the Masked Image (highlighted in this illustration), the area of the masked pixels inside the box or polygon is calculated (the white pixels are ignored). Using the other images, Original and Enhanced, the area tools calculate the area of the total pixels inside the drawn shape.
Comparing the area using the polygon (11.49 in2) and the masking tool (11.11 in2), one would use the masking tool to study daily growth of leaves during the springtime.
Augmenting the Masking Colors by Enhancing Colors First
If it is difficult to isolate the feature from the surrounding colors using the mask tools, use the tools on the “Enhance Colors” window to change the colors of the image prior to using the mask tools. There are two sets of color enhancement options:
- the pre-defined options and
- create your own color alterations.
1. Preset Enhancements
There are 7 preset enhancements to view the digital image, and these are very useful to survey the colors of an image: RGB, Red (gray), Green (gray), Blue (gray), Red v Green (normalized), Red v Blue (normalized), and Green v Blue (normalized)
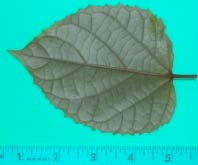
Red-Green-Blue (RGB): Standard color composite of digital imagery in which the color intensities of red, green, and blue are displayed in the computer display’s red, green, and blue, respectively. The image should look the same as the object you photographed.
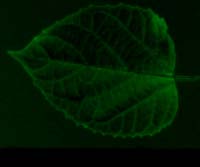
Red, Green, or Blue as shades of gray: Gray shade images allow you to examine the intensities of values without biasing your sensitivity to red, green, or blue. If blue is being displayed as gray (shown in image on right) then high intensities appear white, and low intensities appear black.
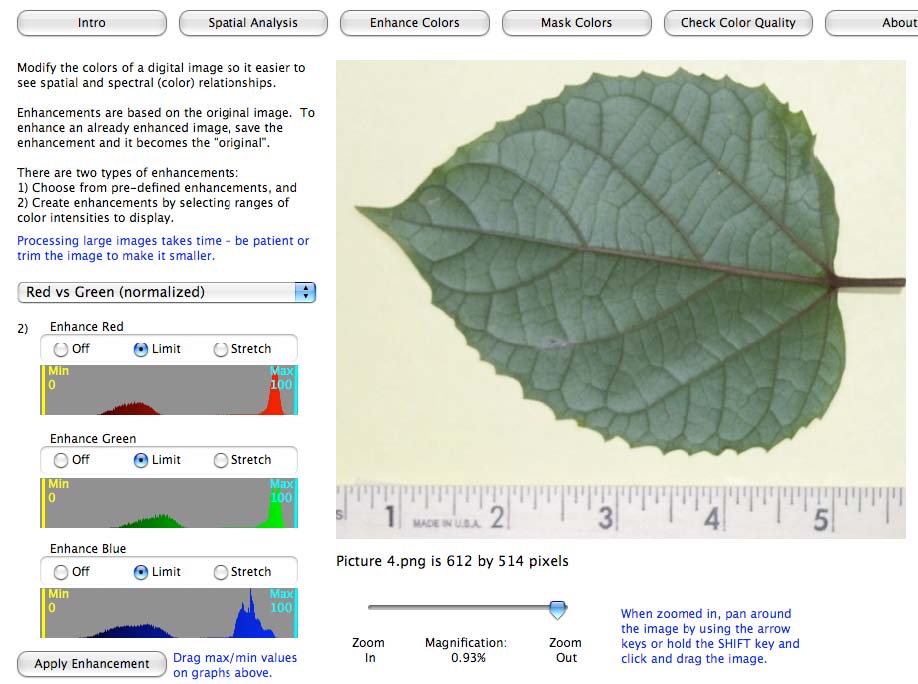
Red versus Green, Red vs. Blue, or Green vs. Blue (normalized): Provides a comparison of two color intensities. The difference of the color intensities is divided by the sum of the color intensities. The displayed color is the greater of the two intensities. Equal intensities are displayed as black. This enhancement minimizes the effects of shadows and uneven lighting across the image.
For example, suppose Red vs. Green (normalized) is selected (shown here). If a pixel has red, green, and blue (RGB) values of 40%, 80%, and 60%, respectively, the difference between red and green is 40% in the green, and the sum of the red and green intensities is 120%. The normalized value will be 40% / 120% or 0.33, which is converted back to percent values of 33% for display purposes. The displayed color for that pixel will be a dark shade of green (RGB values of 0%, 33%, 0%).
Compare these display values to another pixel with a difference between red and green of 40%, but in this case the pixel has RGB values of 0%, 40%, 20%. The normalized difference is 40% / (0% + 40%) which equals 1. This value is converted back to a percentage of 100%. The pixel will be displayed as a very bright green (RGB value of 0%, 100%, 0%).
2. Custom Enhancements
The second option to enhance the colors of an image is to select a range of colors and either limit or stretch this range of intensities.
a. Limiting
Limiting to only that range of selected intensities turns off that color for pixels outside this threshold.
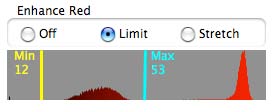
Clicking and dragging the yellow and cyan lines selected the red intensities between 12 and 53. The reds within this range represent the leaf.
By displaying only those red colors within this range (the limit option), the leaf remains the same but the background turns a cyan color because the more intense red values of the background have been turned off.
b. Stretching
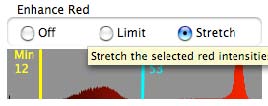
Stretching a range of color produces a similar effect for colors outside the selected range – those colors are turned off, but the selected colors are linearly expanded from 0% for the minimum intensity to 100% for the maximum intensity.
When the same values are stretched, the selected reds in the leaf become exaggerated, changing just the color of the leaf to redder hues.
Turning “off” a color (unchecking the box for that color) speeds up the enhancement processing time since that color will be ignored.
Regardless of which enhancement method is used, the color enhanced image may be manipulated in the masking tool by selecting the Enhanced image button.