
DEW1.2. LEDs As Light Sensors
It is now possible with inexpensive technology to measure the intensity of specific wavelengths of light. Light Emitting Diodes (LEDs) were invented in the 1960s. An LED is a device in which electrical energy is converted into light in a very narrow range of wavelengths. They have been refined over the years, becoming smaller, more intense, and emitting light at a greater variety of wavelengths than ever thought possible.
An LED can also operate in reverse: it can convert light energy of a particular wavelength into electric current. The amount of current is proportional to the intensity of light shining on the LED. The wavelength of light needed to produce this effect is approximately the same as the wavelength of light that the LED normally produces when operating in the electricity-to-light mode, but not identical. An LED that emits red light can actually generate electricity from light in orange wavelengths.
Materials
- Digital multimeter with alligator clips
- 2 LEDs: Infrared (IR) and Red
- Lamp
- Red laser
- Protractor
Part I: Parts of LEDs
Make sketches of each LED from the top and two views from the side (perpendicular to each other). What are the differences and similarities between the two LEDs?
| IR LED | ||
Top | Side 1 | Side 2 |
| Red LED | ||
Top | Side 1 | Side 2 |
The wavelength of light generated by the LED is controlled by the width of the slot in the metal plate (visible from the side views). Light is emitted from the cup at the top of the LED.
Part II: Testing the LEDs
Start with the red LED.
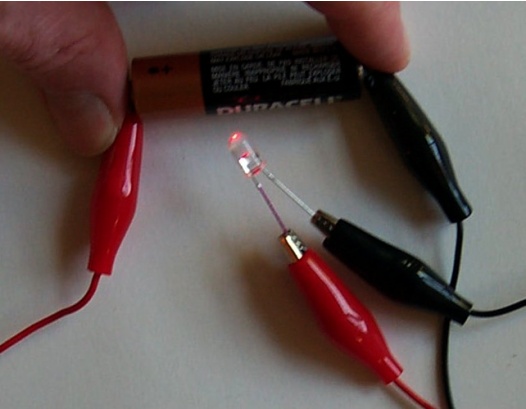
- Connect one 1.5 volt battery to the LED.
- Battery’s positive end connects to the LED’s longest wire.
- Battery’s negative end connects to the LED’s shortest wire.
NOTE: LEDs may be damaged or destroyed by using more than one battery in series or by connecting them in reverse with the positive charge going to the shortest wire of the LED. It is customary to use a red wire to connect to the positive end of a battery and a black wire to the negative end.
When properly connected, red light will be emitted from the LED’s top as in this photo.
Now the infrared (IR) LED.
Repeat the procedure above.
Do you see anything emitted? Does the LED get warm when hooked up? Did the Red LED?
How can we see if the IR LED is working if our eyes do not detect IR light? Fear not: a smart phone camera (or digital camera) comes to the rescue. The sensors in digital cameras can detect IR. Use your smartphone or digital camera with an LCD screen to detect IR. Turn the camera on, point it toward the top of the IR LED after the battery is connected. What do you see?
If you have a TV remote control handy, try pointing it toward your camera and press a button on the remote control. TV remotes work by sending out pulses of IR.
Part III: Measuring Light with LEDs
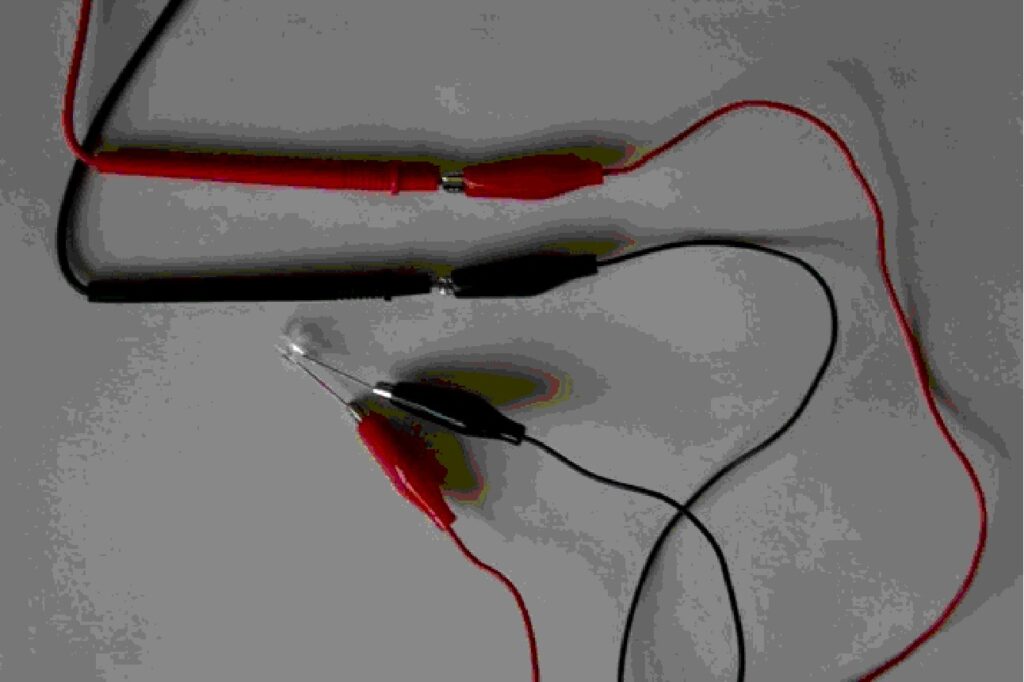
- Connect the red alligator clip from the positive (long) wire of the LED to the red wire of the multimeter. Connect the black clip to other end of the LED and to the black wire of the multimeter. Connect the clip in the same way as the photo in order to minimize the chances of wires touching when using the instrument.
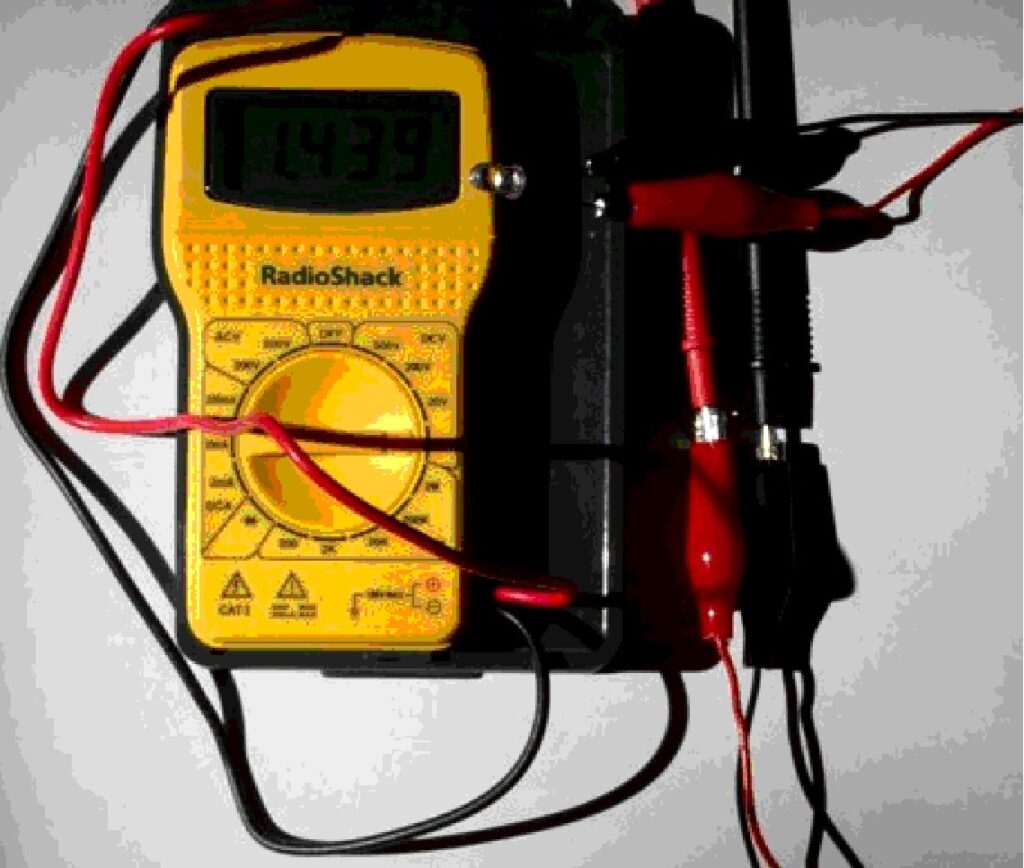
- Turn on the multimeter to the voltmeter that measures up to 2 volts.
- Point top of LED toward a bright light and observe how much voltage the LED creates.
Part IV: Angle of Sensitivity
Using either a light bulb or a red laser, point the top of the LED toward the light source. Slowly rotate the LED to see at what point the voltage on the multimeter drops significantly. Measure this angle for the red LED. If using a red laser, does the IR LED generate any electrical current? Use an incandescent light to test the IR LED.
| LED | Angle of Sensitivity |
| Red | |
| IR |
If you have straws that fit over the LEDs, create a sleeve to let only light hit the top of the LED. Test with the LEDs you just used. Does this affect the angle of sensitivity?
Part V: Measure Light Sources In the Classroom
Locate several different types of light sources in the room, for example, regular light bulbs (incandescent), fluorescent light bulbs, halogen bulbs, the source of light for an optical scanner, LEDs on various electronic equipment. Using either tape measures or the tile on the floor (typically 1 foot squares), systematically record the current generated by several of these light sources from various distances away.
| Light Source | Distance | Voltage from Red LED | Voltage from IR LED |
Although these instruments cannot measure the magnitude of red and IR light being emitted from these light sources, are you surprised at how much IR is given off by light bulbs? IR is heat energy and does not contribute the visible light of a light source. In that sense, IR is wasted energy for a visible light source.
Part VI: Measure Warm and Cool Things
How much IR and red does your hand emit? How about a hot pad? Ice?
Using a box, place a warm or cold source in the box and place the LED into the box with the LED still connected to the multimeter outside the box. Make sure the top of the LED is pointing toward the object being measured. You may need to use tape, string, or wire to hold the LED in place. You could also use a dark closet and have a student hold the LED and another record the observation while standing outside the closet.
Warm and Cold Things
| Object | Voltage from Red LED | Voltage from IR LED |
Although our bodies do emit IR, the wavelengths are in the far or thermal IR region. The IR being detected with these LEDs is in the near IR region, which is generated from very hot light sources. All objects emit light, but cooler objects emit light of longer wavelengths. Hotter bodies emit light of shorter wavelengths. For example, blue stars are hotter than red stars (blue is a shorter wavelength than red).
Part VII: Measuring Reflection, Transmission, Absorption
Although these instruments cannot measure actual light magnitudes, they can be used to measure the percentage of reflectance, transmittance, and absorption of light from an object.
- Determine that the object does not emit light (test in dark room).
- Measure the voltage generated by incoming light (use sunlight).
- Measure the voltage being reflected off the object. The percent of light reflected is the voltage from reflected light / voltage from incoming light.
- If you can get behind the object, say it is a leaf or a piece of paper or fabric, measure the voltage of light traveling through the object. The percent of light being transmitted through the object is voltage from transmitted light / voltage from incoming light.
- Finally, the light being absorbed from the object is:
Light absorbed = 100% – %reflected – %transmitted.
Part VIII: Measuring Reflection of
Land Covers
Go outside with your instruments, preferably on a sunny to partly cloudy day.
First, measure the intensity of the sunlight by pointing the LED toward the Sun.
Do not look directly at the Sun while doing this.
Estimate your pointing by either:
- (a) watching the voltage and moving the LED to find the maximum value, or
- (b) looking at the shadow of the LED on the ground—the smallest shadow of LED will mean it’s pointing directly at Sun.
Second, point your LED at the ground and record the voltage and the surface type. If you have a partly cloudy sky, continue to measure the intensity of sun light before each measurement.
Measure a variety of surfaces. Record your observations and measurements.
Reflection of Land Cover

| Surface Cover | Voltage of Red LED from sunlight | Voltage of Red LED from reflected light | Reflect Red Light [%] | Voltage of IR Led from sunlight | Voltage of IR LED from reflected sunlight | Reflect IR Light [%] |
The LandSat satellite takes pictures of Earth from 920 KM above the Earth. The satellite is detecting reflected light off of the surface of the Earth much the same as you can do using your tools right near the ground.
When scientists compare satellite measurements with measurements from instruments near the ground, this process is often called ground truthing — check on the accuracy of the satellite instruments.
These images below show coal mining in eastern Ohio. In these images vegetation is red, water is black to dark blue, and the mines are bright gray. Federal Law requires the restoration of mined lands to their approximate original contours and that reclaimed land support either the same or better land uses than it supported before mining. To meet this requirement the Muskingum mines, as well as other mines, are replanted to grassland, for agricultural use. The mining company replaces the topsoil, grades the soil, and applies grass seed and mulch.
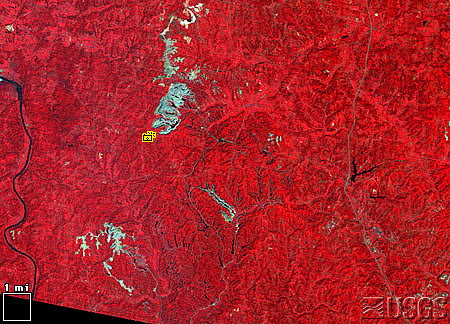
LM1019032007324690 (Landsat 1 MSS, 3 September 1973)
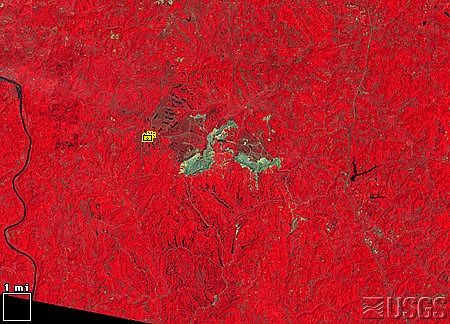
LM5018032008519990 (Landsat 5 MSS, 18 July 1985)
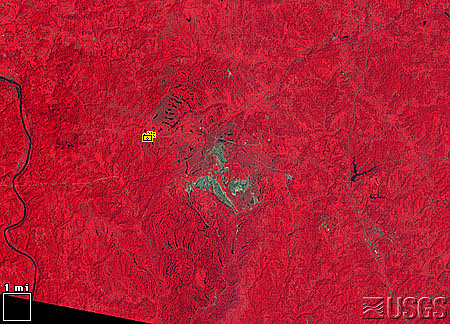
LM5018032009022990 (Landsat 5 MSS, 17 August 1990)
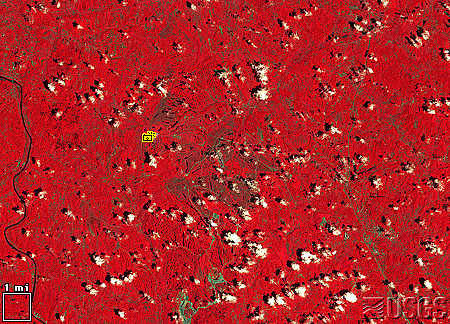
LT5018032009718410 (Landsat 5 TM, 3 July 1997)