
AC7.1. Tracking Jupiter’s Moons
Investigation AC7.1
{ A Changing Cosmos Contents }
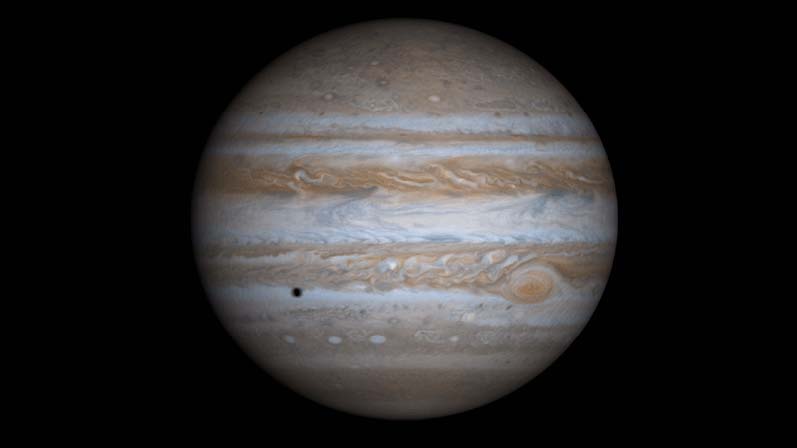
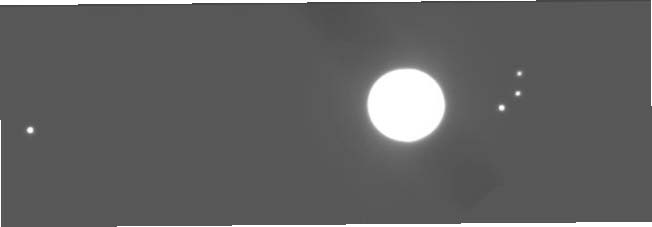
Galileo discovered the four largest moons of Jupiter in 1610, and they are often referred to as the Galilean Moons. He was using a simple telescope and a keen mind.
He noticed that Jupiter and these four dimmer lights, which he assumed were stars, were stretched out along a straight line.When he looked again he saw that the positions had changed from one night to the next, which is not what stars do. After repeated observations he determined that they were moons orbiting around Jupiter.
Materials:
- One of the image processing (IP) apps listed for A Changing Cosmos on the GSS software page.
- Images: use jpeg images from the “7jupitersMoons” folder of the jpg image set for A Changing Cosmos or
- HOU07jupiterMoons7img.zip
(jup1.fts, jup5.fts, jup6.fts, jup7.fts, jup8.fts, jup9.fts, jup10.fts) - and/or HOU07jupitermoons.zip
(jup20020122_0000.fts and jup20020122a through i)
- HOU07jupiterMoons7img.zip
I. Find the Moons
For the simplest option, use the image set HOU07jupiterMoons7img.zip (7 images). The other image set (HOU07jupitermoons.zip) has 10 images and may be used instead of the 7-image set or as a extra set for those who want to see more.
Open jup1.fts and jup5.fts (or jup20020122a and jup20020122b) with the contrast adjusted using Min/Max so that the moons are visible. To help keep track of the moons, refer to them as # 1, 2, 3, & 4, starting from the bottom of the window.
7.3. Record your image settings.
7.4. Which Direction is Each Moon Moving? Make a sketch of the jup1.fts (or jup20020122a) image, or use the Print option in the File menu, then draw an arrow at each moon showing whether it appears to be moving closer to or further away from Jupiter. You can tell by eye which direction the two moons shown closest to Jupiter are moving. A way to answer this question for the other two moons is to compare position coordinates.
There are two ways to find the position coordinates. The first is to hover your cursor over each moon and record the coordinates that appear in the yellow Status bar.
Alternately, you can use the Photometry tool, represented in the toolbar by a circle and dot with 123 over it (you can also access the tool as the “Plugin Photometer” from the Plugins menu). Select the photometry tool and then click on a moon in the jup1.fts (or jup20020122a) image window. The moon’s coordinates and intensity data should appear in the Photometry data window. Using the photometry tool, collect photometry data for all for the the moons. Then, with the “Photometry” data window active, select “Save As…” from the File menu. Give the data text file a name (like “jup1data”) then click “Save.” You can follow these steps to collect the data for jup5.fts (jup20020122b in a separate photometry window, or record the results in the same photometry window.
II. Making a Double Exposure
Adding two images together to make a double exposure is another way to compare the positions of the moons in two images taken an hour apart.
- Starting with jup1.fts (or jup20020122a) as the active window, click on “Image Calculator” under the Process menu. Select jup1.fts (or jup20020122a) as image1 and jup5.fts (or jup20020122b) as image2, then choose the “Add” for the operation from the drop-down menu. Make sure that “Create New Window” is selected, then press OK.
- If you want to save this double image, select “Save As…” from the File menu and enter a new file name including your initials, such as “jup1-5-jd” if your initials happen to be “jd.”
- Use the photometry tool again to find the “Star’s Intensity” and “Sky’s Intensity” for the moons in the third image. Compare these values to the “Star’s Intensity” and Sky’s Intensity” values you recorded from jup1.fts and jup5.fts (or jup20020122a and jup20020122b).
7.5. Adding the two images made the Sky about twice the value in either image. The moons, however, are not twice as bright. Why?
7.6. Which image did each moon come from? Compare moon coordinates in the double image with moon coordinates in one of the single images. Make a sketch or Print out a copy of the double image and draw in arrows from the jup5 position to the jup6 position of each moon.
III. What Happens to the Moons During 6 Hours?
You need to collect data on the positions of each of the moons in each of the 10 Jupiter images, jup20020122a through i taken at 1 hour intervals.
7.7. For each image check the Image Info and record the date and time that the image was taken. Date is day/month/year and time is Universal Time, UT. Make a quick sketch of the image. Universal Time is the time in Greenwich England.
In order to see how each moon moves during the time sequence represented by the six images, combine all six images into one composite image. This may be done in one of several ways:
- by adding all of them together at one time;
- by adding them together one at a time and checking after each addition;
- by subtracting some and adding some.
You may think of some other ways. Try whatever you like.
Once again keep a careful record of all that you do, including the names of the files you create and how you create them. Remember, your goal here is to create an image or images that will allow you to see as clearly as possible how these Moons are moving.
Here are ways to collect moon position data; you may think of more:
- Use the cursor to get the coordinates for the positions of each moon.
- Use the line tool and plot profile tool (On toolbar or under Analyze menu) to get the number of pixels in distance between each moon and the center of Jupiter or between moon positions. Follow the line of the Plot Profile graph with your cursor to to display values for distance along the Plot Profile in pixels and brightness in Intensity values. Corresponding pixel (x,y) coordinates and Intensity values are shown in the yellow Status Bar—be sure you understand the differences between the (x,y) values displayed on the toolbar when you move your mouse over the actual image and the (x,y) values shown on the Plot Profile graph as you move your mouse over the line
- Use the photometry tool to get cursor coordinates for all six positions of each moon, and use the Pythagorean Theorem to compute distances and speed. A hand calculator helps here.
7.8. Make a sketch (or printout, if possible) of your composite image. If you sketch it, please take enough time so that it’s clear to someone else who looks at it. Share your results with other groups around you and see what approach they used that might be different from yours. This is particularly valuable as you begin to answer the questions below.
7.9. Identify on your sketch the orbits in which each moon is traveling by putting the number of the moon at its initial position in jup1.fts (or jup20020122a).
7.10. Which moon(s) appear to be traveling the fastest? Slowest? Does this depend on the portion of the orbit you are examining? Explain your reasoning.
7.11. Record the direction (e.g. left/right or toward/away from Jupiter) and speed of each moon. Your units of speed will be either pixels/hr or mm/hr, depending on your method of collecting the data.
7.12. How do you explain the apparent paradox that, despite the fact that the moons all move at roughly constant speeds around Jupiter in almost circular orbits, your data shows that the speed seemed to change?
7.13. Draw a top view of Jupiter and each moon in its 10 successive positions.
IV. Interpreting Your Data
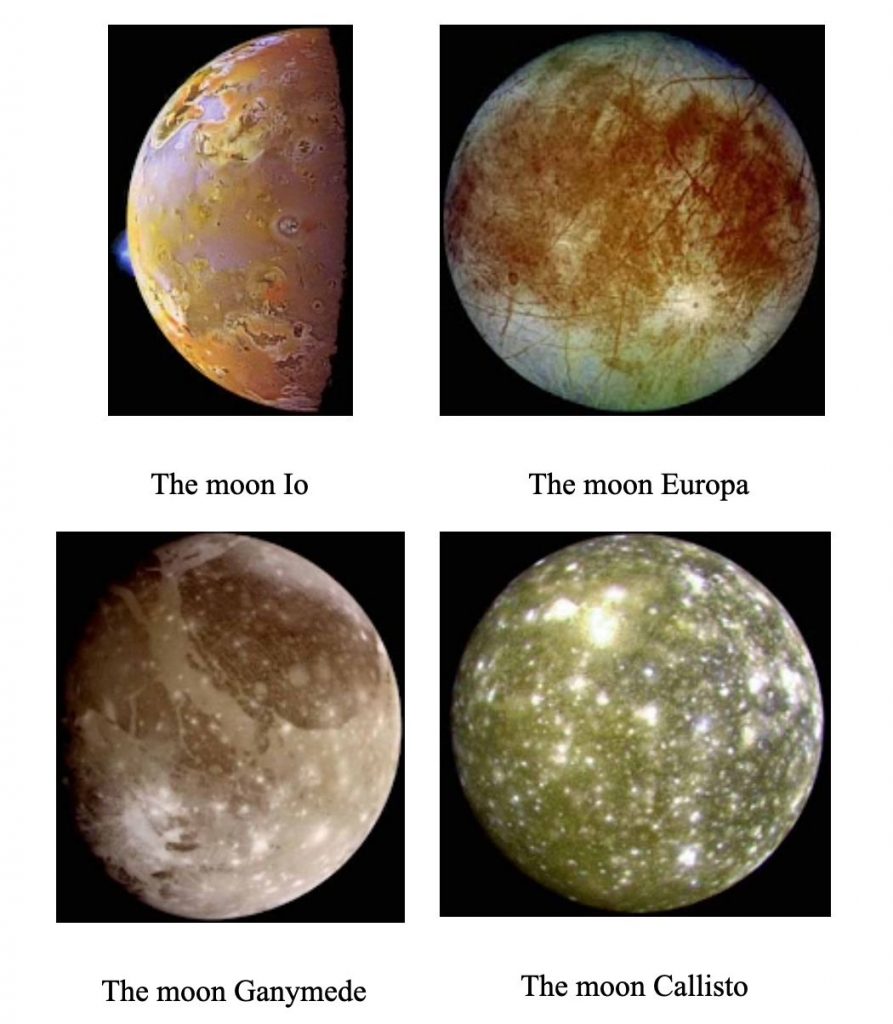
The four moons Galileo discovered in 1610 are named Io, Europa, Ganymede, and Callisto. This table shows the period and orbit radius for each moon. The period is the time for one complete revolution.
| Moon | Period (days) | Orbit Radius (km) |
| Io | 1.8 | 421,600 |
| Europa | 3.5 | 670,900 |
| Ganymede | 7.2 | 1,070,000 |
| Callisto | 16.7 | 1,883,000 |
One more piece of information: the further the orbit from Jupiter, the slower the speed of the moon. This is because Jupiter’s gravity weakens with distance.
7.14. Who Is Io? For each moon, see if you can match the name with its number. Use a process of elimination, crossing out numbers that are not candidates.
7.15. Explain how you decided on the name for each moon.
The Galilean moons
Movie of volcanic eruption on Io:
V. The Mass of Jupiter
By analyzing images of Jupiter and its moons, you can determine values for the variables D and T in the equation below and solve for the mass of Jupiter, MJ.
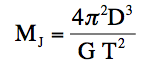
In this equation, D is the radius of orbit of one of Jupiter’s moons and T is the time it takes the moon to complete one orbit (the orbital period). G, the constant of universal gravitation, has a currently accepted value of G = 6.67 x 10⁻¹¹m3/kg-sec2. Note that this equation looks exactly like Kepler’s Third Law, as modified to incorporate Newton’s universal gravitation constant—it applies to any central body that is being orbited by a much less massive object; e.g., The Hubble Space Telescope orbiting the Earth, a moon around a planet, one of the planets around the sun, or the sun around the center of our Milky Way galaxy. In all these cases the mass of the orbiting body is insignificant compared to the mass of the central body, and as you can see, its mass is not even included in the equation. If the mass of the orbiting body were significant, it would be orbiting around a common center, and a different equation would be needed.
Information Box
1 degree = 60 arc minutes: 1° = 60’
1 arc minute = 60 arc sec: 1’ = 60”
1 pixel = 0.63 arcsecs (Plate scale for telescope that took this image)
1 radian = 57.3 degrees = 206,265 arcsec
Distance from Jupiter to Earth in jup5-jup10 images: 6.63(108)km
1 km = 1000 m
7.16. As a practice problem, use the equation above to find the mass of the Earth in kilograms given the following observational data. The period of the Moon around the Earth is 27.3 days and the mean radius of its orbit is 384,000 km. Use meters for the units of D and seconds for T.
Determining the mass of Jupiter
a) You need the distance data you determined in the Tracking Jupiter’s Moons Unit for the images jup5 through jup10. Distances need to be in pixels; go back to the Tracking Jupiter’s Moons Unit and redo this if your original measurements were in millimeters.
b) For each image you also need to know the time of day of the exposure. Use Image Info in the Data Tools menu. Time is given as Universal Time, UT, which is the time at Greenwich, England. Universal Time is based on a 24-hour clock rather than our familiar 12 hour ones.
7.17. Organize your distance and time data in a neat table before you proceed. Call the distances for the moons to the left and below Jupiter in the image negative (-) and the distances to the right and above Jupiter positive (+).
7.18. For all four moons in all the images, plot the pixel distance from the center of Jupiter versus the time the image was taken.
7.19. What does the plot you made above represent?
7.20. Use your plot to estimate the maximum distance for the moon that reaches its turn-around point; i.e., the moon that seems to stop getting further away from Jupiter.
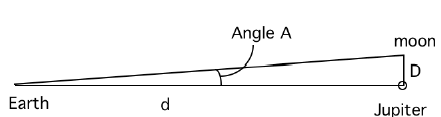
Your pixel distance from question 7.7 can actually be thought of as the angle subtended by imaginary lines connecting Jupiter and its moon. Line D is the radius of the moon’s orbit.
We can use this “pixel angle” to find the radius, D, in km once we convert the pixel value of Angle A to units of radians.
7.21. Convert the pixel value you found above to radians using the Information Box on the previous page.
7.22. Use the Small Angle Approximation (see “Size and Scale of the Sun” ) to determine the radius of the moon’s orbit in kilometers.
D = d x A where D is the radius of the moon’s orbit, d is the distance from Earth to Jupiter at the time the images were taken, and A is the angular distance of the moon from Jupiter in radians.
This is the value for one of the two variables you need in order to solve for the mass of Jupiter. To determine the period of the moon, which is the other variable, T, you need to extrapolate from your data by sketching what you think the graph would look like with data for more hours. Use your extrapolation to estimate the time for one quarter of an orbit and for one half an orbit.
7.23. Use your estimates of time for 1/4 and 1/2 an orbit to determine the period of the moon.
7.24. Estimate how much possible error there is in your value for the period and explain how you made your error estimate.
7.25. You now have the period and radius for one of the moons. Use this information to determine the mass of Jupiter from the equation for MJ. Use meters for the units of D and seconds for T.
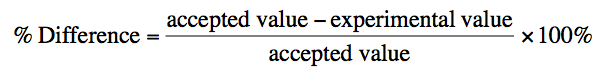
7.26. Find a data table and look up the currently accepted value for the mass of Jupiter. Determine the percent difference between the accepted value and your calculated (experimental) value using the following equation:
Wrap Up:
7.27. Design an experiment that would allow you to obtain a more accurate value for the mass of Jupiter. Be specific.