
AC6.1. Finding Supernovae
Investigation AC6.1
Here are a series of exercises on finding supernovae, starting with simple specially prepared images and progressing to real life image analyses.
Materials
- One of the image processing (IP) apps listed for A Changing Cosmos on the GSS software page.
- Images: use jpeg images from the “6FindingSupernovae” folder of the jpg image set for A Changing Cosmos or
- HOU05supernovae.zip
(includes m51nor.fts, m51fake1.fts, m51fake2.fts, m51fake3.fts, SNW.fts, SNX.fts, SNY.fts, SNZ.fts, m51img1.fts, m51img2.fts, m51img3.fts) - For Part V: HOU05snPartV.zip
(includes snimg1.fts , snimg2.fts, … snimg12.fts)
- HOU05supernovae.zip
I. Comparing Images By Subtracting
Our first exercise uses two images for which Aligning, Subtracting Sky Background, and Normalizing Brightness are not necessary. We will simply compare two images: m51nor.fts, an image of galaxy M51 as it normally appears, and m51fake1.fts which is just m51nor.fts with a “synthetic” supernova pasted into the image—assuring perfect alignment and no need for Sky Subtraction or Normalization. To find the supernova, you can immediately go to step D: find the difference between these two files by subtracting one from another. Then you can locate the supernova in the Difference File. Fake supernovae are used in these first exercises to make it easier to learn to use the image processor tools.
- Open m51nor.fts and m51fake1.fts with the contrast tool adjusted to show the spirals.
- With Image Calculator tool, select m51fake1.fts as Image 1, and select m51nor.fts as Image 2 and “Subtract.” Make sure the box next to “Create New Window” is checked, then click “Okay”.
- With the new image window highlighted, collect data on the supernova’s position and increase in brightness. Use the “Aperture Photometry” tool. Select the photometry tool and then click on a supernova in the new image window. The supernova’s coordinates and intensity data should appear in the Photometry window. Making sure that the “Photometry” window is active, select “Save As…” from the File menu. Give the data text file a name, then click “Save.”
6.1. What is the increase in brightness for the supernova, as read in the Photometry window?
II. Aligning The Images Before Subtracting
Images of a patch of sky may be slightly shifted from one night to the next if the telescope has not been aimed exactly the same each night. Before using the image processing Subtract tool, one of the images must be shifted so the two images “match.” To practice this, use a second faked image: m51fake2.fts.
- Open images m51nor.fts and m51fake2.fts. Adjust the contrast to show the spirals and subtract m51nor.fts from m51fake2.fts as was done in part I, saving the resulting image for later comparison (Question 6.4).
- A reference star is a star that appears in both images. Hover the cursor over a reference star in m51nor.fts and note its (x,y) coordinates in the toolbar. Do the same for m51fake2.fts.
6.2. Record the center (x,y) coordinates of your reference star in each image.
A more accurate determination of x, y coordinates can be achieved using the photometry tool: click on your chosen reference star in each image. You can read the coordinates in the Photometry Window. [Optional: You may also experiment with using “Photometry Settings” if available to set a “Forced Star Radius” to some value such as “10”]
6.3. Because the two images do not match up, you will need to calculate “‘Offset values”—how much to shift x and y in m51nor so it matches m51fake2.
right shift = x(fake image) – x(normal image)
up* shift = y(fake image) – y(normal image).
A negative value means shift left (for x) or shift down (for y).
*since the top of the image corresponds to y = 0,
yet the Translate function (as of 2011) treats “up” as positive,
the y-offset must be inverted.
- To shift the normal image, with no supernova, so it is aligned with the fake image that has a supernova candidate, use “Translation” from the Process menu, enter your Offset values, and click “Okay.”
- Verify that the shifted image lines up with m51fake2.fts by checking that the coordinates of the reference object are the same in both images. If necessary, perform another shift (repeating steps b and c).
- Subtract the shifted image from the fake image.
6.4. What is different between the two subtracted images, the one before aligning and the one after aligning?
6.5. Can you find the supernova? Record the position and brightness data.
III. Adjusting for Brightness Differences
In this section you will learn the two operations you must perform to correct for whole image brightness differences: Sky subtraction and Normalization.
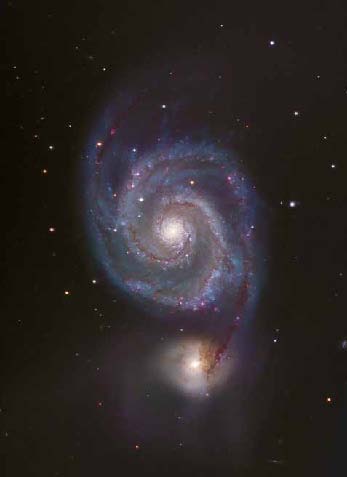
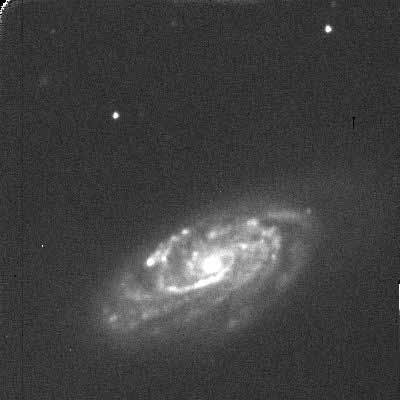
Image of M51 from Ewell Observatory, Belmont, CA.
- a. Open images: m51nor.fts and m51fake3.fts. Adjust the contrast to show the spirals by clicking on “Auto” in the “Brightness and Contrast” window.
- b. To be able to see how important the brightness adjustment steps are, subtract m51nor.fts from m51fake3.fts, without any brightness adjustments, and click on Create New Window. Keep this image to compare with your result after the brightness adjustments.
- c. Use the photometry tool to find the brightness of the background sky. Click on the photometry tool (123). Place the cursor over a reference star (a star that appears in both images) and click. Then place the cursor over the same star in the other image and click. Record the Star’s Intensity and Sky’s intensity for this star in each image. You can also scroll over dark portions of the sky and from these values get a sense of the average value of Sky’s Intensity.
[Optional: you can record the photometry data by clicking on the “Photometry” window and selecting “Save As…” from the File menu. When you open that saved file with a spreadsheet program, you may need to specify that data is tab-delimited for it to display properly as a table.]
Subtract sky value from the two images
- d. Clear the selection circles by clicking on the Clear Photometry icon in the toolbar. Make sure you have saved the data in the Photometry data box, because the “Clear Photometry” button will clear that data also. Then close the photometry tool by closing the Photometry data box.
- e. Select the “Single Image Operator” > “Subtract…” from the Process menu. Enter the sky value for that image, then click “OK.” Do the same steps for the other image using its sky value. If you cannot see anything in your image after using the subtraction operation, try adjusting the brightness and contrast again.
Adjust brightness (normalization) in the two images.
- f. Use the reference star values you recorded using the photometry tool in Step C to calculate the Normalization factor, N. This is the ratio of brightness of the reference star in the two images: m51nor.fts and m51fake3.fts. Calculate the ratio of larger “Star’s Intensity” value to the smaller “Star’s Intensity” value.
- g. Select the image with the smaller “Star’s Intensity” (in this case, m51nor.fts). Then select the “Single Image Operator” from the Process menu. Select “Multiply,” enter the value of N, then click “Okay.”
- h. Subtract this normalized image from the m51fake3.fts image (with sky removed).
6.6. What is different between the two subtracted images, the one before adjusting for brightness (the image from Step B) and the one after adjusting for brightness (the image from Step I)?
6.7. Can you find the supernova? Record the position and brightness data.
IV. SN1990H
Now look at a series of images of a galaxy to detect the presence of a supernova. The supernova is SN1990H, which was the 8th one discovered in 1990 (H is the 8th letter of the alphabet). The images were taken at two week intervals in the Spring of 1990.
IV-1. What can you tell by looking at a single image?
Open SNW with the contrast adjusted using Min/Max to bring out the spiral arms of the galaxy. Can you tell if there is a supernova? Supernovae are very bright objects, sometimes brighter than an entire galaxy. In this image, there are five or six very bright objects – are they all supernovae? Not likely. Objects that are also typically very bright include the galaxy core and foreground stars in our own Milky Way galaxy that lie in the same line of sight as the far off galaxy. For most galaxies, we never see single stars within the galaxy from ground-based telescopes — supernovae are the one exception.
Galaxy cores and nearby stars tend to keep on being bright. A supernova, on the other hand, changes brightness over time, flaring up and then slowly fading over a period of a couple of weeks to a couple of months.
6.8. Write down the coordinates of objects you think are likely candidates to be SN1990H.
IV-2. What can you tell by looking at four images?
Open SNW.fts, SNX.fts, SNY.fts and SNZ.fts with the contrast adjusted to bring out the spiral arms in each galaxy. Drag the image windows around until you can see all four images at once.
6.9. Which bright object is the supernova? Write down its coordinates—note which image your coordinates refer to. Is it the one you guessed?
6.10. The images are out of order, in terms of when each was taken. What do you think is the proper order of W, X, Y, Z? Explain your answer.
IV-3. Subtracting Images To Find a Supernova.
You did not need to use more refined tools to discover SN1990H because it stands out when you see all four images.
However, that is not always the case. Now try the A, B, C, D process on these images—Align, Subtract Sky, Normalize, and Subtract Reference Image.
In order to make comparisons there needs to be both a Reference Image and Reference Star. A Reference Image is one without a supernova. Use SNX.fts as the Reference Image. A Reference Star is a steady star, i.e. one with constant brightness. Choose one of the bright objects outside the galaxy that is presumably a foreground star in our Milky Way galaxy as the Reference Star.
6.11. Which star did you choose as your reference star?
A. Align the Images:
- Get the coordinates for a Reference Star using photometry function.
Do this for the same star in each image. - Record the x, y coordinates as well as the “Star’s Intensity” Photometry data either by copying the numbers to a table or using “Save As” in the File menu.
- Use Translation in the Process menu to match all images to the Reference Image, SNX.fts.
Enter X and Y Offset values so that your Reference Star’s pixel location will be the same as its location in SNX.fts. Be careful of the y-offset: the Translation function is inverted from the actual y values since y=0 is at the top of the image.
B. Remove the background skylight:
- For each image, select “Single Image operator” > “Subtract” from the Process menu, and use the photometry data “Sky Intensity” for that image as the value to subtract from the image
- If necessary, adjust the Brightness and Contrast again so that the image features are clear.
After the subtraction the Sky’s Intensity value should be 0 in each image.
C. Normalize the Images (correct for differing observing conditions, high haze, variation in exposure time):
Using the the Star’s Intensity” in the Photometry data you recorded (or saved), calculate the Normalization Factor for each non-reference image
(brightness of reference star in reference image)
(brightness of reference star in new image)
6.12. What normalization factor did you compute for SNY? SNW? SNZ?
With the new image highlighted, go to the Process menu, then select “Multiply” from “Single Image Operators.” Enter the value of your Normalization Factor. This should make the brightness of the Reference Star the same in each image. Other objects should also have roughly equal brightness, except for the supernova, which is new.
D. Subtract Images:
- With the new image window highlighted, subtract the Reference Image from the new image using Image Calculator in the Process menu.
- Make sure the box next to “Create New Window” is checked.
- Adjust the contrast — you should be able to bring out a “lumpy” detail of black and white spots. Variations within each image account for why the subtracted image is not all blank except for the supernova.
Look for a Supernova: Identify any new sources of light using the photometry tool.
6.13. Record the brightness of the supernova for each image.
6.14. Graph the brightness of SN1990H over time.
This plot is called a light curve.
Plot these dates along the x-axis:
SNY: 1990/04/19
SNW: 1990/05/02
SNZ: 1990/05/17
SNX: 1990/06/02
and the brightness values from 5.13 along the y-axis.
SNX was taken after the supernova had died out.
Give it a brightness value equal to 0, which relative to its supernova brightness is a reasonable value.
Sketch a curve to connect the points.
V. Light Curve for SN1994i
In the spring of 1994 several HOU students were studying M51, the spiral galaxy also known as the Whirlpool Galaxy. In early April, two girls at Oil City High School in Pennsylvania received an important phone call. They had serendipitously obtained the first images of a supernova in M51.
The brightness of the supernova increases dramatically and then fades off until it is no longer visible. The rate at which the brightness increases and then fades is an indicator of what type supernova has occurred and what type of star is involved.
Use images taken by HOU students to create and study a plot of the brightness of a supernova as it changes over several weeks.
You’ll choose a reference star and use the A, B, C, D steps described earlier.
• Open m51img1.fts, m51img2.fts, and m51img3.fts.
These are images of M51, the whirlpool galaxy. Scott Miller, an HOU student at Oil City, Pennsylvania, requested the first image of M51, m51img1.fts, on February 12, 1994. The core of the galaxy (that is about as bright as a million Suns) is the bright spot near the bottom of the image. The bright spot near the top is a companion galaxy.
Heather Tartara and Melody Spence, Scott’s classmates, requested the second image, m51img2, on March 31, 1994, to further study the galaxy. Heather and Melody received some surprising news soon after obtaining their image. The image m51img3 was requested by Vincent Prosapio, an HOU student at Alan B. Shepard High School in Palos Heights, IL, on April 7, 1994.
• Adjust the Min/Max on the images to see more detail within the region of the core of M51 and try to find what all the excitement was about. It may be quite tricky.
6.15. Use drawings and words to compare the three images.
6.16. Approximately how many times brighter than the Sun is the supernova?
Use the photometry tool to compare the brightness of the supernova to the core of the galaxy. Click on “Photometry Settings.” Change “Star Radius” and “Sky” from Auto to Forced. Enter in 7 for Star Radius and 14 for Sky Radius.
6.17. Use a new image of M51 requested by your class from a remote telescope or another recent image of the galaxy. Compare the new image to the images from Spring of 1994. Describe your findings.
• Open images snimg1.fts through snimg12.fts. It is probably easiest to use one image at a time and repeat the procedure below for each one.
These twelve images of the supernova were taken in April and early May of 1994. The date of observation and other information are listed under Image Info (With the image highlighted, select “Show Info…” from the Image menu). To create a light curve you must use only images through the same filter. All these images were taken through the I filter, which lets through infrared light.
- Find the night number by looking in Image Info and counting the number of days between the observation date and March 31, 1994.
- Use the bright star at approximately 45° to the lower left of the galaxy core as a reference star. You may use the photometry tool to measure the “Star’s Intensity” counts for the reference star. You can adjust the photometry setting to define the region for measuring the brightness of the supernova, since it is so close to the center of the galaxy.
- Divide the intensity values for the supernova by the intensity value of the reference star to get the Count ratio for each night. (See the Photometry Techniques Discussion Sheet for more about the Count ratio, BSN/BR as a measure of brightness changes.)
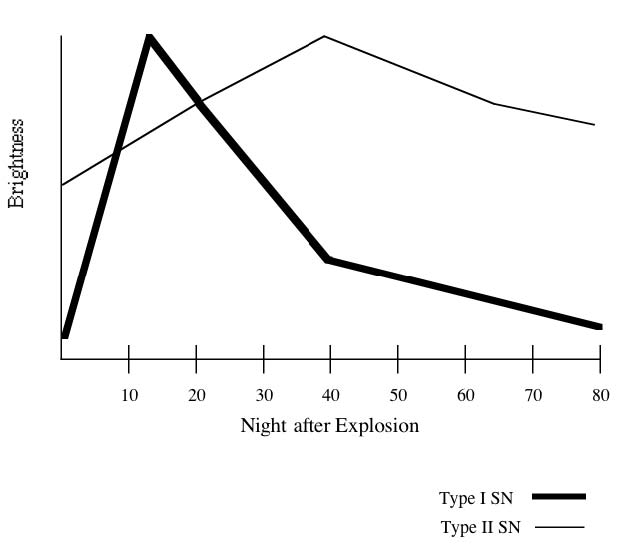
6.19. Compare your light curve with those on this page and infer the type supernova for SN1994i.