TG Life and Climate
{ GSS Teacher Guide Index } { All GSS Books }

{}
Objectives [] Assessment
Guides for each Chapter:
1 – 2 – 3 – 4 – 5 – 6 – 7 – 8 – 9 – 10 – 11 – 12 – 13
Teaching Objectives
Life and Climate is about how our atmosphere and climate came to be as they are today; how life on Earth evolved; and how the evolution of life and climate have affected each other since the Earth was formed. In this Guide your students will find the story of how tiny plants brought oxygen to Earth’s atmosphere; and how changing climates may have brought about the evolution of our human ancestors in Africa five to seven million years ago. They will construct timelines, and find out how we know where to place milestones in the development of life. They will learn about the gradual acceptance of tectonic plate theory, and how the movement of tectonic plates is now thought to cause the climate changes that affected the evolution of life. In the laboratory, your students will experiment with dissolving rocks to explore the long-term carbon cycle, which has contributed to the long-term stability of Earth’s climate. In the final chapter, they will consider what Earth’s past can tell us about its future.
The importance of the history of our planet’s climate history and the evolution of life in the high school curriculum is clearly and thoroughly described in the National Science Education Standards, from which the following quote was drawn.
“In studying the evolution of the Earth system over geologic time, students develop a deeper understanding of the evidence, first introduced in grades 5-8, of Earth’s past and unravel the interconnected story of Earth’s dynamic crust, fluctuating climate, and evolving life forms.”
— from 9th-12th Grade Standards, Earth and Space Science, National Science Education Standards, National Research Council, 1996, page 188. Teaching Objectives
The four goals for the unit Life and Climate,
and the objectives which support these goals are summarized on this page.
Goal 1: Students will recognize that today’s climate and life evolved over billions of years.
Specifically, they will know that:
- Objective 1A: 4.6 billion years ago the sun, Earth, and the rest of the solar system formed from a nebular cloud of dust and gas.
- Objective 1B: 4.3 billion years ago the early Earth was very different from the planet we live on today. A solid surface was beginning to form, but there was no oxygen in the air and no ocean.
- Objective 1C: 3.9 billion years ago the first ocean formed and started to absorb carbon dioxide, cooling the planet.
- Objective 1D: 3.5 billion years ago the earliest life forms for which we have evidence were a kind of bacteria known as blue-green algae. Mats of these algae formed stromatolites that survived as fossils.
- Objective 1E: 670 million years ago marked the beginnning of multi-cellular life forms, possibly due to increased oxygen in the atmosphere.
- Objective 1F: Geologic time can be estimated by a variety of methods: observing rock sequences, using fossils to correlate the sequences at various locations, analyzing pollen and spores, drilling cores from glaciers and the sea floor, and using the known decay rates of radioactive isotopes in rocks.
Goal 2: Students will learn about how life has affected climate and how climate has affected life. Specifically they will understand that:
- Objective 2A: Blue-green algae, the first life forms we know of, enriched Earth’s atmosphere with oxygen.
- Objective 2B: Eventually enough oxygen built up in the atmosphere for multicellular life to evolve.
- Objective 2C: Earth’s changing climate continued to determine which life forms would survive to reproduce and which would not.
- Objective 2D: Over the past 5 million years or so changing climates have contributed to the evolution of humans.
- Objective 2E: Over the past 150 years, humans have increased the concentration of carbon dioxide in the atmosphere, causing the climate to become warmer.
Goal 3: Students will be able to distinguish between natural and man-made climate changes. Specifically they will understand that:
- Objective 3A: Earth’s slowly changing relationship to the sun, and the longterm carbon cycle have brought about natural changes in climate.
- Objective 3B: The concentration of carbon dioxide in the atmosphere is increasing as a result of widespread burning of fossil fuels in cars, homes, and factories. The result is a manmade climate change.
Goal 4: Students will understand that small changes can result in major climate shifts.
- Objective 4A: Students find that the geologic record indicates that the global temperature has fluctuated within a relatively narrow range that has enabled life to survive and evolve for over three billion years.
- Objective 4B: Students learn that changes in the average global temperature of just 5° or 6°C have produced such dramatic effects in the Earth system as the ice ages and the extinction of entire species.
Objectives [] Assessment
Guides for each Chapter:
1 – 2 – 3 – 4 – 5 – 6 – 7 – 8 – 9 – 10 – 11 – 12 – 13
Assessment Tasks
On the following pages are four assessment tasks: Portfolios, Questionnaires, and a culminating project called the History of Earth Museum. These three tasks include both traditional to nontraditional ways of assessing student progress. A Portfolio is a collection of student work selected by the students to illustrate what they’ve learned and accomplished during the entire course. The Questionnaire is a traditional way to assess students’ knowledge about the history of life and climate that they gained from the unit. The History of Earth Museum project is a research project. While it does not reveal what students know “on demand,” it establishes what they have learned given time to reflect on the unit and describe their ideas in writing. Following is a fuller description of each of these assessment tools.
1. Portfolios
We especially encourage the use of portfolios as a means of providing feedback to students and to demonstrate evidence of student progress to parents. A portfolio is a display of representative work selected by the student to illustrate what he or she has learned and accomplished during the course. Students may be encouraged to revise work created earlier to reflect more recent understanding, or a commitment to highquality work. Portfolios for A New World View might include some or all of the following:Chapter 1 Short essay interpreting the cartoon on the first page
• Answers to the investigation questions: Can You Observe the Effects of Air Pressure?
• Results of the Home Investigation: A Scale Drawing of Our PlanetChapter 2 Students’ reflections on the Timeline Activity
Chapter 3 Answers to investigation questions: Simulating Half Life
Chapter 4 What is Life? List and reflections
• Answers to: Where do you think life originated?Chapter 5 List of students’ questions about this chapter
Chapter 6 Essay about why live evolved so slowly at first
Chapter 7 Investigation: Observing Convection Curents
Chapter 8 Story about the life of a carbon atom
• Investigation: Dissolving RocksChapter 9 Your observations of a student debate
Chapter 10 Questions about Vostok ice data
Chapter 11 Students’ responses to this chapter
Chapter 12 Reflections on “The Importance of Language”
• Hypothesis on “How did the Eskimos survive?”Chapter 13 Responses to questions about graphs
• Students’ individual projects
2. Questionnaires
While it is not important that students learn hundreds of terms and detailed facts, some factual knowledge about the key developments in the evolution of life and climate are important for students to know. This knowledge can be assessed in a number of ways including a questionnaire.
The questionnaires that students’ complete before beginning the unit will help you diagnose their needs and adjust your plans accordingly. Comparing these papers to the students’ responses on the same tasks after completing the unit will allow you to determine how your students’ understanding and attitudes have changed as a result of instruction.
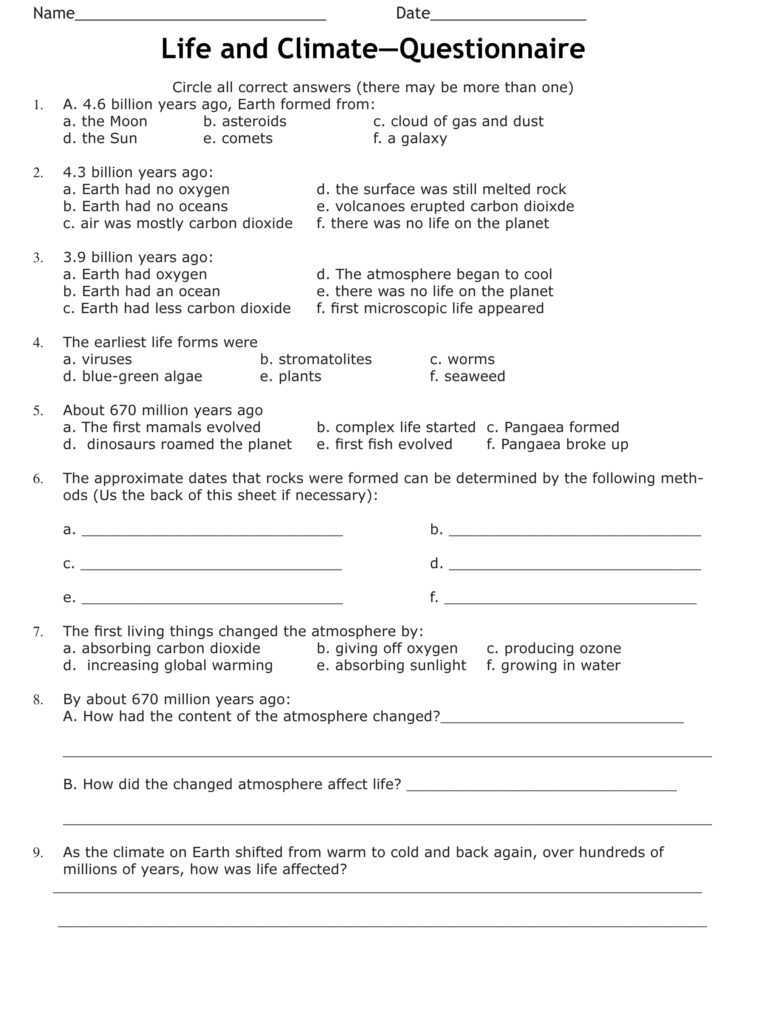
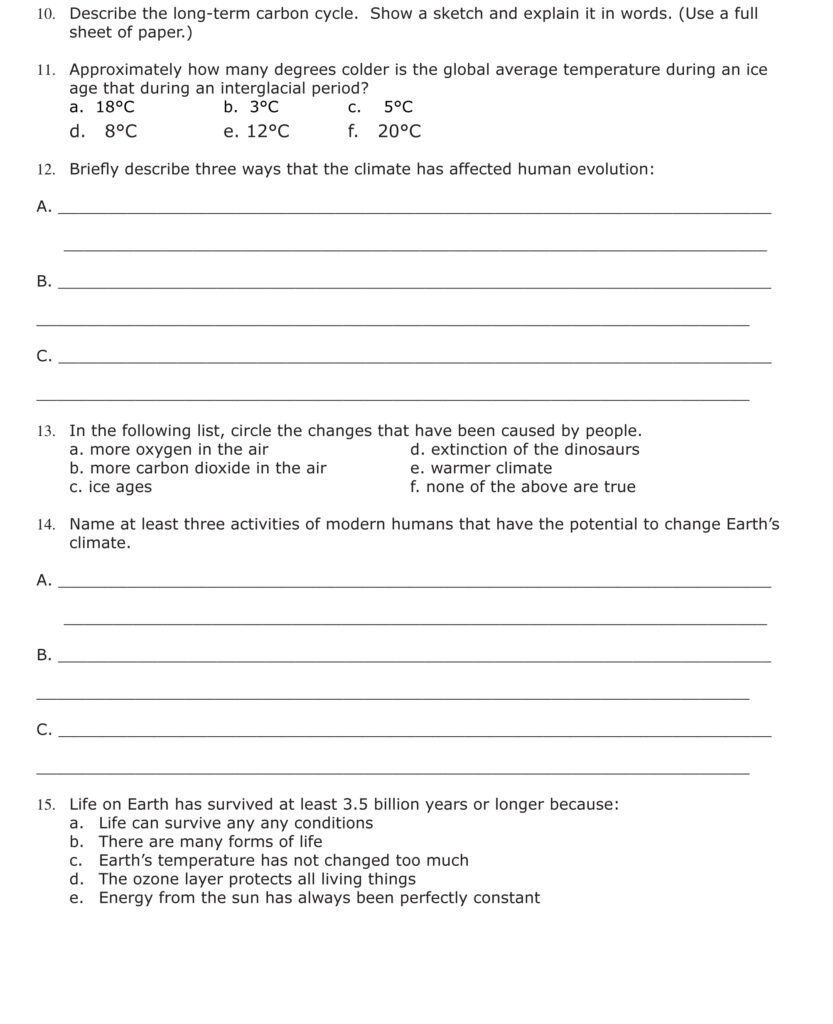
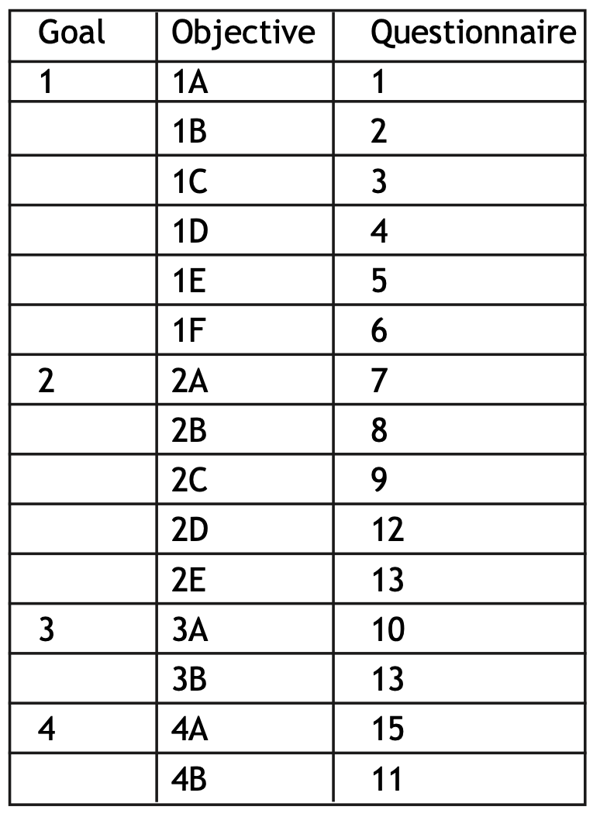
Questions correspond to the objectives as follows:
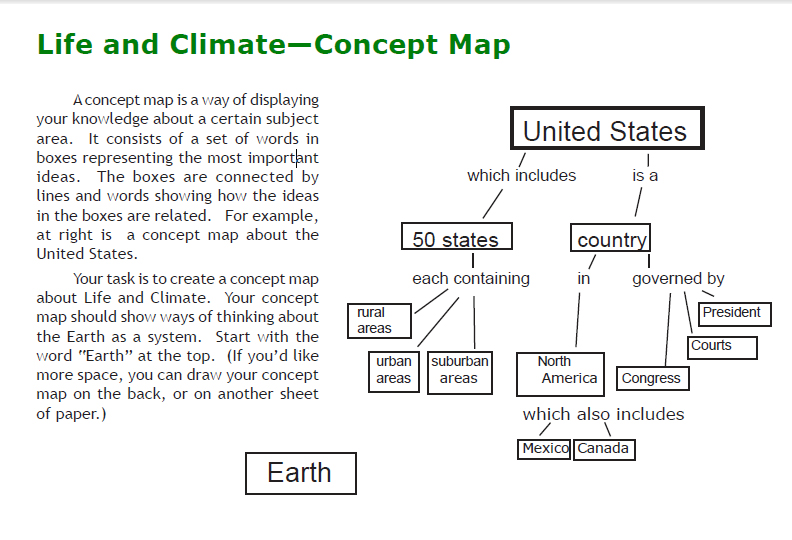
These two tasks fall along a spectrum from traditional to nontraditional ways of assessing student progress. The Questionnaire is a traditional way to elicit student understanding. It assesses students’ abilities to express themselves as well as insights that they gained from the unit. The Concept Map is nonlinear. Students do not need to think in terms of sentences and paragraphs, and their ideas can flow more freely. Students who are more visual might be better able to show what they know on this task than on the Questionnaire.
3. Concept Maps
Asking students to create a concept map before and after the unit is one way to determine which concepts they have learned and their understanding of the connections among these concepts. If students have not had experience in concept mapping, you might want to start them out with a handout showing an example (master on p. 10), a general idea of what they are to map, and starting word(s) to help get them started. Once they have had experience with concept maps, they can create them on blank sheets of paper (no photocopying required). Alternatively, they can use concept mapping software such as
- Inspiration (http://www.inspiration.com)
- Decision Explorer (http://www.banxia.com).
- CMap (http://cmap.ihmc.us/conceptmap.html – free for noncommercial use).
- Omnigraffle (http://www.omnigroup.com/applications/ omnigraffle Mac OSX)
- Freemind (http://freemind.sourceforge.net/wiki/index. php/Main_Page – open source software for mindmapping.)
- Microsoft Draw (comes with Microsoft Office)
Some possible key words to use: climate, evolution, gas, tectonic, plate tectonic, greenhouse, radioactive, atmosphere.
The History of Earth Museum
The History of Earth Museum project is best assigned towards the end of the unit, as a means for the students to synthesize what they have learned, and reveal their understanding in their own terms. The assignment is as follows: Imagine that you work in a new museum called the “Museum of the History of Earth.” It is your job to plan the contents of 1,000 dioramas, each representing 4.6 million years of Earth history. Each diorama should illustrate something about what Earth is like during that period, and what life forms my have evolved by then. Of course, you do not have to plan every single diorama in detail, a few samples will do. Provide enough information, in drawings and words, so that we can envision what the entire set of 1,000 dioramas would be like.
Following is a paper written by a Peter Epstein, a high school student, who undertook this project.
1,000 Dioramas by Peter Epstein
I set out to create a model for “The Museum of the History of Earth.” The idea of this imaginary museum was to create 1,000 dioramas, each representing one thousandth of Earth’s 4.5 billion year history, or 4.5 million years. I researched important events in Earth’s history that would be represented in these dioramas and collected pictures to use in making a model of the Museum.
The first thing I noticed in my research was how differently the Museum of the History of Earth would represent the length of time since Earth’s beginning from the way the system of eons, eras, periods, and epochs we normally use in studying Earth’s history does. With 1,000 equal divisions of Earth’s history, I could clearly see how long ago each event I researched took place in comparison with other events and with Earth’s history as a whole. Unlike the traditional system, the 1,000 equal divisions showed how long the length of time since the Earth formed until the present really is. If you ask a teenager to name something that happened a long time ago, he might first mention his earliest memory, maybe fifteen years ago. If you asked him to mention something that happened a long time ago in history, he might mention an event in an ancient civilization, at most 10,000 years ago.
The two events might seem like a “long time ago” in normal terms, but each occurred within the last one percent of the last of the 1,000 dioramas in the Museum of the History of Earth. Even the extinction of the dinosaurs, 65 million years ago, an event that most people would consider very long ago, would fall in the 986 th diorama. By dividing Earth’s history into 1,000 equal parts, it was possible to see just how small a percentage of it we usually study and think about.
During the course of my research, I tried to focus on the huge amount of time before the commonly studied events of Earth’s history. Multi-cellular life first appeared on Earth about 700 million years ago, in around the 845th diorama. I knew what could be represented in the 155 dioramas that followed: the evolution of the first vertebrates, the appearance of reptiles, the dinosaurs, primate evolution and so on. I researched these events and placed them in their proper dioramas; however, I also had the 845 dioramas before multi-cellular life forms, and I did not really know anything about what had happened during that time period. I soon realized that these first 845 dioramas would be pretty boring. Before multi-cellular life, the only living organisms were simple bacteria and algae-like life forms, and they changed relatively little from their first appearance, about 3.8 billion years ago, to the appearance of multi-cellular organisms, about 0.7 billion years ago.
The lack of diversity in life before diorama 845 did not mean that there was absolutely nothing to represent in the early dioramas. In addition to a few developments in life forms, there were many changes in non-living parts of the planet. Changes in the composition of the atmosphere, the temperature, the position of the continents, and other geological changes occurred throughout the early dioramas, and continued after the evolution of multi-cellular life. My research showed me that the non-living history of the Earth is less well studied than the biological history. When I began my project, I was focusing primarily on changes in life forms and events concerning living organisms, but I realized that geological and atmospheric events should be represented in dioramas as well.
The Museum of the History of Earth would be very hard to create in reality. Finding something to represent in each diorama would be impossible, especially for the first 845 dioramas. In my research, the majority of the events I noted and the pictures I collected was from the final 155 dioramas, even though I had specifically tried to focus on the earlier, unstudied time periods. I found only fifteen pictures to represent events from the 845 dioramas before multi-cellular life.
Still, creating a representation of the Museum was very useful. Dividing Earth’s history into 1,000 equal parts is very helpful in showing the relative duration of time periods and the age of events. Also, trying to find events to represent in the earlier dioramas helps to introduce usually unknown, non-living aspects of Earth’s history. The idea of the Museum of the History of the Earth would help high school students to understand Earth’s history in ways that the normal system of time periods does not.
Objectives [] Assessment
Guides for each Chapter:
1 – 2 – 3 – 4 – 5 – 6 – 7 – 8 – 9 – 10 – 11 – 12 – 13
Guides for Each Chapter
Before you start
- If your students have previously studied the GSS unit Changing Climate, then they will know quite a bit about global warming, and they are likely to have many thoughts about the cartoon at the top of page 2. However, if your students have not previously studied the theory that our planet is gradually warming, possibly as a result of human activities, you will need to provide some information about it before they begin.
- Invite students to bring in news clippings about past climate changes—such as previous ice ages, or the very warm period during the Cretaceous, when dinosaurs were the dominant life form on Earth. Put these on a bulletin board, organized by topic. Encourage discussion about these articles when students bring them in, and post them on a bulletin board, organized by historical epoch, for students to refer to throughout the unit.
- Prior to the first class session, locate a clear glass bowl and a glass tube to demonstrate the “barometer effect,” as described below. If you have enough glasses and bowls and a source of water, small groups of students can do this as a hands-on activity. If there is no sink in the classroom you may need a basin to catch spills and a pitcher of water.
Guide for Chapter 1
Discovering the Atmosphere
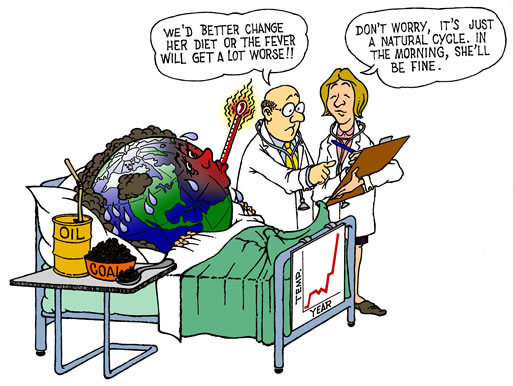
As either a class assignment or homework assignment ask the students to read “What’s this book about?” and to write a short essay about the cartoon in the introduction. The essay should represent their own opinions in answer to the question: Is the reason that Earth’s average temperature has warmed by about 1°C in the past century primarily due to human activities or natural causes? Ask them to explain the bases for their opinions. You may wish to tell them that there is no absolute right or wrong answer. What you are looking for is the evidence and logical thinking that they use in support of their opinions.
It may be a surprise to your students that there was a time when people were not aware that Earth has an atmosphere. The point of telling the story of how the atmosphere was discovered is three:
- to set the stage for the rest of the book;
- to introduce the concept of higher atmospheric pressure at sea level; and
- to communicate the nature of scientific reasoning and experimentation through this very important historical example.
The value of such examples is described in the National Science Education Standards as follows:
“The historical perspective of scientific explanations demonstrates how scientific knowledge changes by evolving over time, almost always building on earlier knowledge.”
— from 9th-12th Grade Standards, National Science Education Standards (NSES), National Research Council (NRC), 1996, page 204.
The concept of atmospheric pressure is not easy for students to grasp. Air seems so insubstantial, and we’re so used to its presence, that it is hard to imagine that it can exert pressure on us. However, the finding that air pressure is lower at higher elevations is the first piece of evidence in support of the idea that our planet is surrounded by an envelope of air; and the complementary idea that air does not extend very far into space, to the moon and stars.
Before having your students read 1-I. The Concept of an Atmosphere, you may want to demonstrate how a barometer works. It is too dangerous to demonstrate with real mercury, since the liquid metal is toxic. However, you can illustrate the principle with a glass bowl and glass tube, closed at one end. (You can use a test tube, but a taller glass tube is easier for students to see.) Fill the bowl about half-way with water. Fill the tube with water and put your finger over one end. Turn the tube upside down, and place the open end under the surface of the water in the bowl. Ask the students what they think will happen when you remove your finger. After they have made their predictions, remove your finger. Some are likely to be surprised that most of the water remains in the tube, rather than draining into the bowl.
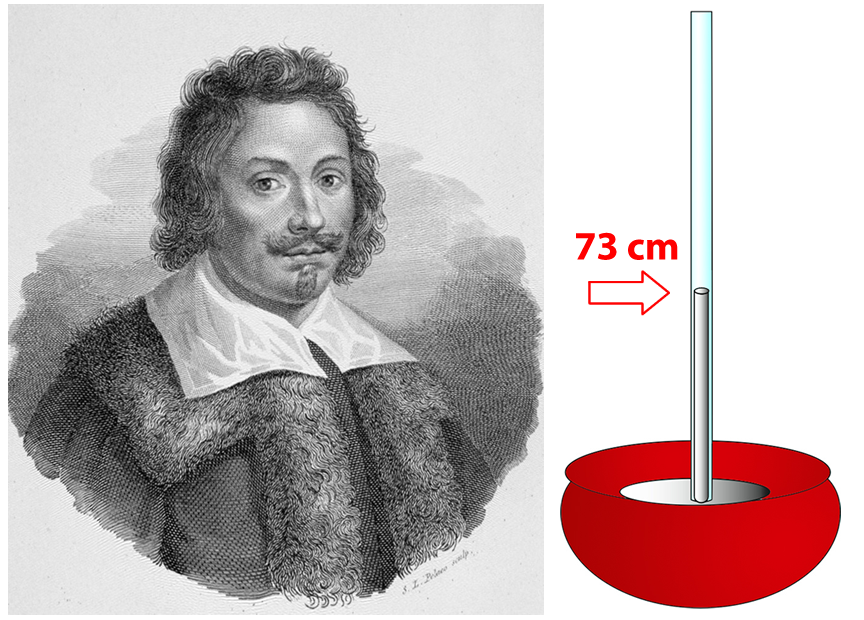
Ask the students why they think the water does not drain down into the bowl. You do not need to correct any misconceptions at this point. Simply give them a chance to discuss their ideas. If there are enough bowls and tubes, have small teams try the activity. Challenge the teams to reduce the amount of air that escapes up the tube, so that there are no bubbles at the top when the finger is removed. Have the students read 1-I. Afterward, have them sketch how they envision the experiment took place. They should be sure to show where someone watched the barometer at sea level, while others took the barometer up the side of a mountain. Ask the students to explain the results of the experiment, and how it helped scientists of the day understand what we take for granted today—that Earth is surrounded by an envelope of air that we call the “atmosphere.”
Investigation 1-1. “Can you observe the effects of air pressure?” is designed to demonstrate, quite dramatically, that the atmosphere does indeed exert very strong pressure.
Safety tip. This activity is a lot of fun, and is best done as a hands-on activity. However, since it uses a hotplate, there is danger of a burned finger. If you are concerned that the students cannot handle the hotplate, then this can be done as a demonstration.
Demonstrate the first part of the experiment—pouring a small amount of water in an aluminum can, heating it, and then preparing to turn it upside-down into a basin of water. However, DO NOT put it into the water yet. Ask the students what they think will happen first. Then, either have them do the experiment, or if you are unable to do so, demonstrate it yourself.
Ask the students to explain what they saw, and to give their opinions on why the can was crushed. Ask them to relate the observation to the concept of air pressure described in the chapter.
Not all of the information needed to explain the phenomenon is described in the chapter. When the air is heated it expands, exerting pressure on the inside of the can. Some of the air escapes through the open top. When the can is plunged upside down into cold water the air inside cools and the opening is sealed. Pressure inside falls rapidly and the air surrounding the can pushes inward to equalize the pressure. Air pressure at sea level is 14.7 pounds per square inch. We never notice this pressure because pressure inside our bodies is equal to the atmospheric pressure pushing in on us.
1-II. The Nature of Science Ask the students to read this section, either in class or as homework. In class, ask the students to list the qualities of science that they read about in this chapter. It is best that they do this in pairs or trios first. Then ask small groups to report out as you list these qualities on the board.
Ask the students to summarize, in their own words, the change that took place in understanding of the atmosphere from the time of Torricelli until today. What evidence led scientists to change their minds about the air? What part did Torricelli play? What part did Pascal play? How do the students think scientists learned about the upper layers of the atmosphere?
Investigation 1-II – Creating a scale drawing of our planet is a mathematical challenge. How your students go about it will depend, in part, on the materials that you provide. We recommend large sheets of butcher paper, rulers, and pencils. A push-pin, string, and cardboard (or wooden board) to push the pin into are also helpful in drawing large circles. Calculators are also very helpful.
Your students will find that it is almost impossible to draw the inner layers of Earth and layers of the atmosphere using just one scale, as all layers of atmosphere will be included in the pencil line that defines the outer edge of Earth’s crust. Some students may create a separate drawing to illustrate the layers of the atmosphere. It is sufficient, however, that they see how incredibly thin the atmosphere is, in relation to the whole planet.
Ask the students to read the Conclusion and to summarize the reasons given for learning about the early history of our planet’s atmosphere and the evolution of life. Invite personal opinions as well as paraphrasing of points made in the book.
Objectives [] Assessment
Guides for each Chapter:
1 – 2 – 3 – 4 – 5 – 6 – 7 – 8 – 9 – 10 – 11 – 12 – 13
Guide for Chapter 2:
Where Did Earth’s Atmosphere Come From?
This chapter describes the mostly widely accepted modern account for the evolution of Earth and its atmosphere. Unlike the first chapter, it does not take into account the evidence that led to these conclusions. To do so would create a book far longer that Life and Climate. However, your students would be quite justified in challenging the story given here.
That this particular story is important is indicated in the National Science Education Standards as follows:
“The sun, the Earth, and the rest of the solar system formed from a nebular cloud of dust and gas 4.6 billion years ago. The early Earth was very different from the planet we live on today.”
— 9th-12th Grade Standards, (NSES/NRC), 1996, page 189.

Since this chapter does not provide evidence to support the story about Earth’s history, you may want to encourage your students to ask questions such as, “How do we know that Earth was formed 4.6 billion years ago?” “How do we know that the first atmosphere consisted of hydrogen?” and so on. Invite them to discuss the kinds of evidence that might have led to these conclusions. Tell them that they will learn about some of this evidence later in the book, but that it is not likely all of their questions will be answered, and they may have to dig deeper themselves.
Investigation 2-2. Timeline. In this activity your students create a paper timeline. Given the amount of space this will occupy, it is probably best that one timeline be created for the entire class, using a paper tape for a cash register.
In order for them to understand the vast amount of time that has passed since Earth was first formed, it is important that the same scale is used for the entire timeline. The suggested scale of 1 meter per every 100 million years means that 1 billion years is represented by a strip of paper 10 meters long. So a timeline representing the entire Earth’s history is 46 meters long, about half the length of a football field.
Mount the timeline in your classroom, wrapped along the walls, above windows and doors. If the lengths of all four walls in your classroom total less than 46 meters, allow the paper tape to form a second row, just below the first, so the students can visualize the entire timeline.
Objectives [] Assessment
Guides for each Chapter:
1 – 2 – 3 – 4 – 5 – 6 – 7 – 8 – 9 – 10 – 11 – 12 – 13
Guide to Chapter 3:
How Do Scientists Play the Dating Game?
Chapter Three is one of the most important chapters of the book since it explains the basis on which global systems scientists are able to give approximate dates to events in Earth’s distant past. However, it is also one of the more difficult chapters, so you may need to spend more time on it, especially the explanation of half-life in section 3-III. Radioactive Decay. The key concepts presented in this chapter are prominent in the National Science Education Standards for grades 9-12, as follows:
“Geologic time can be estimated by observing rock sequences and using fossils to correlate the sequences at various locations. Current methods including using the known decay rates of radioactive isotopes present in rocks to measure the time since the rock was formed.”
— 9th-12th Grade Standards, NSES/NRC, 1996, page 189.
Introduction. The Grand Canyon is magnificent, both for its beauty and for the depth of time captured in its sedimentary rocks. However, there are likely to be examples much closer to home, where an outcropping of rock illustrates layering. Road cuts are especially good places to see the layers of rock that formed as lakes and rivers dumped their loads of sediment each year. If possible, take your students on a field trip to see a local example.
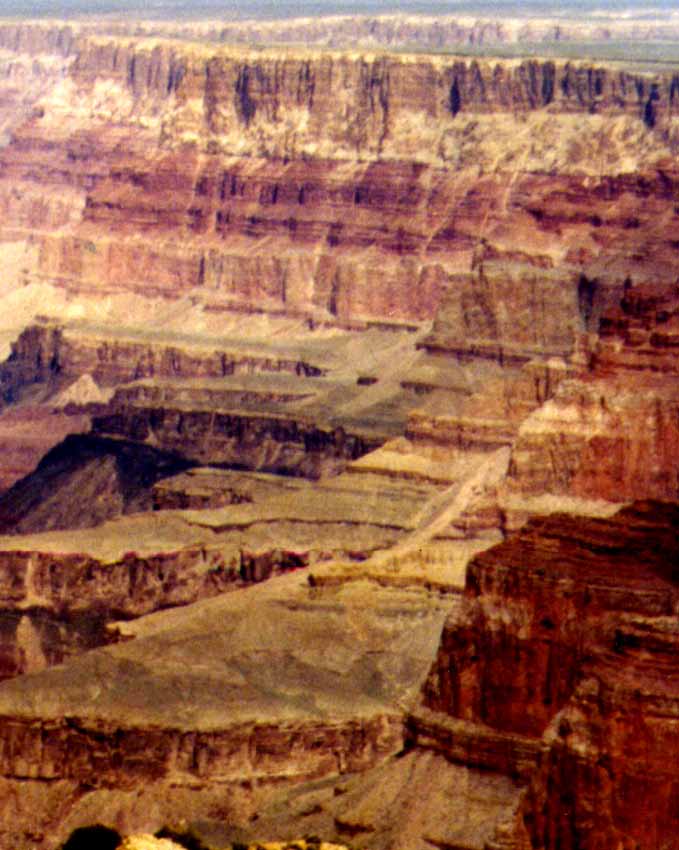
There are a lot of terms in this chapter. It is not important that your students memorize the definitions given in the text, but rather than they understand the basic concept that the layers in sedimentary rock provide evidence about the age of the specimens that were buried within them. At this point the ages given are not absolute ages, but relative ages, since younger specimens are buried on top of older specimens. The fossils themselves were eventually used to match sedimentary layers all over the world.
The geologic time scale is an important concept, as it delineates different periods in Earth’s history marked by major geologic events, or advances in the evolution of life. However, the scale shown at the end of 3-V. Early Dating Methods is not linear. At the bottom one inch equals about 2,000 million (2 billion) years, while at the top one inch equals only about 20 million years. That is why the scale that is created in the classroom, in which one meter equals 100 million years from the beginning of our planet to the current time, is a much better way to visualize the vast amount of time since our planet was formed.
A very good activity at this point in time is to place markers along the paper tape timeline in the classroom to mark the major transitions shown in the chart. We suggest adding paper markers to the timeline to show the beginning of the following:
| Archaen Eon | Proterozoic Eon | Cambrian Period |
| Ordovician Period | Silurian Period | Devonian Period |
| Carboniferous Period | Permian Period | Triassic Period |
| Jurassic Period | Cretaceous Period | Paleocene Epoch |
| Eocene Epoch | Oligocene Epoch | Miocene Epoch |
| Pliocene Epoch | Pleistocene Epoch | Holocene Epoch |
3-VI. The Discovery of X-Rays and 3-VII. The Curies’ Discovery of Radioactive Elements sections are on the discovery of radioactivity and its value in geology. They are meant to be read as interesting (and true) stories. For many students, Marie Curie is the most interesting of the scientists listed here. Her story illustrates not only the difficulties encountered by women scientists, but also the importance of a scientific community, in which each individual contributes important ideas and findings, but also depends on the work of those who have gone before, and on interactions with colleagues. Science, in other words, is an inherently social activity.
If you have the opportunity, you may wish to assign students to select one of the scientists mentioned here and find out more about that person’s life via an Internet search. Alternatively, you could point out that most textbooks leave out many important contributors since there simply isn’t room to include everyone. Ask the students to research the lives of other scientists who contributed to the discovery of radioactivity, but who are not listed here.
3-III. Radioactive Decay. The concept of a “half-life” is essential in understanding how scientists have been able to determine the absolute age of rocks, and the age of the entire planet (4.6 billion years ago). The activity Investigation 3-1. Simulating Half-Life Decay with Pennies is intended to help students understand this concept.
The analogy between actual radioactive minerals and the fictitious mineral “pennyonium” is only approximate since the sample of “pennyonium” consists of only 100 atoms. Even so, the half-life graph nearly always reveals a fairly good half-life curve. The graph is then used to answer the questions.
You may wish to ask the students to paraphrase the Conclusions in their own words.
Objectives [] Assessment
Guides for each Chapter:
1 – 2 – 3 – 4 – 5 – 6 – 7 – 8 – 9 – 10 – 11 – 12 – 13
Guide for Chapter 4:
The Beginning of Life on Earth
Section I. Evidence of Early Life
- These two introductory pages introduce the profound question that is the subject of this chapter: How did life on Earth begin? There is, of course, no answer to this question as yet, but the search for an answer has led to some very important discoveries about how life evolved once it started.
- Consider having a class discussion about the question “What is life?” You could have students start by individually writing down their own ideas (to put in their portfolios) or having small group discussions before having whole class discussion. Recognizing that there are many characteristics that we associate with life, but no single defining characteristic, is an important insight that could grow out of this discussion. One approach to get started is to ask your students to individually brainstorm answers to the question “How can you tell something is alive?” Then ask students to work in pairs to test each others’ ideas by coming up with examples of things that fit or do not fit the definition. Lead a large group discussion about the insights that students gain from their work on this challenge.
- “Stromatolites” will appear again in this book, as a major player in the early evolution of life. You may want to ask your students to further investigate these colonies of single-celled algae via the Internet.
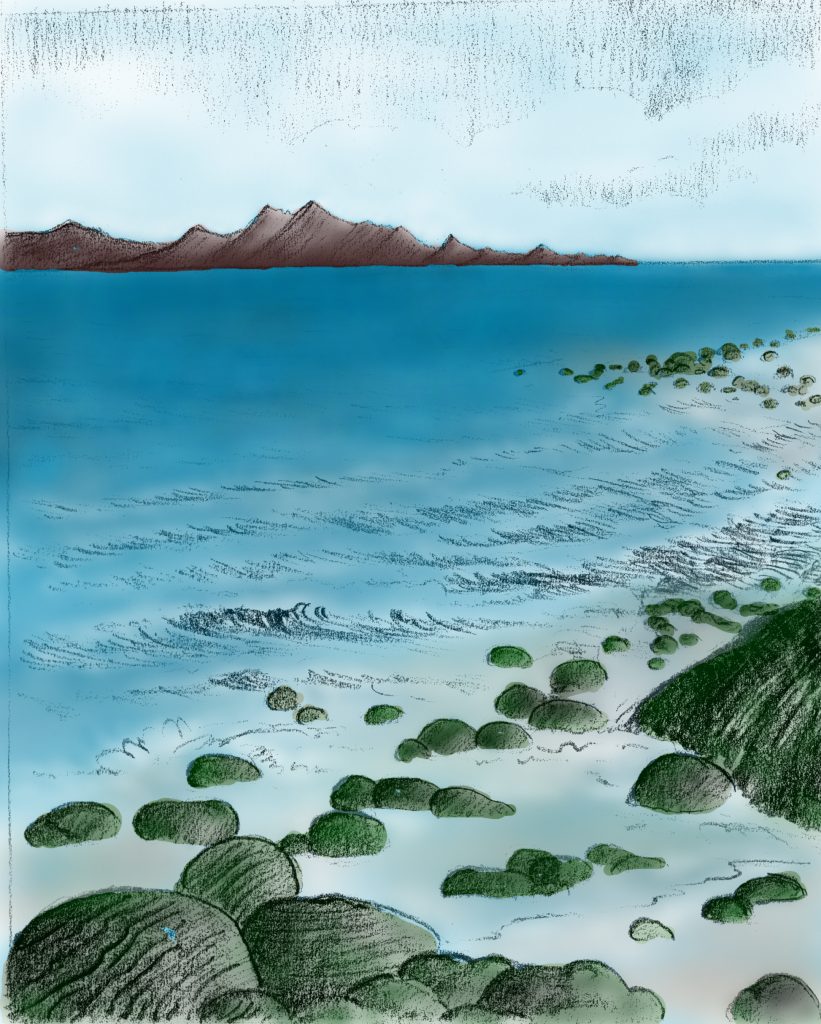
The importance of teaching your students about these very early life forms is emphasized by the National Science Education Standards as follows:
“Evidence for one-celled forms of life—the bacteria—extends back more than 3.5 billion years.”
— 9th-12th Grade Standards, NSES/NRC, 1996, page 190.
Section III. Creating the Building Blocks of Life
• Some students may have difficulty understanding Miller’s experiment from the diagram. Be prepared to answer your students’ questions about it, and/or ask them to describe the experiment in their own words.
• It has surprised many scientists that Miller’s very promising early experiments never led to the creation of simple life forms, even though they did result in the “building blocks” of life—amino acids. You might ask your students why they think that was the case, and their personal views on Darwin’s theory for the origin of life.
Section IV. Meet Kathleen Crane
- The profile of Dr. Crane has two purposes. One is to briefly describe the life and background of a global systems scientist working today, and to explain how she came to select this career. Be sure to ask students for their thoughts and feelings about the story. What are some of the similarities and differences that they notice between the life of Dr. Marie Curie and Dr. Kathleen Crane?
- The other purpose of this section is to introduce a different theory for the origin of life. Today the idea that life may have originated near a hydrothermal vent has gained wide support. However, there is still no strong evidence to support this theory over others.
Section V. Where Do You Think Life Originated?
Several questions and an idea for an essay may be found in this section. The essay is open-ended—students may respond with any theory they like, provided they provide a reasonable rationale. Following are acceptable answers to the questions.
- Dr. Crane proposed that life may have begun near a hydrothermal vent near the midocean ridge.
- Earth’s ocean absorbs carbon dioxide and removes it from the atmosphere. Although Dr. Cran does not say so here, later in the book we find that removing carbon dioxide from the atmosphere has kept Earth’s atmosphere from getting too hot for life.
- The ingredients for life found near these ridges include amino acids, methane, ammonia, water vapor, and carbon dioxide as well as heat energy. Sheets of clay may also have played a role in organizing the structure of the earliest living things.
Secton VI. The Importance of Scientific Arguments
A very important point about the nature of science can be found in this section, that “argument” is a very important aspect of science. Most people are familiar with other aspects of science, such as experimentation and analysis. In contrast, it is erroneously believed that scientists must “know what they’re talking about.” If scientists only stuck to what they know, however, science would make no progress at all! Argument between scientists who disagree is a valuable process for clarifying ideas, marshaling evidence, and in some cases, actually changing other peoples ideas.
The National Science Education Standards emphasizes that high school students need to understand concepts such as these:
“Science distinguishes itself from other ways of knowing and from other bodies of knowledge through the use of empirical standards, logical arguments, and skepticism, as scientists strive for the best possible explanations about the natural world.”
— 9th – 12th Grade Standards, NSES/ NRC, 1996, page 201.
Objectives [] Assessment
Guides for each Chapter:
1 – 2 – 3 – 4 – 5 – 6 – 7 – 8 – 9 – 10 – 11 – 12 – 13
Guide for Chapter 5:
The Origin of Our Oxygen-Rich Atmosphere
It is not easy to keep track of the sequence of chemical and physical changes that result in BIFs and redbeds, and it is not essential that students learn the sequence of steps. The critical information here is that BIFs were formed before about 2.1 billion years ago, when there was very little free oxygen in the atmosphere. These rock formations could not be formed today because the iron in the rocks would rust due to the high oxygen content in our atmosphere. Redbeds formed after 2.1 billion years ago, when there was enough oxygen present to cause iron to rust. Oxygen did not reach current levels of about 21% until about 500 million years ago.
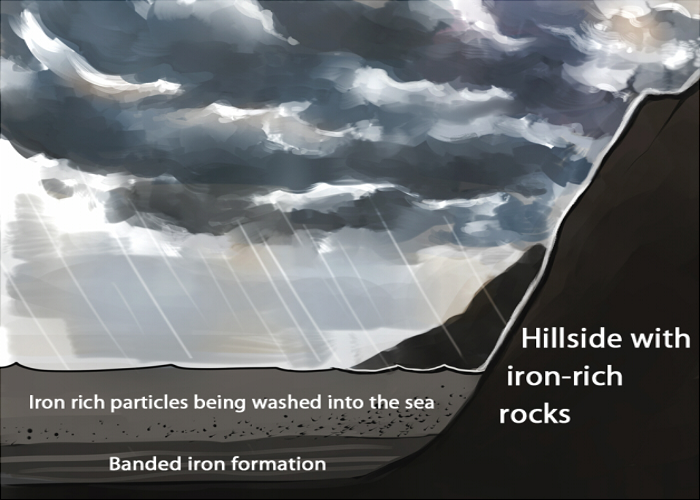
Understanding how early life changed the atmosphere, paving the way for the later development of complex life, and eventually humans, is an essential concept for this age level, as described in the National Science Education Standards:
“The evolution of life caused dramatic changes in the composition of the Earth’s atmosphere, which did not originally contain oxygen.”
— 9th-12th Grade Standards, NSES/NRC, 1996, page 190.
5-II. How Tiny Organisms Changed the World. Fossilized stromatolites provide direct evidence that tiny, single-celled bacteria (blue-green algae) lived on Earth 3.5 billion years ago. By observing similar microorganisms that exist today, we know that these blue-green algae absorbed carbon dioxide and gave off oxygen. The important point to communicate is that while no one was around to observe it, BIFs and redbeds provide evidence that these microorganisms gave off enough oxygen to change the composition of the atmosphere.
When your students read this section, ask them to describe the three ways that the organisms that created the stromatolites changed the atmosphere:
- The amount of oxygen in the atmosphere increased;
- The amount of carbon dioxide in the atmosphere decreased; and
- Oxygen in the upper atmosphere formed ozone, which protected Earth from UV radiation from the sun. Ozone continues to protect us today, although certain man-made chemicals have caused the ozone layer to thin, especially over Antarctica. These three ideas are the most important ones to grasp in this chapter since they set the stage for the beginning of complex life.
Objectives [] Assessment
Guides for each Chapter:
1 – 2 – 3 – 4 – 5 – 6 – 7 – 8 – 9 – 10 – 11 – 12 – 13
Guide to Chapter 6:
How and When Did Complex Life Begin?
Complex life began only about 670 million years ago—the most recent 15% of Earth’s history. Explanations for this “explosion” of living organisms are all based on some variation on the theory of biological evolution. That the theory of evolution is essential to understanding the history of life on our planet is described in the National Science Education Standards:
Natural selection and its evolutionary consequences provide a scientific explanation for the fossil record of ancient life forms, as well as for the striking molecular similarities observed among the diverse species of living organisms.”
—9th-12th Grade Standards, NSES/NRC, 1996, page 185.
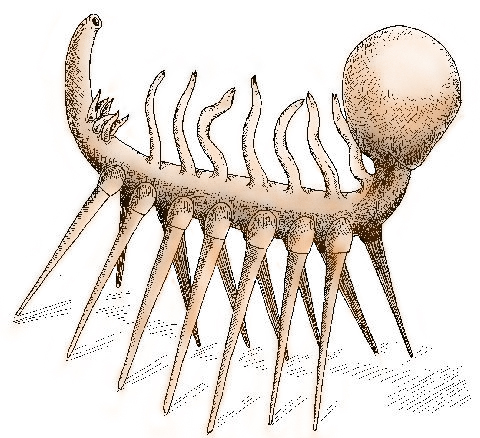
Now is a good time to pause and ask you students to describe their understanding of the theory of evolution that was developed simultaneously by Charles Darwin and Alfred Russel Wallace. Provide enough opportunity for discussion so that various levels of understanding, or misunderstanding, can be aired.
You may find that a common misconception is that individual animals change their bodies to adapt to their environment. For example, a giraffe’s neck is long is because giraffes stretch their necks to reach food high in a tree and their offspring inherit the elongated necks. In contrast, the process of natural selection occurs only if chance mutations result in giraffes with necks of various lengths. An environment where most of the food grew in the upper branches of trees would favor giraffes that just happened to have longer necks, so they would be more likely to survive and mate.
Ask your students for further examples to demonstrate their understanding of the concept of natural selection.
After your students have read this chapter have them write the pros and cons of each of the theories for why life evolved so slowly for most of Earth’s history, then exploded around 670 million years ago: Was it a result of sexual reproduction? More oxygen in the atmosphere? Or a change in the climate? Students can then discuss their ideas in small groups or in a formal debate. Emphasize the importance of applying the concept of natural selection in choosing among the three theories.
You may want to conclude by explaining that even today, no one knows for certain which of these theories is correct. Perhaps all three are correct, or possibly none of them.
Objectives [] Assessment
Guides for each Chapter:
1 – 2 – 3 – 4 – 5 – 6 – 7 – 8 – 9 – 10 – 11 – 12 – 13
Guide for Chapter 7:
Earth’s Shifting Crust
The Theory of Plate Tectonics
This chapter provides a very brief overview of one of the major paradigm shifts of the 20th century—the theory of plate tectonics. It briefly describes the contributions of James Dwight Dana, John Wesley Powell, Clarence Dutton, Antonio Snider-Pelligrini, Alfred Wegener, Maurice Ewing, Marie Tharp and Bruce Heezen, Harry Hess, and Edward Bullard. This story is singled out in the National Science Education Standards as illustrating one of the most important breakthroughs in the history of science:
“Occasionally, there are advances n science and technology that have important and long-lasting effects on science and society. Examples of such advances include Plate tectonics”
— 9th-12th Grade Standards, Earth and Space Science, NSES/ NRC, 1996, page 204.
It is not unusual for students to look down on scientists whose theories have been discredited, assuming that they are somehow inferior to those whose ideas were eventually vindicated. At the time they were proposed these abandoned theories may have been just as brilliant and just as reasonable as those that eventually turned out to be true. Theories about the large-scale features of our planet provide an excellent case in point.
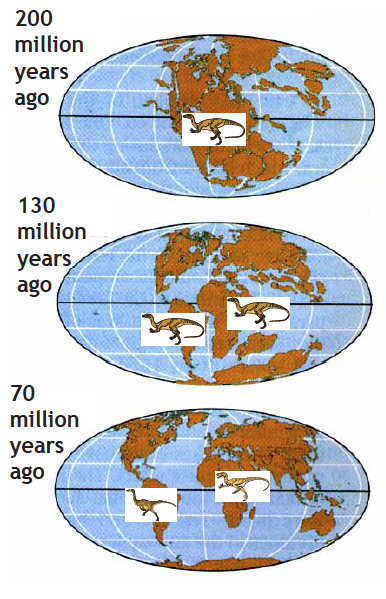
One way to help your students recognize the contributions of each scientist in the story is to ask them to read the story in this chapter with the following questions in mind: Did this person’s idea seem reasonable to other scientists at the time? What unique idea did this person contribute to the field? What if this person’s idea were never proposed at all? How might that idea have changed our understanding today? You may want to assign one scientist to a group of students, so they can discuss that person’s contributions from several different points of view.
Also relevant to this story is the concept of a scientific community. Each individual’s contribution depended on the ideas of people who had gone before, and influenced the ideas of researchers who would follow. Challenges by fellow scientists resulted in the development of further evidence and arguments. Invite your students to share their own insights about other situations in which a set of ideas — perhaps about music, fashion, economics or politics—develops within an entire community.
Convection
Investigation 7-1. Observing Convention Currents should be done by groups of students. Unlike the very rapid convection that can be observed in boiling oatmeal, the convection current your students will observe in a pan of cold water with a heat source in the center is similar to the very slow convection currents that drive the motion of tectonic plates on Earth. It is important that your students observe this phenomenon for themselves, in order to understand the physical explanation that eventually convinced scientists that “continental drift” was really happening.
The discussion of density in 7-V. Why Causes Convection Currents? explains why convection occurs. Ask the students to explain the connection between the activity and the explanation of the Colorado Plateau by Clarence Dutton. [Dutton believed that the plateau was uplifted because it was less dense than the surrounding crust. In this activity liquid over the heat source becomes less dense than its surroundings, so it rises.]
That the investigation and discussion in this chapter are important in understanding the physical basis for tectonic plate theory is described in the National Science Education Standards as follows:
“The outward transfer of Earth’s internal heat drives convection circulation in the mantle that propels the plates comprising Earth’s surface across the face of the globe.”
—9th -12th Grade Standards, NSES/ NRC, 1996, page 189.
Objectives [] Assessment
Guides for each Chapter:
1 – 2 – 3 – 4 – 5 – 6 – 7 – 8 – 9 – 10 – 11 – 12 – 13
Guide for Chapter 8:
Highs and Lows Over the Past 750 Million Years
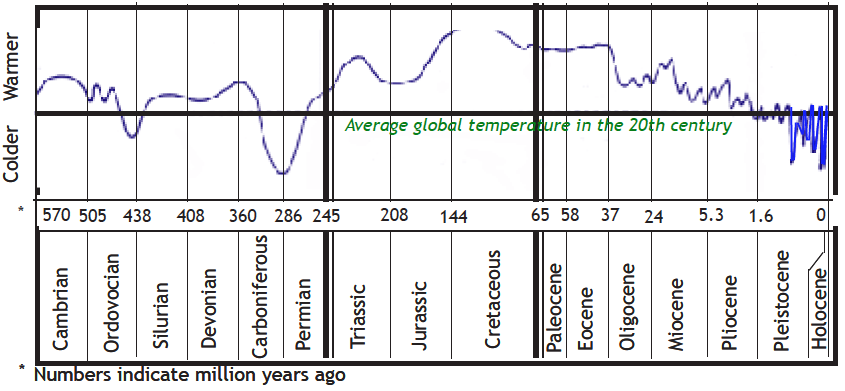
This chapter describes how the long term carbon cycle affects climate over very long periods of time. As indicated in the following quote from the National Science Education Standards, the long-term carbon cycle is a very important concept in understanding not only the past history of our planet, but such current issues as global warming.
“The Earth is a system containing essentially a fixed amount of each stable chemical atom or element. Each element can exist in several different chemical reservoirs. Each element on Earth moves among reservoirs in the solid Earth, oceans, atmosphere, and organisms as part of geochemical cycles. “Movement of matter between reservoirs is driven by the Earth’s internal and external sources of energy. These movements are often accompanied by a change in the physical and chemical properties of the matter. Carbon, for example, occurs in carbonate rocks such as limestone, in the atmosphere as carbon dioxide gas, in water as dissolved carbon dioxide, and in all organisms as complex molecules that control the chemistry of life.”
— 9th-12th Grade Standards, NSES/NRC, 1996, page 189.
In order to assess your students’ understanding of the long term carbon cycle idea, after they have read 8-I. Earth’s Thermostat: the Long-term Carbon Cycle, ask the students to write a short story about the life of a carbon atom, illustrating all of the phases of the long-term carbon cycle.
The period of time shown in the graph 8-II. Highlights of the Earth’s Climate History the most recent 750 million years of Earth history. Notice that the time scale is not linear. The last few million years takes up more space than the first few million years. Be sure to point this out to your students.
Ask your students to show where on the graph the various events described here would fall: the beginning of multi-cellular life forms; the breakup of Pangaea; the existence of huge forests with woody trees; the end of the Cretaceous period, when dinosaurs became extinct.
Key points for your students to understand in this section include:
- a. A relatively small change in global temperature — just a few degrees centigrade—can make a huge difference in climate that can last for millions of years.
- b. The warmest period in known Earth history was the Cretaceous, the most recent of the three Periods that dinosaurs dominated our planet.
- c. The time that we live now is relatively cool. The squiggles at the far right of the graph represent the “current” period of ice ages. Right now we’re at the top of the most recent squiggle. If the same pattern continues, we’re likely to have another ice age in a few thousand years.
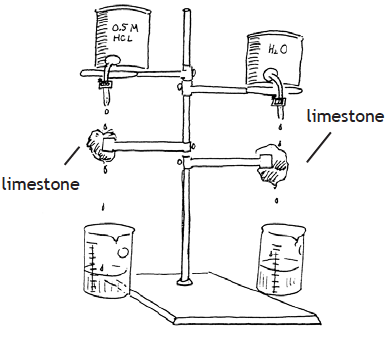
It may be hard for students to believe that rocks can be dissolved by water, since the process is normally too slow to perceive. However, your students will have a chance to see what water can do in this activity. You may want to supplement the activity by showing photos of rocks eroded by water.
You will probably want the students to write their answers to the questions at the end of 8.II. You can invite them to discuss their answers in small groups before sharing them with the class.
Understanding the long-term carbon cycle is a very important part of this unit. Be sure to allow time for the students to ask their own questions about points that puzzle them.
Objectives [] Assessment
Guides for each Chapter:
1 – 2 – 3 – 4 – 5 – 6 – 7 – 8 – 9 – 10 – 11 – 12 – 13
Guide to Chapter 9:
What Happened to the Dinosaurs?
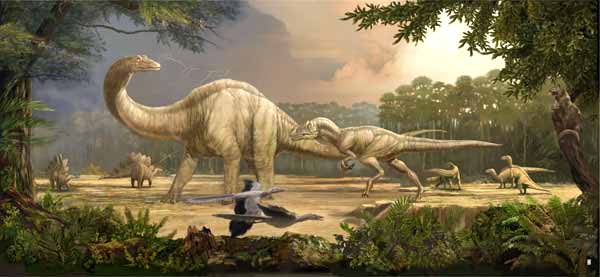
The debate about why dinosaurs and many other species became extinct at the end of the Cretaceous Period is a wonderful example of how scientific controversies are resolved. The entire chapter focuses on the search for evidence that would support one theory over the other.
You may want to have your students stage an actual debate to argue the merits of one theory over the other, giving reasons for why one piece of evidence might be stronger than another piece of evidence.
That this is an essential lesson for high school students to learn that is emphasized in the National Science Education Standards as follows:
“This aspect of the [Inquiry] standard emphasizes the critical abilities of analyzing an argument by reviewing current scientific understanding, weighing the evidence, and examining the logic so as to decide which explanations and models are best. In other words, although there may be several plausible explanations, they do not all have equal weight. Students should be able to use scientific criteria to find the preferred explanations.”
— 9th-12th Grade Standards, NSES/NRC, 1996, page 175.
One of the major roadblocks to science literacy among adults is that newspapers tend to report controversy rather than consensus. For example, we may read in the news that scientists disagree about how much of the current global warming trend is due to human activities, or whether a newly discovered hominid skull is ancestral to modern humans. On reading about disagreements such as these many people tend to dismiss all scientific research, saying that scientists “don’t know what they’re talking about.” You have an opportunity to help your students understand that controversy is an essential aspect of science. Controversy helps scientists identify and clarify alternative explanations, and predict what new discoveries might support one explanation in favor of another. That is the way science advances.
In concluding the chapter, be sure to explain to your students that such debates characterize science at its best, and that science rarely gives hard-and-fast answers. It is more likely that such debates end when the evidence piles up in favor of one theory, which is then taken to be the best explanation as of that point in time. New evidence could always be discovered which would cause scientists to change their opinions.
Objectives [] Assessment
Guides for each Chapter:
1 – 2 – 3 – 4 – 5 – 6 – 7 – 8 – 9 – 10 – 11 – 12 – 13
Guide for Chapter 10:
The Ice Ages
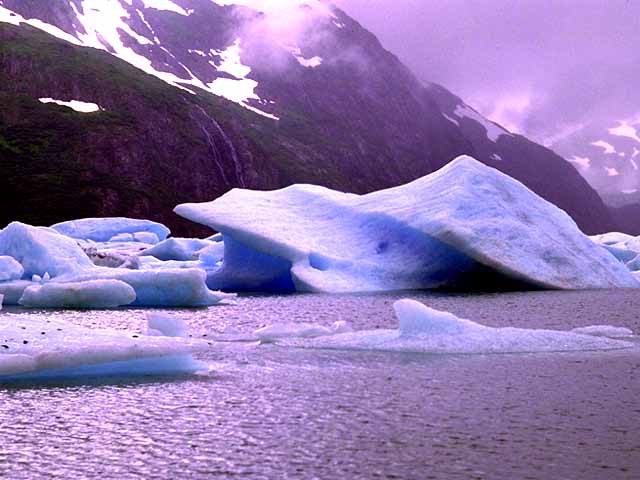
It is not uncommon for people to believe that there was just one “ice age.” This chapter gives an overview of all ice ages that are known to have occurred, and some of the best explanations currently available for why they occurred. The chapter also helps your students recognize where we are today on the global temperature scale.
These ideas are included in the National Science Education Standards as follows:
“Students find that the geologic record suggests that the global temperature has fluctuated within a relatively narrow range, one that has been narrow enough to enable life to survive and evolve for over three billion years. They come to understand that some of the small temperature fluctuations have produced what we perceive as dramatic effects in the Earth system, such as the ice anges and the extinction of entire species.”
— 9th-12th Grade Standards, NSES/NRC 1996, page 188.
Have your students place Post-Its™ or other markers on the timeline along the wall in the classroom to indicate when the various ice ages have occurred, and about how long they lasted.
A common misconception is that “technology” refers to just computers and other electronics. While electronics is certainly an important technology of the modern age, the term applies to any and all objects and processes that people have created in response to a human need or desire. That includes stone arrowheads and cooking methods, as well as cars and clothing.
This chapter outlines a series of increasingly sophisticated technologies used to determine the age of certain samples, the average temperature at that time, and the composition of the atmosphere. These technologies, created and refined by many thousands of scientists and engineers, have enabled modern scientists to piece together an amazingly accurate picture of Earth’s climate history. Discuss these methods with your students, emphasizing that each is a “new technology” for uncovering past climates. The importance of new technologies in science is described in the National Science Education Standards as follows:
“Scientists rely on technology to enhance the gathering and manipulation of data. New techniques and tools provide new evidence to guide inquiry and new methods to gather data, thereby contributing to the advance of science. The accuracy and precision of the data, and therefore the quality of the explanation, depends on the technology used.”
— 9th-12th Grade Standards, National Science Education Standards, NRC, 1996, page 188.
Spend some time helping your students interpret the chart in 10-V. Results from Vostok. You might start by having them look at the timeline axis and compare it to the chart in 10-III. Climate History of the Past 570 Million Years. They should notice that the time period shown is at the far right of the chart in 10-III, and shows much greater detail of the four most recent “squiggles,” or ice ages.
Spend some time discussing the vertical scale, noticing the line that represents the current average global temperature. The temperature scale is very, very cold, since these measurements were made in Antarctica. However, the swings in temperature were seen around the world.
While there is no precise definition of how cold it needs to get for an “ice age” to begin, certainly Earth is in a deep ice age when the average temperature is about 5°C colder than at present. Explain that 5° may be a small difference in weather, from day to day, but the global average climate is quite different. Differences of that amount make a difference between solid and melting glaciers, or the direction of ocean currents.
Remind your students that our human ancestors were alive during this entire period. Ask them what life must have been like when the climate changed from a very warm to a very cool period or visa versa.
The Milankovich Cycles in 10-V. What Caused the Recent Ice Ages are complex, although this is a simplified picture of these cycles. Changes in Earth’s orbit and spin axis provide the best interpretation for triggering the ice ages. The Milankovich cycles did not operate in earlier times because overall the Earth was too warm. It was only when the entire planet began to cool for other reasons that these subtle differences in Earth’s orbit cooled the planet enough for the ice ages to begin.
The relationship between carbon dioxide content of the atmosphere and the presence of ice ages is not as simple as it first appears. The illustration 10-VI. Greenhouse Gases and Ice Ages reveals that the pattern of global average temperature changes and carbon dioxide content of the atmosphere are very similar, indicating that there is clearly a relationship. As we might expect, in some cases changes in carbon dioxide content occurred first, followed by changes in temperature. But in other cases changes in temperature came first, followed by changes in carbon dioxide content. Ask your students to read the text carefully and explain why this might be so.
The graph Greenland Temperature near the end of the chapter shows an even more detailed view of global average temperature. Your students should again compare the timeline with the previous graphs such as the one since the last ice age ended.
The box near the end of section VII (Ice Cores in Greenland)
is intended for more advanced students who might wonder how it is possible to obtain temperature data from samples of ancient ice.
The Investigation below is an excellent way to bring the idea of changes that happened during the ice ages to the students on backyards.
The “Conclusion” provides a brief overview of the chapter. Ask your students what questions they may have at this point.

TG-LC10-1. Investigation:
What Has Been in Your Backyard?
by Becca Kranz and John Pickle
See the Digital Earth Watch investigation What Has Been in Your Backyard? to see how the population changes in time for a plant species you choose in an area that you select.
Objectives [] Assessment
Guides for each Chapter:
1 – 2 – 3 – 4 – 5 – 6 – 7 – 8 – 9 – 10 – 11 – 12 – 13
Guide for Chapter 11:
Climate and Human Evolution
This chapter makes use of the “story” mode, describing what paleoanthropologists have been able to piece together concerning the history of our species.
Here, again, new evidence continues to change the prevailing theories about the evolution of pre-human species.
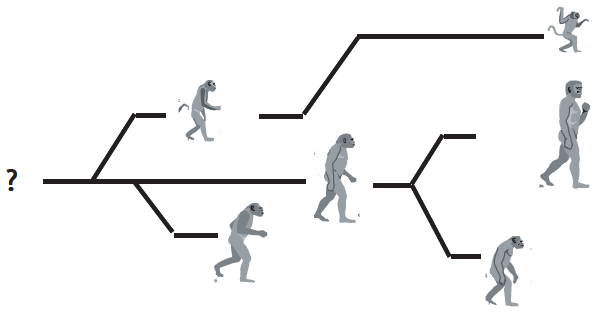
A recently discovery by Tim Brunet (Science News, July, 2002) has located skull fragments of what may be a pre-human species that lived about 6-7 million years ago. It had a small ape-size brain, but face and teeth much like modern humans. Surprisingly, it was found in Central Africa, throwing into doubt some of the speculation found in 11-II. The Influence of Climate, about how climate may have influenced the evolution of early modern hominids.
It is not important that your students learn the names of these various pre-human species. Instead, spend time discussing how paleoanthropologists interpret the evidence of ancient fossils and climates to formulate various theories about how life and climate evolved together, as shown in 11-III –11-VI.
A very good resource for learning about how paleoanthropologists interpret evidence of human ancestry is an article scheduled for publication in The American Biology Teacher in Fall, 2002, by Jeremy DeSilva of the Museum of Science in Boston. The article will be linked to illustrations at the Museum of Science website at http://www.mos.org/.
The theory of evolution forms the foundation of the entire science of biology, including the way plants, animals, and other living organisms are classified. This idea is expressed in the National Science Education Standards as follows:
“The millions of different species of plants, animals, and microorganisms that live on Earth today are related by descent from common ancestors. “Biological classifications are based on how organisms are related. Organisms are classified into a hierarchy of groups and subgroups based on similarities which reflect their evolutionary relationships. Species is the most fundamental unit of classification”
— 9th-12th Grade Standards, NSES/ NRC, 1996, page 185
Objectives [] Assessment
Guides for each Chapter:
1 – 2 – 3 – 4 – 5 – 6 – 7 – 8 – 9 – 10 – 11 – 12 – 13
Chapter 12:
Climate and Culture
A good way to start this chapter is to ask the students how close to the end of the paper tape timeline the entire span of human culture should be. (At 100 million years per meter, 50,000 years of human culture would be represented in the last half-millimeter of the timeline.)
Since it is simply not possible to show the other developments described in the chapter (development of agriculture, end of the most recent ice age, settlement of the Americas) on the timeline, You can have a group of students add a section of the timeline in which the last millimeter of the scale is expanded by a factor of 1,000. On the expanded scale, 1 meter equals 100,000 years.
“The Importance of Language” investigation is fun and challenging, and communicates what is likely to have been a watershed in the development of our species. A good way to do this is to organize the class in small groups of 4-5 students per group, so they can work on the task simultaneously, then share insights as a large group.
You may wish to spend some time discussing the chart in 12-VI. The Greenland Story. Have the students compare the time scale with the chart of Greenland Temperature near the end of Chapter 10 (The Ice Ages). Notice that the entire chart (1850–1980) illustrates what occurs in the last unit to the right of the chart of Greenland Temperature near the end of Chapter 10. Yet, even the small changes during this interglacial period have made a huge difference in human culture and history.
Notice also, in the chart on 12-VI, how the climate has warmed in the last century. The current consensus among scientists is that most of this warming is due to the burning of fossil fuels.
The final student investigation of this chapter, Investigation 12-I. How Did the Eskimos Survive?, is an excellent way for individual students, or pairs of students, to reflect on the role of human culture and technology in survival of entire populations. The Viking settlers in Greenland only had a generation or two to adjust to the change in climate, while the Eskimos had many generations to develop methods for surviving the harsh conditions of their environment.
You may want to discuss with the students the fascinating changes that occurred in human culture at about the time the last ice age ended. (That was about the time humans developed agriculture, which in turn, made it possible for the growth and development of the first large cities and complex civilizations.)
The linkage between climate and culture described in this chapter can also be viewed in the context of the theory of evolution, as described in the following quote from the National Science Education Standards:
“Like other aspects of an organism’s biology, behaviors have evolved through natural selection. Behaviors often have an adaptive logic when viewed in terms of evolutionary principles. “Behavioral biology has implications for humans, as it provides links to psychology, sociology, and anthropology.”
— 9th-12th Grade Standards, NSES/ NRC, 1996, page 187.
Objectives [] Assessment
Guides for each Chapter:
1 – 2 – 3 – 4 – 5 – 6 – 7 – 8 – 9 – 10 – 11 – 12 – 13
Guide for Chapter 13:
What Does Earth’s Past Tell Us About Our Future?
This last chapter provides an opportunity for students to reflect on the entire history of Planet Earth with regard to its changing climate and evolution of life. Against this background, they consider how climate might change in the future as a result of both natural and human- induced changes. This activity is strongly supported by the National Science Education Standards as follows:
“[Students] explore the regulation of Earth’s global temperature by the water and carbon cycles. Using this background, students can examine environmental changes occurring today and make predictions about future temperature fluctuations in the Earth system.”
— 9th-12th Grade Standards, National Science Education Standards, National Research Council, 1996, page 188. Key points are that:
The first forms of life (blue-green algae that formed stromatolites) profoundly changed the atmosphere by adding oxygen.)
Although changes in climate have been large as judged by humans, the long- term carbon cycle has maintained Earth’s climate within limits so as to preserve life since it started, more than 3.5 billion years ago.
Earth’s slowly changing relationship to the sun has resulted in a series of ice ages during the past three million years. Our human ancestors evolved during the ice ages. The changing climate may have contributed to the evolution of human cultures and behaviors. You may want to have students work individually or in pairs to answer the questions about Graphs A through E. Most of the questions provide an opportunity for the students to review what they have learned in previous chapters. However, the questions about Graph E raise issues concerning Earth’s future climate. These questions link to the cartoon in the introduction of chapter 1, which the students should now be able to discuss with more knowledge about the climate history of our planet. The text in 13-I. Major Periods and Important Cycles provide further background about the theory of global warming and some of the questions that scientists are continuing to research today.
The purpose of the “Timeline” activity in Investigation 13-1. Timeline II is for the students to briefly review key events in Earth history.
The suggested Investigation 13-2. What Does Earth’s Past Tell Us About Our Future? is a means for the students to go beyond the text, and apply the principles learned in the unit to a specific period in Earth history:
Step 1) shows that the students are able to connect the climate with the evolution of life during a period of Earth history.
Step 2) allows the student to show knowledge of some of the research methods presented in the unit. This is also an opportunity for students to search the Internet for information about this period, to show what is known and unknown.
Step 3) enables students to reveal their thinking about how learning about Earth’s past can help us predict the future so that we can act accordingly. The Conclusion comments on the motivation of scientists—to satisfy their curiosity, and to learn more about the Earth system so as to preserve a livable environment for future generations. It also refers to the important role that today’s students will play in determining the future environment of our planet. You may want to ask the students how they feel about these ideas as a way of summing up their personal responses to Life and Climate.
