TG Energy Use
{ GSS Teacher Guide Index } { All GSS Books }

~{}~
Objectives [] Planning [] Assessment [] Resources
Guides for each Chapter: 1 – 2 – 3 – 4 – 5 – 6 – 7 – 8 – 9 – 10
Index of TG Investigations
Teaching Objectives
Energy Use is about the ways that humans use energy. The four goals for the unit Energy Flow, and the objectives which support these goals are summarized on this page.
Goal 1: Students will appreciate the diversity of energy forms in everyday life.
- Objective 1A: Students understand how electricity is made.
- Objective 1B: Students are familiar with basic forms of energy such as kinetic energy, potential energy, chemical energy, nuclear energy, electrical energy and electromagnetic radiation.
- Objective 1C: Students can identify ways that energy is transformed from one form into another. They can build a model electric motor
Goal 2: Students will realize what our sources of energy are.
- Objective 2A: Students will know what forms of fossil fuel we rely on (coal, oil, natural gas) and realize that they are limited resources.
- Objective 2B: Students will be able to identify the basic parts of an electric power plant.
- Objective 2C: Students can recognize several different types of power plants using different sources of energy.
- Objective 2D: Students will understand how electricity reaches businesses and homes through a power grid of transmission lines. They will understand electrical terms such as voltage, amperage, resistance.
Goal 3: Students will realize the many end uses of energy in homes, businesses and industry.
- Objective 3A: Students can classify energy use into three broad categories: transportation, industry, residential and commercial.
- Objective 3B: Students will be able to understand factors that determine energy costs to them as consumers, including behaviors and decisions that result in wasted energy.
- Objective 3C: Students are able to conduct experiments to determine relative efficiencies of light bulbs and energy loss in refrigerators.
- Objective 3D: Students will be able to compute the payback time for energy conservation devices such as compact fluorescent lights.
- Objective 3E: Students will understand the meaning of R-value in home insulation
Goal 4: Students realize the significance of energy in their lives and how each person affects the flow of energy on the planet.
- Objective 4A: Students can trace the path of energy all the way from the Sun, though the atmosphere, into plants, animals and into their own bodies.
- Objective 4B: Students recognize ways that their personal activities depend on various energy transformations
~{}~
Objectives [] Planning [] Assessment [] Resources
Guides for each Chapter: 1 – 2 – 3 – 4 – 5 – 6 – 7 – 8 – 9 – 10
Index of TG Investigations
Planning Your GSS Course
Global Systems Science is intended to be an inquiry-based course, with many hands-on laboratory activities and interactive discussions; but the extent to which it is based on inquiry depends on you!
The student guide, Energy Use, contains a rich assortment of 18
student investigations. This teacher’s guide provides additional activities and ideas for you to enrich your course. High school teachers who participated in a GSS INSTITUTE in 1995 prepared many of these additional activities. Each of these activities is located in the chapter to which they are most appropriate.
Most of these activities, those in the student guide as well as those in this teacher’s guide are meant to be adjusted to fit the needs of your curriculum. You may add to or delete segments of each of these as you see fit. Feedback is welcome on all of them since they are all works in progress.
When you have completed this unit, you may want to continue with other GSS units that follow from Energy Flow. Examples may be found in the Customizing GSS page in the Basic GSS Overview.
The ideas presented in the Chapter-by-Chapter notes are just suggestions. From time to time we will make suggestions for small or large group discussions, questions to encourage thinking about the information that is presented, or ways to engage your student’s interests. However, your best guide will be your own intuition.
Please keep in mind that this Teacher’s Guide is a work in progress. Please annotate any questions you might have, or ideas that would work in addition to, or in place of those suggested. Note anything that doesn’t work and how students seemed to grasp the concepts, develop skills or recognize the relationship between their own actions and global environmental change so that we can include them in future editions of the Teacher’s Guide. Send your suggestions to:
gssmail@berkeley.edu or
Alan Gould, Global Systems Science Director

~{}~
Objectives [] Planning [] Assessment [] Resources
Guides for each Chapter: 1 – 2 – 3 – 4 – 5 – 6 – 7 – 8 – 9 – 10
Index of TG Investigations
Assessment Tasks
1. Portfolios
General ideas for assessing student progress towards the goals and objectives of Energy Flow are suggested in a number of places throughout this Teacher’s Guide. We especially encourage the use of portfolios as a means of providing feedback to students and to demonstrate to parents evidence of student progress. Portfolios for Energy Flow might include:
- Written answers to QUESTIONS and PROBLEMS posed throughout the book.
- Written accounts of Recent History of Energy Use interviews (p. 5).
- Results and conclusions from the Doing Work to Create Electricity investigation (pp. 6-7 of the Student Guide) and Using Electricity to Do Work (build an electric motor, pp. 10-11).
- The Energy Transformations challenge (p. 14)
- The How Much Energy investigation (p. 25).
- Written results from investigations Electric Metering (p. 65), What Are We Paying For? (p. 66) and Power Failure (p. 67), Comparing Light Sources (p. 69)
- Investigations on How Does the Thermos Bottle Know? (p. 77), Compute the R-Value (p. 78), and Refrigerators (p. 83).
- Analysis of energy transformations in the Automobile investigation (p. 91); Better Batteries (p. 98).
- Essays from the investigation Your Vote on Energy Measures (p. 106).
- Concept map of any of the chapters of the Student Guide.
In addition to portfolios, we suggest that you use assessment tasks both before and after presenting the unit. The papers that students’ complete before beginning the unit will help you diagnose their needs and adjust your plans accordingly. Comparing these papers to the students’ responses on the same tasks after completing the unit will allow you to determine how your students’ understanding and attitudes have changed as a result of instruction. Three tasks which we suggest be used for pre- and post- assessment are as follows:
2. Questionnaire
These questions are designed to determine how students’ knowledge of key concepts have changed during the unit, and whether or not they have changed their opinions concerning the importance of energy in their lives.
3. Concept Map
Asking students to create a concept map before and after the unit is one way to determine which concepts they have learned and their understanding of the connections among these concepts. If students have not had experience in concept mapping, you might want to start them out with a hand-out showing an example (master on p. 10), a general idea of what they are to map, and starting word(s) to help get them started. Once they have had experience with concept maps, they can create them on blank sheets of paper (no photocopying required). Alternatively, they can use concept mapping software such as
- Inspiration (http://www.inspiration.com)
- Decision Explorer (http://www.banxia.com).
- CMap (http://cmap.ihmc.us/conceptmap.html – free for noncommercial use).
- Omnigraffle (http://www.omnigroup.com/applications/omnigraffle Mac OSX)
- Freemind (http://freemind.sourceforge.net/wiki/index.php/
- Main_Page – open source software for mind-mapping.)
- Microsoft Draw (comes with Microsoft Office)
Some possible key words to use: energy, electricity, heat, conservation, nuclear, coal, power, power consumption, power plant, transportation, power industry, fuel cell, battery, electric, fossil, fuel, wind, hydroelectric, hydro, atom, work, motor, generator, incandescent, electric current, voltage, transformer, resistance, ampere, superconductor, conservation, efficiency, recycling, recycle, electric meter, lighting, light, life cycle, payback time, insulation, convection, electromagnetic, spectrum, refrigerator, automobile, gasoline, biofuel, hydrogen, electrosysis, natural gas, heat, mass transit, electric car, batteries, electrode, electrolyte, fusion, nuclear fusion, plasma, solar, photovoltaic, solar cell.
4. Energy Use Brainstorm
Ask students to brainstorm a list in response to the question, “How many different kinds of energy are there?” This question can also be used as a pre/post assessment tool. If the students generate their own personal list before you begin the unit, you can find out how their understanding has changed by having them make a new list at the end of the unit. Another good pre/post brainstorm question is “How does energy affect your life?”
These three tasks fall along a spectrum from traditional to nontraditional ways of assessing student progress. The Questionnaire is a traditional way to elicit student understanding. It assesses students’ abilities to express themselves as well as insights that they gained from the unit. The Concept Map is nonlinear. Students do not need to think in terms of sentences and paragraphs, and their ideas can flow more freely. Students who are more visual might be better able to show what they know on this task than on the Questionnaire. The Energy Brainstorm task is designed to see how students’ perspectives on energy have deepened as a result of this unit.
Interpreting Student Responses
The tasks should be interpreted in terms of the objectives listed above. In the questionnaire, questions correspond to the objectives as follows:
| Goal | Objective | Questionnaire Number |
| 1 | 1A | 1, 2, 3, 4, 5 |
| 1B | 1, 2, 5 | |
| 1C | 1, 2, 3 | |
| 2 | 2B | 1, 4, 6 |
| 2C | * | |
| 2D | 2, 3 | |
| 3 | 3A | 3 |
| 3B | 1, 3, 4 | |
| 3C | 1 | |
| 3D | 6 | |
| 3E | 6 | |
| 4 | 4A | 2, 3, 5 |
| 4B | ** |
* This objective is not addressed in the questionnaire,
but by several of the lab activities.
** This objective is addressed by many of the Questions and Investigations.We suggest that you pair students’ pre-and post-assessment papers and compare them. With the list of objectives in mind, look for changes in the students’ attitudes and understanding. As you look through your students’ papers, you’ll be able to jot comments for individual students concerning main points they may have missed, or praising them for their insights and ideas. After looking over all of the papers you will be able to write down some generalizations about what the class as a whole learned or did not learn during the course. Comparing students’ papers before and after instruction may show that they have learned more about some objectives than others, or that certain misconceptions persist while others have been corrected. Eventually, we hope to be able to provide sets of instructions (called “rubrics”) to score student papers with respect to course objectives; but we do not yet have enough student data to do this.
The three tasks are presented below. You may want to make two class sets of each of the tasks, using one color of paper for the pre-assessment measures and a different color of paper for the post-assessment measures.
Get PDF of the Assessment Tasks
A concept map is a way of displaying your knowledge about a certain subject area. It consists of a set of words in boxes representing the most important ideas. The boxes are connected by lines and words showing how the ideas in the boxes are related. For example, at right is a concept map about the United States.
Your task is to create a concept map about the way energy is used by humans. Your concept map should show ways of thinking about how society gets and uses energy. Start with the word “Energy” at the top. (If you’d like more space, you can draw your concept map on the back, or on another sheet of paper.)
[Concept Map page 2]

Name____________________________________ Date____________________
1. How many different forms of energy are there? (Make list)
2. How does energy affect your life?
~{}~
Objectives [] Planning [] Assessment [] Resources
Guides for each Chapter: 1 – 2 – 3 – 4 – 5 – 6 – 7 – 8 – 9 – 10
Index of TG Investigations
Guides for Each Chapter
Guide for Chapter 1
How People Use Energy
1-1. Energy Use Past and Present
- Do the students believe that the future world is in jeopardy? If not, why not? It they do, what do they consider the greatest problem? Do they suggest any solution? (This question could be repeated at the end of the course.)
Investigation 1.1 Recent History of Energy Use
- Ask each of the students to write down a brief description of any scene involving human beings now, in the past, or in the future. Have them place the descriptions in a common pile. Mix them up and then have each student select one. Below the description of the scene ask each student to write down how energy is being used in the scene depicted. Let the students take turns reading their ideas to the class.
- Ask the students to brainstorm the ways in which energy use contributes to the standard of living of the industrialized world. Write the suggestions on the chalkboard or on slips of paper. After the brainstorming session make source categories for the energy use items, such as fossil fuels, solar energy, gravity, etc. Sort and list the energy use items under their sources. Does the source listing show that our standard of living is primarily based on a particular fuel source? What are some of the impacts of that dependency?
- Ask the students to identify the number of different ways they use energy or the number of different kinds of appliances they use that their grandparents did not have.
- Suggest that the students start collecting clippings from the newspapers on energy-related topics; such as: the cost of energy; new power plants; nuclear power; the environmental impact of power generation; coal, oil, and natural gas; energy conservation, etc.
~{}~
Objectives [] Planning [] Assessment [] Resources
Guides for each Chapter: 1 – 2 – 3 – 4 – 5 – 6 – 7 – 8 – 9 – 10
Index of TG Investigations
Guide for Chapter 2
Energy Basics
Investigation 2.1. Doing Work to Create Electricity
The text provides a Laboratory Investigation for your students in which they use a simple electric motor as an electric generator. This shows that a motor and a generator are actually the same device, containing a coil of wire and a battery. This Investigation, when compared with the Investigation, Using Electricity to Do Work, are perfect to illustrate how an electric generator is the reverse of an electric motor, yet made of essentially the same parts.
Question 2.1 is excellent as a trigger for a discussion of Conservation of Energy, which is further elucidated in chapter 1 section III (Conservation of Energy).
The concept of field is important in physics. Several examples of fields (e.g. gravitational, electric, magnetic) will help your students understand how scientists explain “action at a distance.”
Following is a general definition of a field which you may find helpful in explaining it to your students: A field is a disturbance in space where an appropriate test object will experience a force. The choice of an appropriate test object will help to identify the differences among fields. For example, a gravitational field will exert a force on any object that has mass but not on something that has no mass (such as a photon or an idea). An electrical field will exert a force on an electrically charged object. A piece of wood, for example, will not indicate the presence of an electrical field. Brass and aluminum, although they are metals, will not experience a force in a magnetic field.
Using Electricity To Do Work
Background/History: In 1819, Hans Christian Oersted, a Danish physicist, was doing a classroom demonstration when he happened to place a compass near a wire through which current was passing. The compass needle, which normally points to magnetic north, went haywire and pointed at a right angle to the wire. Oersted was astounded and stayed after class to continue experimenting. He had discovered a connection between electricity and magnetism, and began the study of the electromagnetic force.
Although there were no telephones, computer networks or fax machines in those days, news of important discoveries traveled quickly. Oersted published his findings (in Latin) and other experimenters argued with Oersted’s results and perform more experiments. The names of some of the scientists involved in early discoveries about electricity included: Charles Augustin Coulomb (French), Andre Marie Ampere (French), Alessandro Giuseppe Volta (Italian). You may recognize some of their names by the units of electric charge, current, and force. Although there were no telephones, computer networks or fax machines in those days, news of important discoveries traveled quickly. Oersted published his findings (in Latin) and other experimenters argued with Oersted’s results and perform more experiments. The names of some of the scientists involved in early discoveries about electricity included: Charles Augustin Coulomb (French), Andre Marie Ampere (French), Alessandro Giuseppe Volta (Italian). You may recognize some of their names by the units of electric charge, current, and force.
Also working on electricity at about this time were Michael Faraday, an English physicist and chemist, and Joseph Henry, an American physicist. These scientists invented devices that converted electrical energy into mechanical motion. They came to be called electric motors.
Many of the appliances that you use incorporate an electric motor. Dish washers, tape recorders, CD players, power drills, electric toothbrushes, clothes washers and dryers, hair dryers, and many other electrical appliances use electric motors. For such a widely-used device, electric motors are not understood by most people. One of the best ways to learn how something works is to construct one yourself. In the following activity, you will make an electric motor powered by a six-volt battery.
Energy and Work
- Does it require work to turn a page? Yes! An object – a piece of paper – is moved through a distance by the force of contracting hand and arm muscles. Where does that energy come from? Use a question-and-answer approach to help the students trace that energy to its source – the Sun.
- If the wind blows the page over, is work being done? Can the students identify the energy transformations if you say the Sun did it? Page 16 Electric Charge
- If the weather is dry a number of static electric experiments can demonstrate for the students the concept of electric charge.
A simple electric charge detector
Straighten part of a paper clip so that it forms a straight wire sticking up from a short base. Tape the base to a desk or table so that the wire sticks straight up . Cut a 1 cm x 8 cm strip and fold it the long way. Balance it on top of the paper clip wire. If the paper moves about from drafts, find a spot that is not drafty, or set up a “wind barrier” with a book or manila folder.
Put an electrical charge onto a piece of plastic by rubbing it with a cloth. Rubbing a plastic ballpoint pen or ruler on your shirt should work well. Bring the end of the plastic close to one end of the balanced paper. Move the pen without touching the paper. What force moves the paper?
Try rubbing other objects with the same cloth and holding them close to the end of the paper. Try your finger; a coin; a piece of wood, or other kinds of plastic. Does the detector behave the same as it did with the pen? Why or why not? Which materials will carry an electric charge and which will not? Challenge the students to construct a hypothesis for why the plastic pen can maintain an electrical charge and a piece of wood or metal cannot. Is the hypothesis the same for wood and metal?
~{}~
Objectives [] Planning [] Assessment [] Resources
Guides for each Chapter: 1 – 2 – 3 – 4 – 5 – 6 – 7 – 8 – 9 – 10
Index of TG Investigations
Guide for Chapter 3
Fossil Fuels
3-1. What are Fossil Fuels
Question 3.1: The fossil fuel sources are coal, oil, and natural gas. This is a good time to have a discussion with students about how they use fossil fuels and petroleum products in their daily lives. One strategy is to form small groups and have each group generate a list of products/fuels that they use.
3-II. Effects of Fossil Fuel Production
Get a recording of John Prine’s song, Paradise, and play it for the students. It is far more effective to hear the song than to simply read the lyrics.
Here is also a good opportunity to explain more about chemical equations.
3-III. Effects of Burning Fossil Fuels
In regard to Question 3.10, you may want to have students estimate from the graph on page 23 when our fossil resources might run out. It is important to point out that oil and natural gas reserves will run out long before coal reserves.
~{}~
Objectives [] Planning [] Assessment [] Resources
Guides for each Chapter: 1 – 2 – 3 – 4 – 5 – 6 – 7 – 8 – 9 – 10
Index of TG Investigations
Guide for Chapter 4
Field Trip to a Power Plant
- The photos in the introduction trace the path of electricity from a home to the power plant. Have your students find out where the power plant is that supplies their school and/or homes with power. Have them trace a real path from their school/home to the power plant. Have them trace the energy path beyond the power plant: where does the energy for the power plant come from?
- Contact your local electric power company. See if a tour of their generating facilities can be arranged for your class.
- Some power companies have people that they will send to your classroom for a presentation on electrical energy generation and/or conservation.
- Set up a role play session concerning hearings at the State Power Utility Board concerning whether or not a new power plant should be built, and what kind of power it should provide. Assign roles—advocates in favor of building a fossil fuel plant, a nuclear power, hydroelectric, and a solar or geothermal plant; electric company officials; environmentalists; members of the community including business people who want lower electricity costs, and members of the State Utility Board who will decide what kind of plant, if any, should be constructed.
Your students can obtain additional information to help them prepare for the mock hearings by using the Reader’s Guide to Periodical Literature to locate relevant articles.
Solar-Thermal Electric Power
- The Edmund Scientific Company, Edscorp Building, Barrington, NJ 08007- 1380 (1-609-547-8880) sells equipment which converts solar energy into electricity, including: thin film silicon solar cells; miniature motors; parabolic reflectors; and science fair kits. Your students may wish to experiment with these. A free catalog is available.
~{}~
Objectives [] Planning [] Assessment [] Resources
Guides for each Chapter: 1 – 2 – 3 – 4 – 5 – 6 – 7 – 8 – 9 – 10
Index of TG Investigations
Guide for Chapter 5
America Plugged In
5-II. Wiring Up the CountryAC power won the battle for a national electricity distribution system because it could be transmitted long distances relatively cheaply. This was made possible by the transformer which works with AC power, but not DC power. How does an electrical transformer work?
As we saw during the investigation of an electrical generator in Chapter 2, when a coil of wire is made to turn in a magnetic field an alternating electric current is made to flow, or induced in the coil. If this alternating electric current is sent through another coil a constantly changing magnetic field is produced around that coil. It builds up as the current increases its flow in one direction and collapses when the current stops. It builds up again as the current flow increases in the reverse direction.
To concentrate this magnetic effect the coil that receives the energy is wound around a soft iron armature. It is called the primary coil. If another coil is also wrapped around the armature an alternating current will be induced within this secondary coil. This is how a transformer is made.
If the secondary coil has twice as many windings as the primary the voltage induced in the secondary coil will be twice that of the primary. This is called a step-up transformer. It will change 10 volts to 20 volts, or 4 volts to 8 volts. A transformer whose secondary windings are three times that of the primary will triple the primary voltage.
This is not a violation of the law of conservation of energy, which says that we can never get something for nothing. The increase in voltage in the secondary coil of a step-up transformer is accompanied by a decrease in amperage of the current running through it. In addition, there is a small amount of electrical energy “loss” due to a slight heating effect in the coil. Modern transformers are among the most efficient machines in the world. Less than 1% of the energy input is converted to heat.
A step-down transformer changes higher voltages to lower ones by having more windings in the primary than in the secondary coils. Voltage, the measure of electrical force, is an important factor in moving electricity from one place to another. High voltage, like 15,000 or 25,000 volts, is much more efficient for this purpose. The high tension lines that carry electrical energy long distances are high voltage in wires strung between the towers that stretch from generating plants to cities and substations. But high voltage is dangerous. For household and ordinary working purposes 115 volts provides safe, adequate power. Step-up and step-down transformers do the job of providing the proper voltages for electrical transmission and use.
5-IV. ConclusionVolts and Amps
- In order to understand the chapters about electricity, it is important that your students understand a simple electric circuit. Test your students by asking them to draw a battery and a bulb, and to show how to connect them with wires in order to make the bulb light. It is a common misconception that a bulb (or other device) only needs to be connected to one side of a battery, so that the electricity can flow from the battery “into” the device. If your students have such misconceptions, it is important for them to have hands-on experience in building simple circuits with batteries and flashlight bulbs. A “classic” series of activities on simple electric circuits is the Elementary Science Study unit Batteries and Bulbs, published by the Webster Division of McGraw-Hill Publishing Company.
- Following is a suggestion for further clarifying the water flow analogy of the difference between volts and amps. Draw the following diagram on the chalkboard.
Explain that the tank in the drawing holds a quantity of water. Pressure at the bottom of the tank makes water flow through the pipe. A valve controls the flow of water out of the pipe.
In this analogy, the stored water is like chemical energy in a battery, since they are both stored, or potential energy. Just as the weight of the water in the tank exerts a force which pushes the water through the pipe, chemical energy in the battery exerts a force which pushes electrons through a wire. The rate of water flow through the pipe is analogous to the flow of electrons through the wire. The valve is analogous to an electrical switch, allowing the electrons to flow or not to flow in the wire.
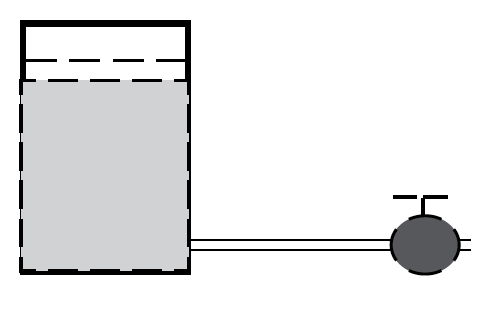
In the water tank, the force which pushes water through the pipe is called gravity, and it is measured in pounds. In the battery, the force which pushes electrons through a wire is called the electromotive force, and it is measured in volts. The rate of flowing water in the pipe is called the water current; and it is analogous to the rate of flowing electrons in the wire, called the electric current. Electric current is measured in amps. To complete the analogy – the power of the flowing water depends on the pressure and the amount of water flowing through the pipe. In electrical terms P = V x I.
If you present this analogy to your students, it is important to discuss ways in which the water analogy breaks down. For example: 1) In an electric circuit it is important to connect wires to both sides of the battery, since current cannot simply flow “out” of a battery as water flows out of a tank. 2) In order for the valve to allow water to flow through a pipe, it must be open; but a switch must be closed in order to allow electrons to flow through a wire. Finally, 3) a pipe is hollow; while an electrical wire is made of solid metal. When electrons flow through a wire, they must flow around the nuclei of metallic atoms.
Power
- An average car has about 100 horsepower. How many 100 watt light bulbs have the equivalent power?
One hp = 746 watts The average car, therefore, has 74,600 watts of energy, the equivalent of 746 100-watt light bulbs.
Resistance
The amount of current that flows depends on the material that the electricity must travel through. Materials through which electric currents can flow are called conductors. Copper and aluminum are conductors are widely used in electric wires. In these and most other metals there are electrons that are not bound to particular atoms, and these electrons can flow fairly freely through the material.
But even in good conductors, there is always some resistance. Electrical resistance, R, is defined by the amount of current, I, caused by a voltage, V, in the formula:
R = V / I
In only a few materials called superconductors, which operate only at very low temperatures, do electric currents flow absolutely freely.
What Happened to Edison and Tesla?
After he developed the light bulb, Edison continued to be productive in many fields including motion pictures, sound recording, telephone systems, and X-ray technology. Financier J.P. Morgan arranged for Edison Electric to merge with other power companies to become General Electric. Westinghouse and General electric still dominate the electric power business.
Tesla, having developed the basic power system that is still in use today, pursued his dream of a wireless power distribution system. He worked independently with funds provided largely by J. P. Morgan, who was interested in the development of wireless communication (radio). Tesla laid the foundation for the development of radio, but his obsession with wireless power distribution kept him from competing with other radio inventors who built upon his ideas. Tesla worked in robotics, remote control and X-ray technology. He is best known for his high frequency transformers, called Tesla coils, which can produce millions of volts. He never prospered, perhaps because some of his ideas were ahead of their time, and others were downright farfetched. After his death his name fell into relative obscurity for decades. The unit of magnetic field intensity bears his name.
~{}~
Objectives [] Planning [] Assessment [] Resources
Guides for each Chapter: 1 – 2 – 3 – 4 – 5 – 6 – 7 – 8 – 9 – 10
Index of TG Investigations
Guide for Chapter 6
Energy in Society
The Big Picture
- If you haven’t already used the graph of fossil energy use in chapter 3 section III (Effects of Burning Fossil Fuels) of the student book, it can be used here to put our age of fossil fuel use in perspective.
What does a gallon of gasoline really cost us as a society?
This question cannot be answered simply, since it is difficult to place a value on health, preservation of species, or beauty of nature. What is called for is a thoughtful consideration of the various ways that a gallon of gasoline impacts the lives of people, wildlife, and the global environment.
Answers to questions 6.1-6.5
6.1. What happens to the energy in coal (equivalent to 41 million barrels of oil) that is mined every day?
- Equivalent energy of 13 million barrels of oil goes directly to industry.
- 20 million barrels is converted to electricity.
- 1 million barrels is used for non-energy uses like making plastics, etc.
- 1 million barrels goes directly to transportation
- 6 million barrels is used in buildings
6.2. What happens to the energy in natural gas?
- Equivalent energy of 2 million barrels of oil goes to non-energy uses.
- 3 million barrels leaks out of pip lines.
- 8 million barrels goes directly to industry.
- 8 million barrels is used in buildings.
- 7 million barrels is converted to electricity
- (Note: this adds up to 28 Under Natural Gas the diagram shows 29. This is an error in the diagram which will be corrected in the next edition.)
6.3. What percentage of energy in each different fuel is “lost” when it is changed from one form to another?
- When oil, coal, natural gas, hydropower, and nuclear power are changed to electricity, 70% is “lost” to low grade heat. (That is why it is cheaper to heat homes directly with natural gas than to turn the natural gas into electricity, and use an electrical home heater.)
6.4. How much energy in the form of electricity is deliverd to the end users daily and how much primary source energy is needed to produce that energy?
- 5 million barrels equivalent electricity gets to end users. Since efficiency is 30%, 0.3X = 5, so X = 17 million barrels of source energy is needed.
6.5. What might be some non-energy uses for coal and natural gas?
- Coal: “coke” for making steel? Natural Gas: manufacture organic chemical products.
How do the sources of energy used to generate electricity in the world compare with the sources of electricity in the United States? What might account for the differences? (See chapter 4)
| US | World – 48 million barrels total | |
| Fossil fuels | 73% | 33 million barrels or 68.7% |
| Hydroelectric | 12% | 9 “ “ “ 18.7% |
| Nuclear | 15 % | 6 “ “ “ 12.5% |
| Other | <1% | |
The selection of fuel depends on the resources available within the country. Countries that have swift rivers utilize hydroelectric power; those with coal and oil deposits depend on these fossil fuels.
To what extent are “other” fuels used directly by residences for heating and cooking? (What materials are used as fuels for heating and cooking in developing countries?)
Of the total 43 million barrels energy equivalent for residential and commercial use, 15 of them represent wood, wind, solar and biomass energy sources. That is 34.8% In some countries peat and dried dung provide fuel from biomass for cooking and heating.
6-IV. How Everyone Can Help Industry Conserve
- The graph in this section is an important piece of evidence to show that conservation makes a difference. As the text describes, how people think and what they do can result in huge changes in energy use. Ask your students to describe what was happening in each of the three sections of the graph; the periods, 1960 – 1973, 1973 – 1986, and 1986 – end of data.
- Ask your students to estimate how the lines on the graph continue to the present time. What reasons do they give for their estimates. Are many people concerned about increased automobile fuel efficiency today? What has happened to the GNP over the last several years?
~{}~
Objectives [] Planning [] Assessment [] Resources
Guides for each Chapter: 1 – 2 – 3 – 4 – 5 – 6 – 7 – 8 – 9 – 10
Index of TG Investigations
Guide for Chapter 7
Energy For Lighting
For an excellent resource on lighting energy efficiency issues, have student do a web search for “International Dark Sky Association” and explore that site.
Investigation 7.1. Comparing Light Sources
This Investigation is rich with possibilities for exploration of variables, what with all the variety of lights that are on the market.
Investigation 7.2. Method 1: Life Cycle Cost
The concepts of Life Cycle Cost and Payback time are critical in planning for long-term sustainability of energy systems. It is irresistably tempting to make purchases based on least cost of initial investment, without looking at the long-term cost.
~{}~
Objectives [] Planning [] Assessment [] Resources
Guides for each Chapter: 1 – 2 – 3 – 4 – 5 – 6 – 7 – 8 – 9 – 10
Index of TG Investigations
Guide for Chapter 8
Energy for Heating
Investigation 8.1. How does a thermos bottle work?
A Thermos® bottle is an excellent insulating container It is made with two walls, usually glass, with a vacuum in between. An outside wall of plastic or metal is usually added so that the glass will not break easily. Have you ever seen the glass on an inside of a thermos bottle? It is usually coated with a mirror-like layer of metal. When radiant energy crosses the empty space between the walls of the bottle, the metal coating bounces the radiation back to where it came from.
Investigation 8.2. Compute the R-Value of a Material
The concept of R value is discussed in the text. Starting on the next page is an activity in which students actually measure the R valueof materials. To make this into an experiment, each team will need to make predictions and then compare the R value of the material that it measured with the R value measured by other teams. This can be made easier by listing the materials on the board in order of increasing R value, and asking the students to look at the list and see if they can determine any generalizations about which kinds of materials make better insulators.
So that students may gain confidence in the results that they obtain from their investigations, you might have two or three teams test the same material independently, and compare their results. The final R value might be an average of the teams’ results.

TG-EU8-1. Investigation:
Measuring R value
How is R value measured? In this activity you’ll create your own apparatus to find out.
Commercial thermal labs in the United States follow guidelines set by the American Association for Testing Materials (ASTM). The ASTM’s published set of standards takes ten pages to describe the proper way to determine R value. You may go to an engineering library and read them yourself, but here they are described briefly.
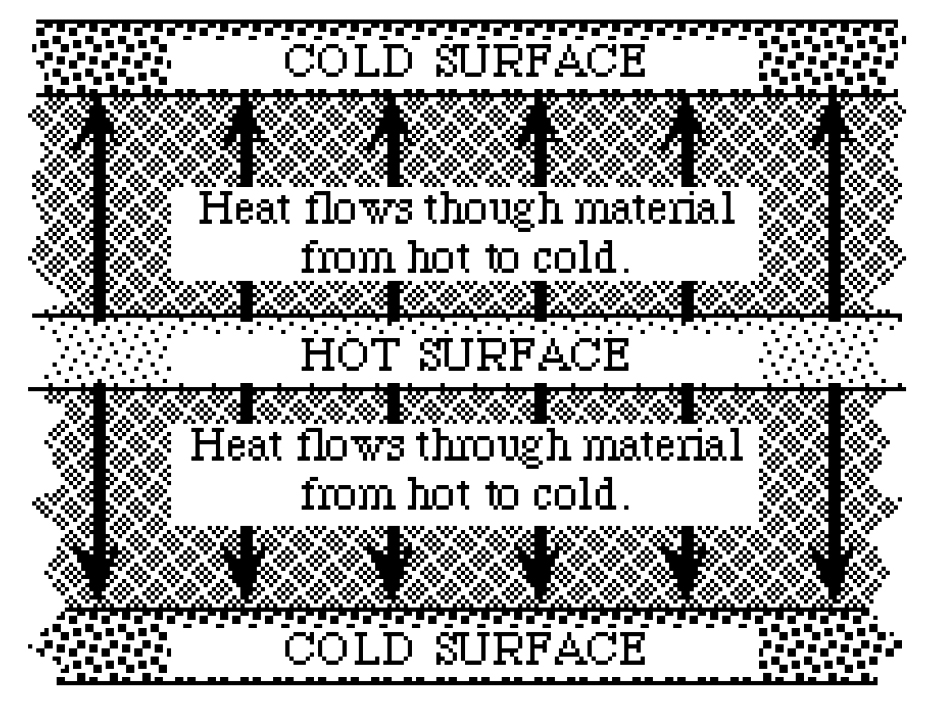
The apparatus that measures R values has a heater at its heart. The heater is wide and flat and is equipped with sensors that measure temperature. On the top and the bottom of the heater is the material to be tested, and then on the top and bottom of those there are cold surfaces, also with temperature sensors.
In this activity you will use a simpler and less precise version of this method. Each team of students can investigate the insulating properties of a different material. Some teams might investigate the same material as a way of checking accuracy. If there is time, trade materials with another team and check their results.
Materials
1 lab thermometer
1 gallon sized plastic bag with zip-style seal
1 quart sized plastic bag with zip-style seal
1 dish tub (or large bucket or other container)
1 clock or watch
4 rubber bands
1 bag of ice, 3 lb. or more
1 roll of tape
1 strip of cardboard
1 1/2” x 26”
1 500 ml beaker
1 ruler marked in centimeters
2 sheets of test materials: These are 8” x 9” rectangular pieces of test material. Suitable materials include window glass, wood, metal sheets, foam board, cardboard, folded newspaper, sheet rock or any building material that is less than one inch thick. You could also test fabric from an old summer shirt and a rectangle cut from an old wool sweater
Setting Up
- Prepare your test material by making sure that you have two 8” x 9” pieces of it. If the test material has not been cut ahead of time then see your teacher about tools and safety procedures for cutting the materials.
- Prepare the cold bath for your test. Fill the tub with cold tap water and add plenty of ice.
- The quart sized bag is your heat source. Fill it with exactly 500 milliliters of hot water from the tap. Even tap water can be dangerously hot so use a mix of hot and cold if the temperature is uncomfortable (above 120 °F or 50 °C.) Seal the bag so that there is a minimum of air bubbles inside. Dry the outside. Start over with a new bag if the old one leaks.
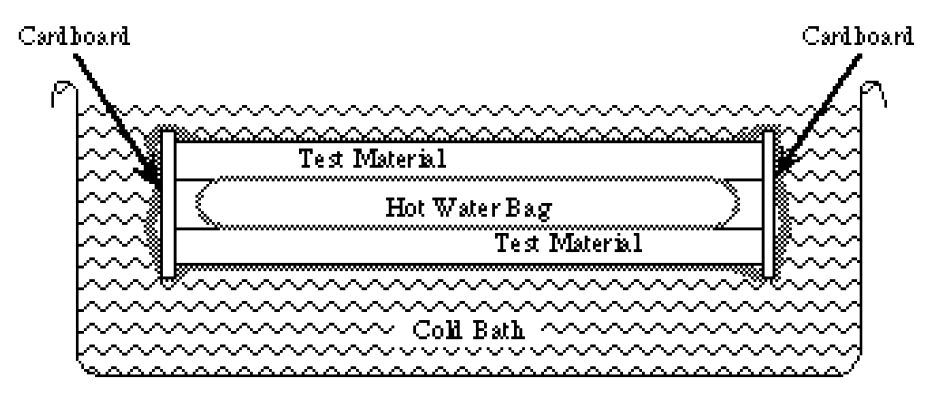
- Sandwich your heater bag between the two rectangles of test material. Use rubber bands to hold it all together. Bend the 1-1/2” wide strip of cardboard around three sides of the sandwich. Use tape or more rubber bands to keep it there. Put the whole thing into the gallon-sized bag. The end of the sandwich that does not have the cardboard on it should be toward the mouth of the bag. Try to seal it with a minimum of air trapped inside. 5. Put it in the water. It will float so take turns holding the bag under the water. For the first two minutes the heat flow will not be steady at all. The system needs some time for the inside surfaces of the test material to reach the temperature of the hot water bag and the outside surfaces to reach the temperature of the cold water bath.
Taking the measurements
- After two minutes in the cold bath it is time to measure temperatures. Do not assume that the water bath will be at the melting temperature of ice. It may be a few degrees warmer. Measure it and write it down. To measure the inside of the system you will have to pull the opening of the gallon sized bag out of the water. Open it just enough to let the thermometer in and slip the thermometer between the hot water bag and the test substance. Write down the temperature. Seal the bag again and keep it under water for another ten minutes.
- After ten minutes take the same temperature measurements again and write them down. Now that you have recorded the temperatures you need to measure the area of the hot water bag that is in contact with the test material.
- Take apart your sandwich and use the ruler to estimate the area of the bag that was in contact with the test material. Make the most accurate estimation of the area in square centimeters that you can. Remember to include both sides of the hot water bag. Write down the area.
Calculating R
- Calculate R value according to the formula:
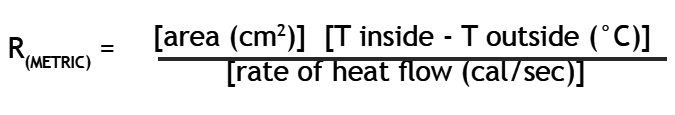
a) For the area factor use the estimated area of contact between the hot water bag and the test material.
b) Now you need T inside, the temperature of the hot water bag on the inside. Since it changed during the ten minutes of the experiment, find an average temperature of the heater using the temperature at the start and at the end of the ten minutes. Now do the same for the cold bath to find T outside. Subtract the cold average from the hot average to find the difference between the temperature of the cold side of the test material and the hot side of the test material.
c) Now all that you need is the rate of heat flow. The experiment lasted ten minutes. So far we have been using metric units so let’s continue by converting the time to seconds as is customary. You can find the amount of heat that passed out of the hot water bag because you know the volume of water in the bag in milliliters. Multiply the volume of water (500 ml) by the drop in temperature of the water over the ten minutes. This gives the heat loss in calories. The rate that the heat flowed out of the bag is simply the number of calories that left the water divided by the number of seconds it took them to leave.
- Once you have calculated the metric version of R value, convert it to the R value in units customary among builders in the United States. An hour is 3600 seconds, a BTU is 252 calories, a square foot is 929 square centimeters, and a difference in temperature of one degree Celsius is the same as a difference in temperature of 1.8 degrees Fahrenheit.
- Test other materials, if you can, and see which are the better insulators. Exchange results with the other teams of students and list all the materials in order according to the R values that you measured.
Questions
- In a commercial testing lab an R value apparatus has systems that make sure all the heat flow that is measured is actually passing straight through the test materials. In words or pictures can you describe how some of the heat in your experiment might have passed from the hot water bag to the cold bath without going straight through your test materials?
- Were there any inconsistencies between the measurements of one team and another team who tested the same material? If so, are you able to explain them? Do they affect your ability to rank the materials in order of increasing R value?
- Can you think of other materials to test that might have a high R value?
- Hot air has less density than cold and so it tends to float upward. Therefore the temperature difference between the inside of the ceiling and the outside of the roof is usually greater than the difference between the inside and outside of the walls. Can you see why it is especially important to have a material with high R value in the ceiling?
Refrigerators and The Second Law of Thermodynamics
You may add to the discussion questions this one:
- What did Bert’s mother mean when she said, “Close that refrigerator! It’s too hot in here already!”? Does her request make sense?
Have students answer these questions
- In your own words, what happens to the electrical energy that goes into a refrigerator?
How does the refrigerator make it cold inside? - Why does an air conditioner work best when the doors and windows are closed?
How a refrigerator works
A refrigerator is essentially an insulated box with a system of pipes that have a “working fluid” flowing through them. The refrigerator depends on heat transfers when the working fluid evaporates (changes from liquid to gas) and again when the working fluid condenses (changes from gas back into a liquid).
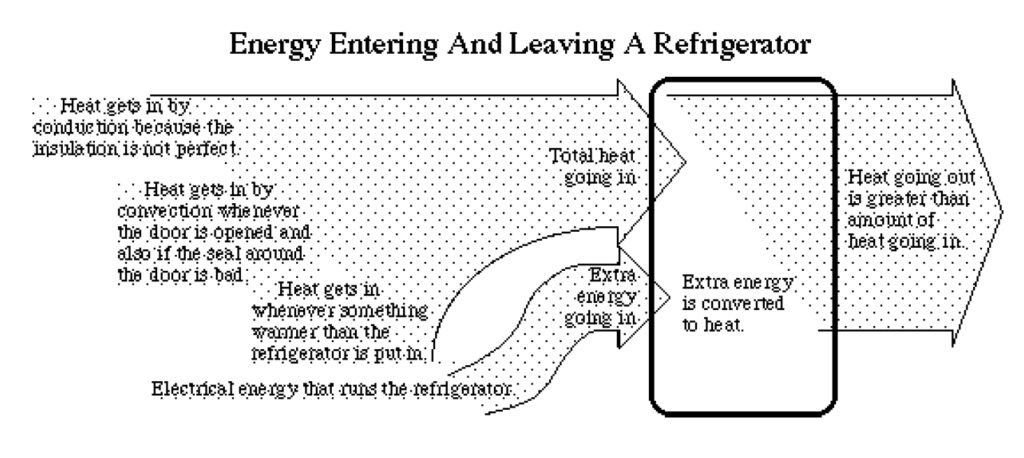
In the part of the system of pipes that is inside the insulating box, the working fluid is evaporating by absorbing heat from inside the box. In the part of the system of pipes that is outside the insulating box, the working fluid is condensing by radiating heat to surrounding air outside the box.
More on the Second Law and Efficiency
What is the coldest place you can imagine? The North Pole? The frosty moons of Neptune? Intergalactic space? How about a freezer? A typical freezer gets down to about – 10°C. Not all freezers are typical and throughout the history of cryogenics—the science of low temperatures— devices have been developed that create ever lower and lower temperatures. The science of cryogenics was put on its feet when James Dewar created a refrigerator to produce large quantities of liquid oxygen in the late 1800’s. He also invented the container to store it in, known as the Dewar, which is the double walled glass bottle with a vacuum between the walls that so many of us call Thermos bottles. Oxygen liquefies at 183°C below zero, but in the decades that followed much colder temperatures were reached. Nitrogen was made to freeze solid at -210°C, hydrogen was liquefied at -252.5°C, and helium was liquefied at -269°C.
Dewar and his cryogenic colleagues knew that there was a limit to how cold they could go. Why? Because their theories were based on the fact that the energy of heat is the motion of molecules. An object whose molecular motions are at an absolute minimum is at the absolute lowest possible temperature. The amount of heat energy is simply zero. This temperature is often called absolute zero. Absolute zero is -459.67°F and -273.15°C. The Kelvin scale of temperature was created so that absolute zero really is zero.
No one can get any heat out of an object that is at 0° K. Since the 1960’s temperatures as low as .000001 K have been achieved in laboratories. The temperature of intergalactic space is about 2.7°K. (This temperature is due to the heat that is left over from the “Big Bang,” when the universe was formed.) A cryogenic freezer on earth, therefore, might be the coldest place in the universe.
Since typical temperatures on the earth are hundreds of degrees above 0°K there is a great abundance of energy in the form of heat around us. Sometimes heat is just what we want, but our energy needs also include light, transportation, electricity, and many other non-heat forms. Wouldn’t it be a dream come true if we could draw all the energy we want from the vast amount of heat around us? How could you convert the energy in heat to other useful forms such as motion or electricity?
~{}~
Objectives [] Planning [] Assessment [] Resources
Guides for each Chapter: 1 – 2 – 3 – 4 – 5 – 6 – 7 – 8 – 9 – 10
Index of TG Investigations
Guide for Chapter 9
Energy for Transportation
9-II. Getting the Most From a Car
Problem: Two people, in their everyday commute, drive through a series of twenty well-timed stoplights. Stephan U. Hotshot accelerates rapidly and brakes to a complete stop at each light. Stephanie B. Kule maintains constant speed and never has to stop. Based on materials replacement (brakes) and energy costs, compute whether or not Stephanie wins her bet with Stephan that her more careful driving habit will save enough money in 3 years to buy a CD player for her car. Make the following assumptions:
- Stephanie and Stephan each commute 240 days per year.
- It takes 1.5 cents worth of gasoline to accelerate either car from a standstill to cruising speed (the speed limit).
- It costs $300 to replace brakes (including parts and labor).
- Each time the car comes to a stop, 0.008% of the brakes are used up.
- Each time Stephan stops, he brings his 800 kg. car from a speed of 56 kilometers per hour to a “rolling stop” of 6 km/hr. (See the following “miraculous brakes” exercise to find out how calculate the energy lost in braking — ignore the conversions to calories, stick with “joules” as your unit of energy.)
- The new CD player costs $200.
~{}~
TG-EU9-1. Investigation: Electrolysis
See if you can reproduce the experiment that English chemist William Nicholson performed in the year 1800. In that year, Nicholson heard of Volta’s invention of the electric battery, which was called a “Voltaic pile.” Nicholson built his own Voltaic pile, the first in England, and proceeded to attached wires to it and place the wire in water. With current flowing, bubbles of oxygen and hydrogen formed.
Materials
1 six volt lantern battery with screw terminals
1 8” aluminum pie pan
2 lengths of multi-strand wire 2 feet long stripped 1” at each end
1 test tube, at least 15 ml
1 teaspoon salt
1 roll of tape
1 pair goggles
1 book of matches
1 splint of wood, about 6”
Procedure
- Attach one end of a wire to the positive terminal of the battery. Flatten out the strands at the other end of the wire and tape it to the outside of the pie plate so that it makes good electrical contact. Now fill the pan with about 500 ml water and stir in about five teaspoons of salt.
- Prepare the test tube to collect the hydrogen. Immerse the test tube in the salt water allowing all of the air to escape. Keep the mouth of the test tube under the water and stand up the test tube so that it is upside down and completely full of the water. If there are large air bubbles trapped in the tube, try again.
- Spread out the strands on one end of the unused wire and push it up a little way into the water-filled test tube without letting in any air. The other end of the wire goes to the negative terminal of the battery. Before attaching it make sure that the strands of wire in the test tube are not touching the pie pan.
- Attach the other end of the wire in the test tube to the negative terminal of the battery. Watch the apparatus. What do you notice? A gas should be foaming up from the wire in the test tube. This is the hydrogen. It is oxygen. Since there is twice the number of hydrogen atoms than oxygen in water you might expect that there is about half the volume of gas forming on the pie plate than the volume of hydrogen in the test tube. Does it look like this is what is happening? If it is not happening that is because chemical compounds are forming with the oxygen and the salt. These by-products will give the water a cloudy grayish look and render it unsuitable for drinking.
- Allow the test tube to fill until it is nearly full. If the wire in the test tube becomes high and dry then gently pull it down into the water without letting it touch the pie pan and without letting air into the test tube or hydrogen out of the test tube. The time it takes to fill the tube will depend on the freshness of your battery and of course the size of the tube. When it is full disconnect the battery.
Burning the hydrogen
- The very word “hydrogen,” with its two parts, hydro- and -gen, means “produces water.” You just did the reverse: You consumed water to produce hydrogen gas. You also consumed electrical energy. Your next job is to get the energy back by using the hydrogen to produce heat energy and water.
- Make sure you are wearing your goggles now. Keep the mouth of the test tube pointing down and slowly lift it from the water. Because hydrogen gas is less dense than air, it will stay in the inverted test tube as long as you keep it with its mouth downward and do not move it around quickly. Have someone light the tip of a wood splint with a match. When it is burning steadily hold it so that the flame is at the top of the wood above the level of your hand. Hold the test tube below the wood and turn it to “pour” the hydrogen upward onto the flame. Be prepared for the release of energy in the form of a “pop” when the hydrogen burns rapidly.
Questions
- If you did the experiment as described above then you used chemical energy from a battery to create the electricity. What are the drawbacks in terms of cost and environmental effects of using a battery this way?
- Can you think of another source of electricity for producing hydrogen that might cause less environmental harm and might even be less expensive? Could you test your idea safely at your school?
- How much energy did you consume to separate hydrogen out of the water? The amount of energy drained from the battery is the voltage of the battery times the absolute value of the charge that the battery delivers. Use these facts:
- Each milliliter of hydrogen gas has 2.69 x 10 19 molecules.
- It takes two electrons to release each molecule of hydrogen.
- An electron carries a charge of -1.6 x 10 -19 coulombs.
- You will also need to measure, or at least estimate the volume of hydrogen that you produced.
~{}~
Objectives [] Planning [] Assessment [] Resources
Guides for each Chapter: 1 – 2 – 3 – 4 – 5 – 6 – 7 – 8 – 9 – 10
Index of TG Investigations
Guide for Chapter 10
Our Energy Future
This chapter concludes the unit by offering alternative strategies for solving the long-term problem of producing energy for the world’s growing population at a minimum impact on the environment. Following are some suggestions for helping the students synthesize what they have learned in previous chapters, and formulate a personal response.
- Assemble news clippings into a poster or paper, highlighting the important energy-related issues of the today.
- Get help from your local energy utility company to complete an energy inventory of your school, and identify places where savings can be made.
- Expand the ideas under “In Your Opinion,” to include actual issues found in news clippings, and conduct mock legislative sessions to determine whether or not any of the proposals have merit.
- Write short stories that depict alternative energy futures.
~{}~
Objectives [] Planning [] Assessment [] Resources
Guides for each Chapter: 1 – 2 – 3 – 4 – 5 – 6 – 7 – 8 – 9 – 10
Index of TG Investigations
Index of Teacher Guide Investigations
- TG-EU8-1. Measuring R value
- TG-EU9-1. Electrolysis
~{}~
Objectives [] Planning [] Assessment [] Resources
Guides for each Chapter: 1 – 2 – 3 – 4 – 5 – 6 – 7 – 8 – 9 – 10
Index of TG Investigations
References for Energy Use
For latest material relevant to Energy Use,
see the Stay Current section of the GSS website.
The list below is from the original development of GSS and is out of date and in no way exhaustive for the resources that are available for teaching ecosystem change and related topics.
Amatek, Inc., Solar Energy Handbook, 2nd ed., Chilton Book Company, Radnor, Pennsylvania, 1984.
American Council for an Energy-Efficient Economy (ACEEE) many publications including Green Guide to Cars and Trucks: Model Year 1999; Summer Study on Energy Efficiency in Buildings, 1998; website: http://aceee.org/
“Another Crude Year,” Discover, Vol. 12, No. 1, pages 70, 71, Jan. 1991.
Bevington, Rick, Arthur H. Rosenfeld, “Energy for Buildings and Homes,” Scientific American, Vol. 263, No., pages 76-86, September 1990.
Bleviss, Deborah L., Peter Walzer, “Energy for Motor Vehicles,” Scientific American, Vol. 263, No. 3, pages 102-109, September 1990.
California Energy Commission —http://www.energy.ca.gov/
Center for Renewable Energy and Sustainable Technology (CREST)— http://solstice.crest.org/index.shtml
Chandler, William U., Alexei A. Makarov, Zhou Dadi, “Energy for the Soviet Union, Eastern Europe and China,” Scientific American, Vol. 263, No. 3, pages 120-127, September 1990.
Christensen, John W., Global Science, Kendall/Hunt Publishing Company, Dubuque, Iowa, 1991
Davis, Ged R., “Energy for Planet Earth,” Scientific American, Vol. 263, No., pages 54-62, September 1990.
DeCicco, John, Transportation Energy Trends and Issues through 2030 , December, 1997.
Energy Efficiency and Renewable Energy Network (EREN) from DOE Office of Energy Efficiency and Renewable Energy. EREN is a WWW site (http://www.eren.doe.gov ) that serves as a single point of access to qualitative information on energy efficiency and renewable energy technologies. EREN is searchable by subject, an alphabetical listing of sites, type of service, and type of organization.
Fickett, Arnold P.,Clark W. Gellings, Amory B. Lovins, “Efficient Use of Electricity,” Scientific American, Vol. 263, No., pages 64-74, September 1990.
Fulkerson, William, Roddie R. Judkins, Manoj K. Sanghvi, “Energy from Fossil Fuels,” Scientific American, Vol. 263, No., pages 129-135, September 1990.
Häfele Wolf, “Energy from Nuclear Power,” Scientific American, Vol. 263, No., pages 136- 144, September 1990. Holdren, John P., “Energy in Transition,” Scientific American, Vol. 263, No., pages 156-163, September 1990.
Koolakian, Robert G., and the Edison Electric Institute, Lewis Howard Latimer: A Black Inventor, Edison Electric Institute, Washington D.C. 1993.
Natural Resources Defense Council (NRDC; http://www.nrdc.org/), Energy Innovations: A Prosperous Path to a Clean Environment, June 1997.
Reddy, Amulya K. N., José Goldemberg, “Energy for the Developing World,” Scientific American, Vol. 263, No. 3, pages 110-118, September 1990.
Rocky Mountain Institute, Home Energy Briefs (online publications) 1997; http://www.rmi. org/hebs/hebtoc.html; homepage at http:// www.rmi.org/
Ross, Mark H., Daniel Steinmeyer, “Energy for Industry,” Scientific American, Vol. 263, No. 3, pages 88-98, September 1990.
Solomon, Gina M. , Todd R. Campbell, Tim Carmichael, Gail Ruderman Feuer and Janet S. Hathaway, Exhausted by Diesel: How America’s Dependence on Diesel Engines Threatens Our Health. April 1998.
Sperling, Daniel , “The Case for Electric Vehicles” Scientific American, November 1996.
Weinberg, Carl J., Robert H. Williams, “Energy from the Sun,” Scientific American, Vol. 263, No. 3, pages 146-155, September 1990.
Wilson, Alex and John Morrill, Consumer Guide to Home Energy Savings , 1998 World Resources Institute, World Resources 1994-1995, World Resources 1998-99, Oxford University Press, New York, 1994, 1998; World Resources Institute web page at http://www.wri.org/
Yonas, Gerold, “Fusion and the Z-Pinch “, Scientific American, August 1998.