TG Energy Flow
{ GSS Teacher Guide Index } { All GSS Books }

~{}~
Objectives [] Planning [] Assessment [] Resources
Guides for each Chapter: 1 – 2 – 3 – 4 – 5 – 6 – 7 – 8 – 9
Index of TG Investigations
Teaching Objectives
Energy Flow is about the ways that energy from the Sun and from deep inside the Earth flow through the atmosphere, oceans, land, and living things. The four goals for the unit Energy Flow, and the objectives which support these goals are summarized on this page.
Goal 1: Students will appreciate the wide diversity of energy forms in the world and how energy constantly flows around and through us.
- Objective 1A: Students are familiar with basic forms of energy such as kinetic energy, potential energy, chemical energy, nuclear energy, electrical energy and electromagnetic radiation.
- Objective 1B: Students can identify the basic sources of energy on Earth—nuclear fusion in the Sun, nuclear fission inside the Earth, gravity, and material falling to Earth from space.
- Objective 1C: Students can describe some forms of energy from the perspective of the atomic theory of matter.
Goal 2: Students will realize the implications of energy in small scale and large scale systems of the Earth and how human actions can change the flow of energy.
- Objective 2A: Students are able to recognize static and dynamic equilibrium in systems.
- Objective 2B: Students can explain how massive flows of energy can result in catastrophic events, such as earthquakes, volcanoes, hurricanes, and tornadoes.
- Objective 2C: Students can perform experiments to determine what factors affect the energy flowing around them.
- Objective 2D: Students are able to explain how the greenhouse effect results from the interaction of infrared and visible sunlight with various gases in the atmosphere.
Goal 3: Students recognize sources of energy and how energy changes from one form into another.
- Objective 3A: Students can point out how the Law of Conservation of Energy applies everywhere.
- Objective 3B: Students can identify any flow of energy as one of three basic forms—radiation, conduction, or convection.
- Objective 3C: Students are able to describe how volcanoes result from movement of magma inside the Earth, which in turn is driven by convection currents and heat from nuclear decay of heavy elements.
- Objective 3D: Students appreciate the implications of the impact of a large meteor or asteroid on Earth.
Goal 4: Students realize the significance of energy in their lives and how each person affects the flow of energy on the planet.
- Objective 4A: Students can trace the path of energy all the way from the Sun, through the atmosphere, into plants, animals, and into their own bodies.
- Objective 4B: Students recognize ways that their personal activities depend on various energy transformations.
~{}~
Objectives [] Planning [] Assessment [] Resources
Guides for each Chapter: 1 – 2 – 3 – 4 – 5 – 6 – 7 – 8– 9
Index of TG Investigations
Planning Your GSS Course
Global Systems Science is intended to be an inquiry-based course, with many hands-on laboratory activities and interactive discussions; but the extent to which it is based on inquiry depends on you!
The student guide, Energy Flow, contains four laboratory experiments (chapter 3, 6, and 7). This teacher’s guide provides additional activities and ideas for you to enrich your course. High school teachers who participated in a GSS INSTITUTE in 1995 prepared many of these additional activities. Each of these activities is located in the chapter to which they are most appropriate.
Most of these activities, those in the student guide as well as those in this teacher’s guide are meant to be adjusted to fit the needs of your curriculum. You may add to or delete segments of each of these as you see fit. Feedback is welcome on all of them since they are all works in progress.
When you have completed this unit, you may want to continue with other GSS units that follow from Energy Flow. Examples may be found in the Customizing GSS page in the Basic GSS Overview.
The ideas presented in the Chapter-by-Chapter notes are just suggestions. From time to time we will make suggestions for small or large group discussions, questions to encourage thinking about the information that is presented, or ways to engage your student’s interests. However, your best guide will be your own intuition.
Please keep in mind that this Teacher’s Guide is a work in progress. Please annotate any questions you might have, or ideas that would work in addition to, or in place of those suggested. Note anything that doesn’t work and how students seemed to grasp the concepts, develop skills or recognize the relationship between their own actions and global environmental change so that we can include them in future editions of the Teacher’s Guide. Send your suggestions to: gssmail@agouldberkeley.edu or
Alan Gould, Global Systems Science Director

~{}~
Objectives [] Planning [] Assessment [] Resources
Guides for each Chapter: 1 – 2 – 3 – 4 – 5 – 6 – 7 – 8– 9
Index of TG Investigations
Assessment Tasks
Portfolios
General ideas for assessing student progress towards the goals and objectives of Energy Flow are suggested in a number of places throughout this Teacher’s Guide. We especially encourage the use of portfolios as a means of providing feedback to students and to demonstrate to parents evidence of student progress. Portfolios for Energy Flow might include the following (all page references here are page numbers in this Teacher Guide, not the Student guide):
- The student’s finished “Energy Transformations” sheet (p. 12).
- Worksheets, data sheets and other work done in the activities: “Energy Conversion” (pp. 13–16); “Human Slingshot” (pp. 23–24); “The Fission and Fusion Game” (pp. 41–52) “Energy Expenditures—A Transparent Problem” (72–74); worksheet on p. 77.
- Results and conclusions from the calorimetry experiments (pp. 19–22).
- The “Performance Task Assessment List” from the “Molecules in Motion” skit (p. 32)
- Any additional materials that the students find in their research for the “Congressional Hearing Role Play”
- Diagrams and written descriptions showing examples of static and dynamic equilibria.
- The essay “How Does the Flow of Energy Affect You?”
- Concept map of any of the chapters of the Student Guide
In addition to portfolios, we suggest that you use assessment tasks both before and after presenting the unit. The papers that students complete before beginning the unit will help you diagnose their needs and adjust your plans accordingly. Comparing these papers to the students’ responses on the same tasks after completing the unit will allow you to determine how your students’ understanding and attitudes have changed as a result of instruction. Three tasks which we suggest be used for pre- and post- assessment are as follows:
- Questionnaire—These questions are designed to determine how students’ knowledge of key concepts have changed during the unit, and whether or not they have changed their opinions concerning the importance of energy in their lives.
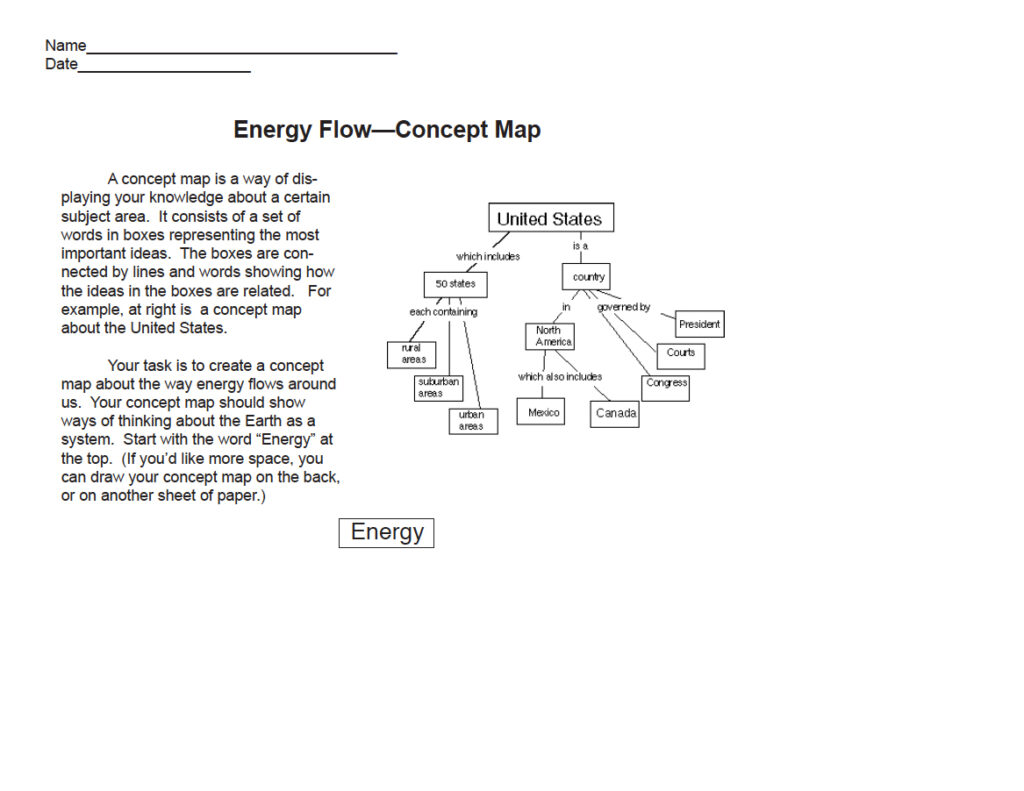
- Concept Map — Asking students to create a concept map before and after the unit is one way to determine which concepts they have learned and their understanding of the connections among these concepts. If students have no had experience in concept mapping, you might want to start them out with a hand-out showing an example (master on -INSERT LOCATION HERE-), a general idea of what they are to map, and starting word(s) to help get them started. Once they have had experience with concept maps, they can creat them on blank sheets of paper (no photocopying required). Alternatively, they can use concept mapping software such as:
Inspiration (http://www.inspiration.com)
Decision Explorer (http://www.banxia.com)
CMap (http://cmap.ihmc.us/conceptmap.html – free for noncommercial use)
Omnigraffle (http://www.omnigroup.com/applications/omnigraffle – Mac OSX)
Freemind (http://freemind.sourceforge.net/wiki/index.php/Main_Page – open source software for mind-mapping.)
Microsoft Draw (comes with Microsoft Office)
Some possible keywords to use: systems, energy, plate tectonics, tectonics, heat, plate, sun, radiation, conduction, volcano, eruption, earthquake, fault, earth, subduction, magma, density, gravity, radioactive decay, atom, nucleus, currents, fusion, fission, corona, el niño, hurricane, storm, tornado. - Energy Brainstorm — In connection with chapter 1, ask studentsto brainstorm a list in response to the question, “How many different kinds of energy are there?” This question can also be used as a pre/ post assessment tool. If the students generate their own personal list before you begin the unit, you can find out how their understanding has changed by having them make a new list at the end of the unit. Another good pre/post brainstorm question is “How does energy affect your life?”
These three tasks fall along a spectrum from traditional to nontraditional ways of assessing student progress. The Questionnaire is a traditional way to elicit student understanding. It assesses students’ abilities to express themselves as well as insights that they gained from the unit. The Concept Map is nonlinear. Students do not need to think in terms of sentences and paragraphs, and their ideas can flow more freely. Students who are more visual might be better able to show what they know on this task than on the Questionnaire. The Energy Brainstorm task is designed to see how students’ perspectives on energy have deepened as a result of this unit.
Questionnaire
Download PDF of Energy Flow Questionnaire
Interpreting Student Responses The tasks should be interpreted in terms of the objectives listed on page 4. In the questionnaire, questions correspond to the objectives as follows:
| Goal | Objective | Questionnaire Number |
| 1 | 1A | 1, 2, 3, 4, 5 |
| 1B | 1, 2, 5 | |
| 1C | 1, 2, 3 | |
| 2B | 1, 4, 6 | |
| 2C | * | |
| 2D | 2, 3 | |
| 3 | 3A | 3 |
| 3B | 1, 3, 4 | |
| 3C | 1 | |
| 3D | 6 | |
| 3E | 6 | |
| 4 | 4A | 2, 3, 5 |
| 4B | ** |
* This objective is not addressed in the questionnaire, but by several of the lab activities.
** This objective is addressed by the final essay on page 92 of the Student Guide.
We suggest that you pair students’ pre-and post-assessment papers and compare them. With the list of objectives in mind, look for changes in the students’ attitudes and understanding. As you look through your students’ papers, you’ll be able to jot comments for individual students concerning main points they may have missed, or praising them for their insights and ideas. After looking over all of the papers you will be able to write down some generalizations about what the class as a whole learned or did not learn during the course.
Comparing students’ papers before and after instruction may show that they have learned more about some objectives than others, or that certain misconceptions persist while others have been corrected. Eventually, we hope to be able to provide sets of instructions (called “rubrics”) to score student papers with respect to course objectives; but we do not yet have enough student data to do this.
The three tasks are presented below. You may want to make two class sets of each of the tasks, using one color of paper for the preassessment measures and a different color of paper for the post-assessment measures.
Concept Map
Download PDF of Energy Flow Concept Map.
~{}~
Objectives [] Planning [] Assessment [] Resources
Guides for each Chapter: 1 – 2 – 3 – 4 – 5 – 6 – 7 – 8 – 9
Index of TG Investigations
Guides for Each Chapter
Guide for Chapter 1
What is Energy?
Class Discussion:
Before your students begin reading assignments:
- Ask the class “What is Energy?” Be open to any responses they may have. The purpose of asking this question is to get the students to think about what the word “energy” means to them, to be aware that other people may have different ideas, and to let you know what they think about energy at the start of the unit.
- Assign them to a small group to brainstorm a list of answers to the question, “How many different kinds of energy are there?” Have a recorder in each group make a list of the ideas. After about ten minutes, when the small groups are running out of ideas, hold a large group discussion. Have each group name one item, creating a list on the chalkboard. Skipping items that have been named before, see how many different kinds of energy the class was able to identify.
- Students can create collages to illustrate different forms of energy.
1 – I. Energy From the Sun. We live in an energy-based civilization. Ask your students to bring in stories or articles from newspapers or magazines which relate to the production, distribution, or use of energy in any of its forms. During the study of this chapter use the clippings to point out the different forms of energy involved and the effect they have on human life or on the environment.
A radiometer is an interesting example of energy transformations.
Students can feel the loss of thermal energy on skin by water or alcohol evaporation.
Having your students try to fill in the spaces on the following chart is an excellent exercise.

TG-EF1-1. Investigation:
Energy Transformations
by Eloise Farmer, Torrington High School, Torrington, Connecticut;
inspired by Energy 80 program, Enterprise for Education, Inc., Santa Monica, California.
Have students fill in boxes in the chart below with an appliance, device, method or phenomenon that accomplishes a transformation from the energy form in the left column to one of the energy form in the top row.
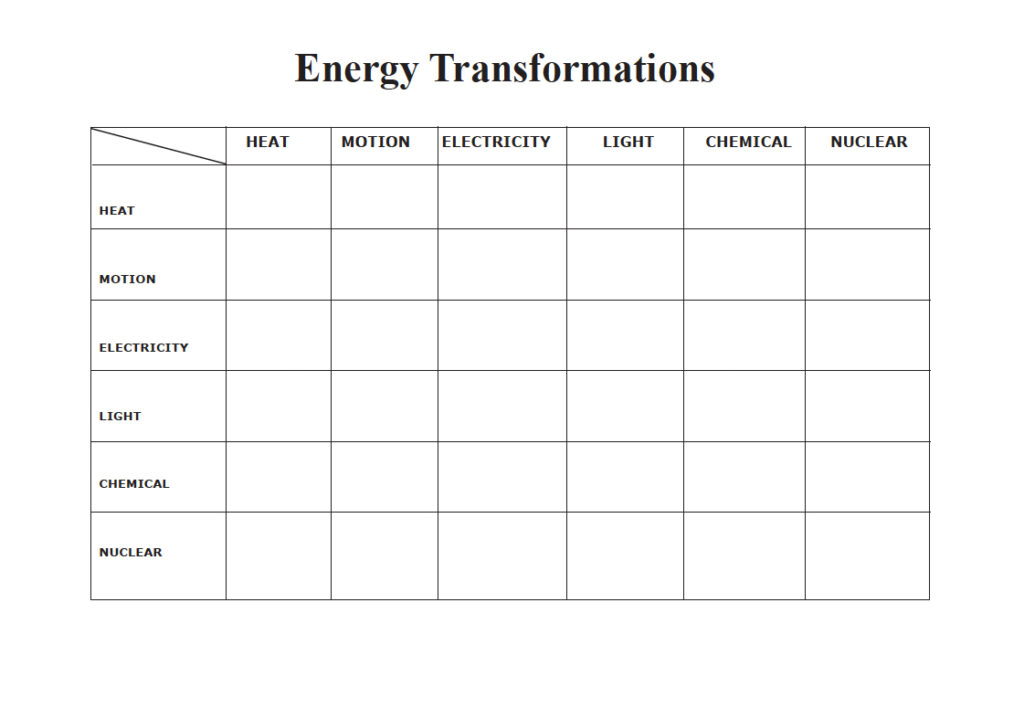
Optional: Give the students a list of items to fill in the appropriate boxes. Sample list is below:
| battery | electron orbital change | light meter | respiration |
| battery charger | fire | light sticks | solar house heater |
| bicycle | fire flies | muscle | solar water heater |
| bicycle generator | friction | nuclear bomb | static electricity |
| cloud chamber | fuel cell | nuclear reactor | television |
| Crooke’ radiometer | gas stove | photographic film | thermocouple |
| drill press | hair dryer | photosynthesis | toaster |
| dynamite | internal combustion engine | photovoltaic cell | wind turbine |
| electric motor | ionization | radiation treatments | x-ray machine |
| electric stove | iron (for clothes) | radio | |
| electrolysis | light fish | radioactivity |
1 – V. Flow of Energy
Lead-in idea: show video tape: TV Ontario, Energy Flow (See Resource List near the end of this book the for address.)
As you discuss this part of the text have a candle burning and have various students demonstrate radiation, conduction, and convection from the candle, and ask them to describe what they are finding out to the rest of the class.
Convection crops up more than once in this book. In this student guide we have avoided the phrase “hot air rises,” because it is usually stated as a truism, not a scientific explanation. Instead, we say that “warmer air floats,” or “is pushed upwards by cooler, denser air.” This wording is aimed at stressing that there is a force involved. The force of gravity acts more strongly on denser air, so it “pushes up” an equal volume of air that is less dense. Whenever something floats, we know it is being pushed upwards by a fluid that is less dense.
1 – VI. Forms of Energy
Put the words describing one of the forms of energy on the chalkboard and ask the students to name examples of that form of energy. Surround the name of the energy form with correct examples of it.
Do the same with each of the other forms of energy.
TG-EF1-2. Investigation:
Energy Conversion
by Eloise Farmer, Torrington High School, Torrington, Connecticut
and John Erickson, Lawrence Hall of Science, University of California at Berkeley
In this activity students devise ways to demonstrate that energy can change from one form to another in accord with the law of conservation of energy. It is designed to raise student awareness of the various forms of energy and how energy can be changed from one form to another. Students select materials from a collection of many objects to demonstrate to other students the conversion of energy from one form to another. They prepare both a written report and an oral report that explains the conversion to the class clearly.
Time Needed: two 45 min. class sessions
Prerequisite: Students should already have learned the first law of thermodynamics—that energy can neither be created nor destroyed. Also they should know that when energy changes form, some of it will be “lost” as heat which is not used to do work, and is not useful to the system. It is best for students to have already done work on the energy conversion chart activity that is described just before this activity.
Materials
Get as many different types of things as possible that can show conversion of energy. Following is a partial list.
From hardware store:
electrical wire (variety), small bell or buzzer; small porcelain light sockets and bulbs, 6 six-volt batteries or DC power supplies, incandescent 1OOW light bulb and lamp, infra-red light bulb and lamp, 1 hot plate, 3-4 sheets sandpaper, 1⁄2 lb. 2” steel nails
From grocery store:
safety matches, 1 qt. vinegar, 1 box baking soda, 2-3 green plants in pots
From electronics store:
2-3 solar cells, solar calculators
From toy store:
slinky, 6 marbles or balls
Other:
plastic yogurt containers or beakers, toaster or other electric heat appliance (from tag sale), wind-up alarm clock, goggles, aprons, tongs, luminescent paint (from hobby shop or Edmund Scientific), 1 pkg. black construction paper (from stationery store), 12 thermometers
Preparation
Organize the materials in boxes and/or on a table top or counter. The teacher needs to have a very good idea ahead of time how these materials can be used to show conversion of energy, so that skillful questions can be used to guide students.
In Class—Part 1
- Review the first law of thermodynamics—that energy can neither be created nor destroyed.
- Tell the students that they will be selecting materials from a collection of many objects to demonstrate to other students the conversion of energy from one form to another. Students work in groups of three or four.
- First have each group brainstorm ways that energy is converted from one form into another. If they have done the “Energy Conversion Chart” activity that precedes this one, they may use their charts for reference.
- Explain that the main challenge for each group is to use the available materials to demonstrate a continuous chain of four, five, or more conversions of energy from one form into another.
- Have each group choose people for the following roles: group leader and reporter, group recorder and diagrammer, group gopher. While all students need to go see what materials are available, it is the gophers job to obtain, assemble, and clean up materials. In groups with four people, the leader and reporter could be separate functions or there could be two gophers (or one gopher and one gadfly). If the group desires some material that is not present, they may either ask the teacher if it can be obtained, or students could even bring materials from home.
- Instruct the groups to create a plan for their demonstration, written out step by step. The plan should specify any safety precautions that will be needed. Plans must be approved by the teacher before the group begins implementing the plan.
- To motivate students to do as much exploration as possible in the time allotted, you may want to give them a rubric showing how their projects will be evaluated (See example on page 16 of this Guide), or just tell them that they will receive credit for:
- designing as many forms of energy conversion as possible (the more ways you can demonstrate energy conversion in a single chain, the better your score.)
- being able to demonstrate and explain these to the rest of the class
- relating their example to systems on the planet.
You may want to have some special reward for the group with the highest score.
In Class—Part 2
- Have each group present their Energy Conversion chain. To connect student ideas to key concepts of Global Systems Science, help the class to take notes and to summarize all of the student ideas presented.
- Each group should be prepared to explain the origins of the energy in their conversion chains and to trace it through the ecosystem and biosphere. Discuss the energy conversion in terms of systems of our planet.
- Assign each student to compose a written report using the following format:
Number of energy conversions demonstrated:
Statement of purpose (which conversions am I attempting to show?):
Hypotheses: If I (do this) to (the object), then I will be able to convert (type of energy) into ( different type of energy).
Materials used
Procedure (step by step)
Observations: (what actually happened)
Conclusions: Was the hypothesis correct?
The report should include a diagram or concept map of the demonstration.
The demonstration should be related to the first law of thermodynamics and extended to Earth’s systems.
Questions to answer:
- What kind of energy was converted and what kind did it become?
- If energy was lost, what form did the loss take?
- How did I know that these were forms of energy?
- What is the source of this from of energy in the biosphere and where does its products go?
- How does the chain of energy transformations relate to the first Law of Thermodynamics?
- Could we devise a way of testing both first and second Laws of Thermodynamics using our materials?
- How could what we learned be applied to the real world? How could it be applied to energy use and/or conservation?
4. Evaluate each team’s project in a rubric like that on the next page.
~{}~
TG-EF1-3. Investigation:
To Eat Or To Burn—The Energy’s the Same
by R. James Kurtz, University of Detroit Jesuit High School, Detroit, Michigan
and Elizabeth Montgomerie-Jones, Springbrook High School, Silverspring, Maryland
This activity is based on a popular laboratory exercise in which students use a calorimeter made of common materials. It helps students understand:
- energy can be converted from one form to another;
- energy can be measured and the measurements converted from one type of unit to another;
- hydrocarbons, such as paraffin, contain stored chemical energy; and (4) food contains stored chemical energy.
Materials
For the class:
• 1 raw potato and “potato borer” (cork borer)
• 1 knife
• 1 can opener (hole-poking type)
For each experiment group:
- ringstand
- candle
(Optional: If you want students to experiment with type of candle, get various types: dripless, smokeless, and ordinary paraffin types) - matches
- small ring for ringstand
- balance scale
- Celsius thermometer
- 250 ml beaker
- funnel
- craft stick or stirring rod
- graduated cylinder
- large, empty juice can with air vents
- empty, clean aluminum can (soda pop)
- ice
- one nut or other food item
For each student:
- 1 Calorimetry Data Sheet
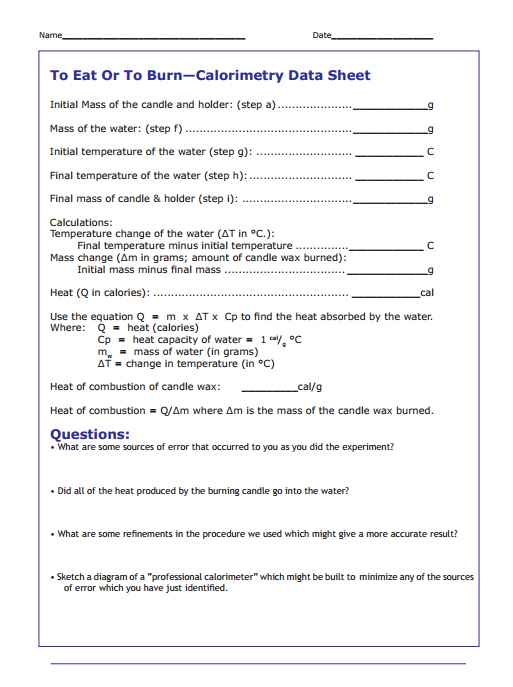
Download .pdf of Calorimetry Data Sheet here.
Preparation
• Gather all materials required. The “candle” for part 1 is made by coring out the center of a tall raw potato (a cork borer works nicely). Cut a small slit in one end of the “candle,” and insert a piece of slivered almond about the size and shape of a real wick. Store the “candle” under water (except for the almond-wick) to prevent discoloration. Just before demonstrating, mount the candle in a holder to add to the illusion, and burn the tip of the almond-wick for a few seconds to give it a more realistic wick-like appearance.
• In part 2, for safety, students who have long hair must tie their hair back before lighting the candle.
A day or two before the activity, you might request that students bring in clean empty soda cans and large juice cans with the entire top AND bottom removed.
• With a juice-type can opener, make three or four V-shaped vents in one end of each large juice can . These can then be saved and reused for other classes.
• For part 3, if time is short, you may choose to make this part less open-ended by preparing a data table and showing students a common procedure such as inserting a pin lengthwise into the nut (or marshmallow, etc.) and mounting the pin in a chunk of clay for support. Also, a jumbo paper clip can be bent into a shape which will support a nut.
• You may choose to have different students try a variety of nuts for the second part of the experiment. Almonds seem to work best, however. They tend to burn completely without going out prematurely as do other nuts. Some nuts (such a peanuts) contain so much oil that much of the oil will be released from the nut and drip onto the lab bench instead of burning.
Part 1: Introduction – The Potato Candle Demonstration
TIME REQUIRED: 10 – 15 minutes
1. Light the “candle” for a few seconds and blow it out
2. Ask the students: (a) What is the ultimate SOURCE of the candle’s energy? [The Sun] (b) Are there any ways of “tapping” the stored energy of materials, besides burning? [Possible answers: react it with other chemicals—or EAT it!]
3. If students do not arrive at eating/respiration as one possibility for tapping stored energy, simply proceed to eat the “candle.” This will probably get a startled reaction from students. Ask them why we eat anything. [Source of energy]. Suggest that, according to the law of conservation of energy, the amount of energy that can be obtained from a material should be the same whether the material is burned, eaten, or reacted in some other way. It depends only on the solar energy stored in the material in the first place.
Part 2: The Energy in a Candle
TIME REQUIRED: 45 minutes
- Explain that the “wax” of a candle is a hydrocarbon called paraffin. When the candle is burned, its atoms (mostly carbon and hydrogen) are rearranged and combined with atoms of oxygen from the air. The paraffin and oxygen are called reactants. After burning, the new arrangement of atoms, called the products of the reaction, are carbon dioxide, water, and a small amount of soot. In accord with the law of conservation of energy, the products have less chemical potential energy than the reactants because some energy was converted into heat.
- Tell the students that they will use a method called “calorimetry” to determine how much heat (in calories) is produced by a burning candle, per gram of candle wax (paraffin) burned. They will burn a portion of a candle to heat water. Knowing how many grams of water were heated and how many degrees the temperature of the water rose, they will calculate the heat energy of paraffin in calories.
- Remind the students that a calorie is defined as the amount of energy needed to raise the temperature of one gram of water one Celsius degree.
- Have students follow this procedure and record measurements on a calorimetry data sheet (sample opposite):
a. Measure and record the mass the candle (and its holder).
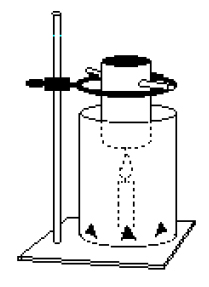
b. Place the candle on the base of the ring stand and position the large, vented juice can so that it acts as a “shield” for the candle and its holder.
c. Bend the tab of the soda can up and suspend it from the ring stand with a craft stick or stirring rod (see diagram on data sheet). The bottom of the soda can should be about 5 or 6 centimeters above the tip of the wick.
d. With the thermometer, measure and record the temperature of the room.
e. Add cold tap water to the 250 mL beaker until it is about 3/4 full. Add ice to the water until the temperature is about 10 degrees Celsius below room temperature. Remove any remaining ice.
f. Pour 200.0 ml of the cold water through a funnel into the soda can. Record the mass of the water in your data table (for water, 1 ml = 1 gram).
g. Measure and record the temperature of the water in the soda can (it probably warmed up slightly, transferring heat to the can).
h. Move the vented juice can / shield out of the way for a moment, light the candle, and return the juice can to a position which allows it to surround the burning candle. Allow the candle to burn until the temperature of the water in the soda can is about as much above room temperature as it was below room temperature in step d. Blow out the candle. Measure and record the temperature of the water.
i. Measure and record the mass of the candle (with holder); be sure that any drippings from the candle are included.
5. Have students compute the heat of combustion for the candle using the “Calculations” portion of the Calorimetry Data Sheet.
Part 3. The Energy in a Nut
It is best to connect Part 3 of this activity with the section of Energy Flow, Chapter 9 on photosynthesis and respiration. We give the description here because it uses the same materials as part two, and in some situations could be done in sequence.
- Explain or review with the class the processes of respiration and photosynthesis as described ion Chapter 9. Write the equations on the board:
Photosynthesis:
energy + CO2 + H2O ⇒ [CH2O] + O2
Respiration:
[CH2O] + O2 ⇒ energy + CO2 + H2O
Ask, “Can you think of other chemical reactions which involve combining materials with oxygen?” (Oxidation—one of the most common examples is burning). “If we burned a carbohydrate, what products would we end up with?” (Carbon dioxide, water, and energy—the same as respiration!) - Challenge the students to measure the amount of energy stored in food. An obvious strategy is to burn the food and use a calorimeter to determine energy released. Have students decide how they would modify the procedure of Part 2 to find the energy stored in the food item (almond, peanut, marshmallow, ….) They can prepare a data table to enter the measurements.
ASSESSMENT Tasks
Food calories usually use the unit Calorie (with a capital “C”) which is one thousand calories (one kilocalorie).
- Calculate the maximum energy that your body could obtain from the nut, in calories per gram. Then express your answer in Calories (food calories) per gram. Compare with other types of nuts or other food items to determine which has the most calories per gram.
- How much energy would be released by the burning of a 75 gram candle? Refer to the value you determined earlier for the heat of combustion of candle wax (paraffin) in calories per gram.
- A gallon of gasoline has a heat content (energy of combustion) of about 33,000 Calories per gallon. How many 75 gram candles have the same combined amount of energy as a gallon of gasoline?
- How much energy would be released by the burning (or eating) of a 14 gram nut (or other food item). Use your result from question (1) above. How many of those nuts (or other items) would have to be burned (or eaten) to obtain the same energy as the energy released in the burning of a gallon of gasoline?
- You are getting ready to take a bath and would like to have 60 liters of water in the bathtub at a temperature of 45°C. The temperature of the water as it comes from the tap is only 21°C, and your hot water heater is out of order! How many candles like those in question (2) would you have to burn to prepare your bath water?
- If you wish to warm 100 kg of water by 20 degrees Celsius for your bath, how much heat is required? Express your answer both in calories and joules. If you had nothing but nuts to use as fuel to heat your water, how many kilograms of nuts would it take to provide the same energy? (Refer to question 1).
Other Questions:
- Automobile engines transform chemical energy stored in fuels to mechanical energy and heat. What is the global process that happens only in nature and that stores this energy for our use? Where does the energy come from?
- The energy we require for our existence comes from the chemical potential energy stored in food which is transformed into another forms of energy by the process of digestion / respiration. What happens to a person whose energy output is less than the energy consumed? When the person’s energy output is greater than the energy consumed, what happens?
In thinking about specific heat we might remember what happens when we heat a TV dinner. The foil cools faster than the food inside and we can easily burn our tongues when, noticing that the foil is cool to the touch, we assume that the food is ready to be eaten. This happens because different substances have different energy storing capacities, or specific heats. That is the reason for food remaining hotter than the aluminum pan which holds it. Different materials require different amounts of heat to bring about the same increase in temperature.
~{}~
TG-EF1-4. Investigation: Human Sling Shot
adapted by Terry Anderson, New Richland‑Ellendale, New Richland, Minnesota; from an article in Science Teacher, Sept. 1990, pp. 82-83, by Anne E. Larson, North View Jr. High, Brooklyn Park Minnesota
This activity gets students physically involved in dealing with Newton’s Second Law, and helps show the relationship between potential and kinetic energy. Students sit on a skate board in a sling shot configuration, and are accelerated down the hall. Potential energy from the inner tubes (sling shot) is converted into kinetic energy.
Materials:
• 1 skate board
• 10 bicycle inner tubes or 10 m length of surgical tubing
• 1 helmet (optional)
• stop watch(es)
• spring scale (newtons or kg)
• hallway or other area with a smooth floor
In Class
- Two students will hold the ends of the bicycle inner tubes (sling shot).
- A student sits on the skateboard and is placed in the “slingshot.”
- The slingshot apparatus is pulled back and two students measure the distance it is stretched; then the slingshot apparatus is released and the student on the skateboard is propelled down the hall.
- Two students measure the distance in meters the skate board travels.
- Two other students measure the time in seconds that the skate board is in motion.
- Two other students record the data.
Back in the classroom:
- If this is an introductory course, you will want to emphasize the conversion of potential energy (PE) into kinetic energy (KE). Have the students do the experiment several times and plot the distance that the slingshot is pulled back vs. the distance that the projectile (person on the skateboard) travels. This shows how KE is related to PE. You can have the students discuss where the PE comes from. [Solar energy is stored in plants, which is converted to food to provide energy for the students to pull back the slingshot.]
- If your students are more advanced, and have studied physics, you can have them do more detailed calculations related to Newton’s Second Law (F=ma) as shown below.
1. Calculate the acceleration.
2. If the force is known (Newtons), calculate the mass.
3. If the mass is known, calculate the force.
4. Calculate the work done.
5. Calculate the velocity (this will be average velocity).
6. Calculate the kinetic energy.
7. What is the potential energy of the slingshot?
8. Calculate the work done.
9. Are the masses and forces proportional? What is their relationship?
10. Calculate the efficiency of the system.
11. Find the effect of friction.
12. Make a systems map of this exercise.
Relevant formulas:
- F = ma F = Force a = Acceleration
- W = F x D m = Mass D = Distance
- A = (vi-vf)/t t = Time v = Velocity
- V = D/t
- KE = 1/2mv2 (KE = Kinetic Energy)
- PE = KE (PE = Potential Energy)
Another variation of the slingshot activity is to use a large rubber band to fire a ruler from the edge of a table top.
- Measure potential energy. Students use a spring scale to measure the force exerted by a rubber band. They record several force measurements corresponding to several distances of stretch. They stop when the force is greater than the scale can measure or if the rubber band gets stretched more than seven centimeters.
Students plot the recorded data in a graph of Force vs. Distance of stretch.
Estimate the area under the curve from zero to maximum stretch.
______________Newtons x centimeters
Divide the area by 100 to get the potential energy of the stretched rubber band.
_______________joules - Measure kinetic energy.
a. Measure the height (h) of the rubber band above the floor
to the nearest hundredth of a meter:______________m
b. Fire the ruler off the table top with a “fully stretched” rubber band.
c. Measure the distance (d) that the ruler flies to the nearest hundredth of a meter.
d. Find the mass (m) of the ruler to the nearest hundredth of a kilogram.
e. Using the value of the acceleration of the ruler due to the Earth’s gravity as
9.8 m/s2 and the formula KE = (mgd2)/4h, determine the kinetic energy in joules.
~{}~
Objectives [] Planning [] Assessment [] Resources
Guides for each Chapter: 1 – 2 – 3 – 4 – 5 – 6 – 7 – 8 – 9
Index of TG Investigations
Guide Chapter 2:
Why Do Volcanoes Erupt?
Volcanoes and tectonic plates In the 1960s a teacher of Earth Science would be discussing the changes in the Earth’s surface in terms of vertical movements. Mountains emerged from a buckling crust. Sea levels rose and fell and continental plateaus were uplifted. Since then a series of discoveries and new technologies have revealed a new picture of the Earth.
The basis for this new conception of Earth’s geology is the essential role of large-scale horizontal movements of the crust. The “wild” concept of plate tectonics that Alfred Wegener postulated back in the 1920s is now regarded as the established framework in the field of geology.
- Ask your students to research the work of Alfred Wegener. Hold a round table discussion on why the students think his ideas were not accepted at the time. They were actually laughed at. And why they are now “regarded as an established fact.”
- Discuss how a new hypothesis becomes a respected theory. What must be done before scientists accept a new and unusual idea? How is the Wegener story an example of how scientific knowledge advances?
- The illustration in section V (Why Do Tectonic Plates Move?)
can be an excellent assessment tool. Ask the students to explain it in their own words. - The PBS Nova video on the eruption of Mt. St. Helens is an excellent supplement to this chapter. Also the video: “Heat From Within” from the Miracle Planet series.
- Ask the students to look at the map at the beginning of section IV (Volcanoes and Tectonic Plates). What is the worldwide pattern of volcanoes? What does the pattern reveal about the Earth? (The Pacific Ocean floor is a single large plate. Volanoes occur near the edge.)
- After reading section VI (What Happens When Tectonic Plates Meet?), ask students to explain in their own words what type of plate boundary is in the Mt. St. Helens region.
~{}~
TG-EF2-1. Demonstration: Sea Floor Spreading
Adapted from a demonstration by Dr. John Dunkhase at The University of Iowa
adapted by Mike Martin, Iowa City Community, Iowa City, Iowa; and Christine Falta, Englewood High School, Englewood, Colorado
As a result of mapping with magnetometers, the ocean floor was found to consist of bands where the rocks apparently had opposite magnetic polarities. The earth’s magnetic polarity has reversed itself several times in the past, roughly every 25,000 years. The ocean floor bands turned out to have a pattern that was repeated on either side of a mountain range in the middle of the ocean called a mid-oceanic ridge. Rocks from the ocean floor were determined to be older the further from the ridge they were found.
Based on these findings, it was theorized that the ocean floor was generated at the mid-oceanic ridges and then spread to either side until they met a continental plate. This theory, known as sea floor spreading, was further confirmed when ALVIN, a deep water submarine captured video footage of rocks being formed from molten lava that emerged from a mid-oceanic ridge.
Demonstration: Simultaneously pull the two free ends of a long (about 8 feet) continuous strip of paper, such as computer paper, up through a narrow opening between two tables. This could also be done by pulling the paper up through a slit in a box if no tables are available.
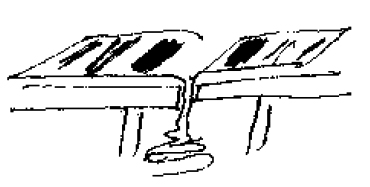
Periodically announce “The polarity of the earth has changed.” At this time a student is assigned to mark the paper with paint or a large felt marker while it is slowly pulled through the slit to represent the formation of rocks with a different polarity. Make sure that the two sheets of paper are pulled slowly and at the same rate, and that both sides of the slit are painted at the same time. When the polarity changes again the painting should cease till the next polarity reversal. Vary the space between the bands so the pattern becomes obvious when comparing the two sides.
~{}~
Objectives [] Planning [] Assessment [] Resources
Guides for each Chapter: 1 – 2 – 3 – 4 – 5 – 6 – 7 – 8 – 9
Index of TG Investigations
Guide for Chapter 3
What Heats the Earth’s Interior?
Cut-away View of the Earth
There is a lot of information on this page. Here is a game, called “What is the question?” that can help students process the information.
- Divide the class into three or four teams. Explain that you are going to give the class answers to possible questions constructed from the information on this page related to what is going on inside the Earth. The students are to consult with one another and come up with a question that matches the answer. They are to raise their hands as soon as they have agreed to the question. You can award points for teams that come up with reasonable questions. Several teams might receive points if they come up with different questions that match the answer. For example: A. Because magma is coming up from inside the Earth at that spot. Q. Why do volcanoes occur on the ocean floor?
Why does hot magma rise?
- Arrange a laboratory session so that students can observe Brownian movement of spores in water through microscopes. A mushroom collected from the soil and left overnight on smooth white paper with the flat part on the paper will yield all the spores your class needs. Alternatively a small amount of carmine red powder or India ink added to a drop of water will serve. Point out that the random motion of the particles is the result of multiple collisions with invisibly small molecules of water.
- Some school laboratories have evacuated tubes of heat-resistant glass that contain a small amount of mercury. A quantity of small colored glass chips float on the surface of the mercury. As the mercury is heated some of its heavy fast-moving molecules leave the surface. As they do so they strike the glass chips causing them to jump up off the surface. The hotter the mercury the higher the chips will jump.
What is the source of Earth’s heat?
- The suggestion in the text that oatmeal in heated water can demonstrate a convection current can be carried out as a classroom experiment. But the best of all food examples of convection cell action occurs in piping hot miso soup (served in Japanese resaturants and homes). The Laboratory Investigation on page 27 of the Student Book is another way of observing convection currents. That lab can be extended by challenging students to make a “lava” lamp with the apparatus.
- Ask students to prepare a demonstration that they could take to a lower grade science class to show the principle of convection. They should describe what they expect to do, step by step and what they want the students to learn. (Teaching is always a learning experience.)
Page 26 The information presented on these pages discusses the source of the Earth’s heat and how that heat escapes to the surface via huge superplumes driven by convection. It may be difficult for students to envision this vast, extremely slow process occuring beneath their feet. Ask them to discuss how the diagram on page 29 provides evidence to support this theory.
~{}~
Objectives [] Planning [] Assessment [] Resources
Guides for each Chapter: 1 – 2 – 3 – 4 – 5 – 6 – 7 – 8 – 9
Index of TG Investigations
Guide for Chapter 4
How Does the Sun Shine?
4 – I. The Sun–An Average Star
Give the students the following information: a penny is about 2 cm in diameter; the Earth is 12,740 km in diameter; the Sun’s diameter is about 1,390,000 km. If the Earth were the size of a penny how large a circle would represent the size of the Sun?
Ask the students to write down their estimates and their names on a slip of paper. Collect the slips. Work out the following steps with the students.
- How many Earth diameters would fit into the diameter of the Sun? (1,390,000 km/ 12,740 km = 109)
- How long a line will a 109 pennies make?
(109 x 1.9 cm = 207 cm = 2 meters.)
Draw a circle two meters in diameter and place a penny inside. (You might want to place 109 pennies on the floor and then draw a circle with the length of the row of pennies as the diameter.)
~{}~
TG-EF4-1. Investigation:
Fission and Fusion Game
by Marti Andreski, North Springs High School, Atlanta, Georgia
and Chad Husting, Miamisburg High School, Miamisburg, Ohio
In this activity, your students play a board game in which they learn to:
- Recognize the difference between fission and fusion,
- Distinguish between reactants needed and products produced in fission and fusion,
- Approximate energy output of each reaction given the amount of reactants,
- Discuss global impacts and obstacles of the practical uses of fission and fusion,
- Distinguish between different energy units (quad, BTU, or joule) and see how they apply to real world energy uses, whether it be associated with a person shoveling snow or three million barrels of oil).
While this is not meant to be the “be all and end all” about nuclear energy, it can give your students a basic idea of nuclear energy, its potential and drawbacks, and its global impacts. It can also be used to stimulate discussions and debate.
Once the students learn what is needed for nuclear reactions to occur, they gain cards to produce a fission or fusion reaction. As a product, they gain energy by which they can “buy” activities that are equivalent in energy. They are also be exposed to the “negative impacts” of nuclear energy.
Materials
For every 4 players:
- 1 “Energy Consumption Board.”
- 1 set of “Fission Pick-up Cards” (15 cards)
- 1 set of “Fusion Pick-up Cards” (15 cards)
- 1 set of playing cards:
- 12 “Fission Reactants Cards”
- 6 “Fission Products Cards”
- 12 “Fusion Reactants Cards”
- 6 “Fusion Products Cards”
- 6 “Discussion Cards”
- 1 plastic overhead transparency sheet (blank).
- 4 overhead pens (for each player, preferable different colors)
- 1 playing board (optional).
Get PDF of cards
Getting Ready:
Copy the sheets on the following pages and then cut it up into the cards. Fold Fusion and Fission cards in half and tape them. They can then be turned over to read a fission or fusion fact.
Optional:
- Laminate everything and color coat the cards to help the visual learners.
- Make game boards with specific places for the “Playing Card” stack, the two “Pick-up Card” stacks, the “Discard” stack, and the “Energy Consumption Board.”
Before Playing the Game:
Begin with a general discussion of fission and fusion—two ways by which one might obtain large amounts of energy with what appears to be a small amount of fuel. Both have been occurring naturally since the beginning of time and have also caused much controversy during the latter part of the twentieth century.
Write the two equations on the board.
Fission—Splitting of atoms.
U235 + neutron —> Energy/waste and neutron
This reaction consumes and produces a neutron. The neutron product from one reaction can be used to start another, thus, one gets a chain reaction. Scientists can make uncontrolled reactions (Atomic bombs) or controlled reactions (reactors). In a controlled reaction, the energy heats water which boils which turns a turbine which makes electricity. The good news is that a small amount of U235 can give much energy. The bad news is that the waste can be very radioactive and hang around for thousands of years.
Fusion—Combining of atoms.
Tritium + deuterium + energy ——> helium + neutron + more energy
The good news is that the reactants are plentiful, easy to handle and not radioactive. The bad news is the amount of energy required as a reactant. This is the same process that fuels the stars and our sun and requires reaction temperatures of millions of degrees. How do you find a container that can hold that much energy without melting and vaporizing? This is the main obstacle to fusion at this point.
In both reactions, the mass of the products is less than the mass of reactants! This seems to violate the “Law of the Conservation of Mass” until we realize that the “missing mass” is converted into energy. How much energy? According to our good ol’ buddy, Al Einstein,
E = mc2 where E is energy in joules, m is mass in kilograms and c is the speed of light (which happens to be a REALLY big number) squared (making it an even bigger number). Just how much energy would, let’s say, 1 kilogram of U235 or the deuterium/tritium (called D-T) complex give us in equivalent barrels of oil? Have your students guess. Then give them the answers from the energy consumption sheet.
Reading the Energy Consumption Sheet…….
Under the “Consumption” column are listed several objects that consume energy (i.e. 18 W Fluorescent Lamp over a lifetime).
The “Energy Use” column shows how much energy is used in some type of energy unit. The lamp, for example, uses 570 kW-hours of energy over its lifetime.
The third column is the same as the “Energy Use” but the units are in joules.
The next six columns are “Fission” and “Fusion” columns that show what amounts of nuclear fuel are needed for each energy Consumption item. Example: It would take 1 kg of U235 undergoing fission to make enough energy to fuel 40,000 18 W fluorescent lamps for their lifetime. 50 Kg of U235 would fuel 2 million bulbs (the next column). In the “Fusion” column, 50 kg of the deuterium/tritium complex (D-T) will power 8.2 million 18 W fluorescent bulbs for their lifetime, or (farther down this column) it is the same amount of energy in 18 oil tankers that contain 3 million barrels of oil each.
All of the numbers given are approximations—the orders of magnitude should be correct. Also, we assumed that the energy converted is purely converted with %100 efficiency. This never happens, but it will give the students a good idea about “What if…..?”
Playing the Game:
Object of the game: gain as many energy consumption cards as possible.
INSTRUCTIONS:
- Place Fission Pick-up cards in a stack face down.
- Place Fusion Pick-up cards in a stack face down.
- Place the Energy Consumption Board to the side with a blank overhead transparency sheet on top of it.
- Shuffle all the playing cards
- Deal four cards to each player.
- Place the remaining playing cards in a stack face down.
- Discard pile. Initially, this pile should only have one card face up. Unwanted cards are placed here face up.
Players should have four cards at all times. Player always draws a card first and then plays their hand. - The person to the left of the dealer begins.
a. If this player has a discussion card, they read the card and the discussion question. Everyone has to answer. The player then places the discussion card in the “discard pile” face up and chooses a card from the “Playing card pile”. They also take a “Prize” by marking their initials on the square of their choice on the “Energy Consumption Sheet.”
b. If the person has the reactants and products for “Fission” (a neutron card—reactant, a U235 card—reactant, and an energy, waste and neutron card—products) they say “Fission” and show their cards to the other players. They place these cards in the discard pile in any order, choose three new playing cards, and pick up a “fission” pick up card and follow its instructions, taking any allowed energy “Prizes” by marking their initials on the square of their choice under fission or fusion on the “Energy Consumption Sheet.” When a player places down any cards, they always have to read the cards out loud to the other players. They wait until it is their turn again before they can play their new playing cards. After using the “fission” pick up card, they return it to the bottom of the pile.
c. If the person has the reactants and products for “Fusion” (a deuterium/tritium card—reactant, a heat card—reactant, and a helium/neutron/energy card—products) the say “Fusion” and show and read their cards to the other players. They place these cards in the discard pile in any order, choose three new playing cards, and pick up a “fusion” pick up card and follow its instructions taking allowed “Prizes” by marking their initials on the square of their choice under fission or fusion on the “Energy Consumption Sheet.” They have to wait until it is their turn again before they can play their new playing cards.
d. If a the player does not have any discussion cards or the correct reactants and products to get fission or fusion, the player can discard any one of his or her cards. They can pick up a card from the discard pile (as long as it is NOT a fact card), or they can choose to pick up a card from the playing card pile and then discard. Anything they discard must be placed face up.
- The next person to play is the person to the left. The person must play their discussion card if they have it (see 8a). If they have the correct reactants and products, they can say “Fission” or “Fusion” (see 8b and 8c). Otherwise, follow step 8d.
- Continue play. The game is over when all of the energy has been consumed or the teacher calls “Time”.
Assessment:
- There are many ways to use the energy consumption sheet. You can “white out” some squares and have students guess the answers. You might want to have students do conversions with different energy units (quads, BTU’s, joules, calories, etc…). This can be used a number of ways. The facts on the playing cards and the pickup cards can be used in a pre and post assessment.
- Before you begin the “Fission and Fusion Game” have students try to answer the following questions. Have them write down what they think is the correct answer. Then after playing the came, you can have the students write answers the same questions and see if their understanding has changed.
Questions
- What is the difference between fusion and fission?
- What are the environmental impacts of fission? Of fusion?
- Where does the energy come from in each of these reactions?
- Compare and contrast the waste products for each reaction.
- What are some obstacles to both forms of energy?
- List pros and cons for fusion and fission.
References
Credits – “Energy 88: Learning about Science, Society and Technology” , “Energy 80 Teacher’s Resource Book”, “GSS Energy Use”
“Nuclear Energy” by Raymond L. Murray, fourth edition, Pergamon Press
~{}~
Objectives [] Planning [] Assessment [] Resources
Guides for each Chapter: 1 – 2 – 3 – 4 – 5 – 6 – 7 – 8 – 9
Index of TG Investigations
Guide for Chapter 5
What Is Light?
5 – I. What is Light?
Repeating Oersted’s and Faraday’s discoveries; student experiments with electricity and magnetism.
Students can construct electromagnets 1.5 volt dry cells, wire and nails to learn about Oersted’s discovery. Have the students wrap insulated wire around the iron nail. When the metal ends of the wire make contact with the terminals of the dry cell the nail becomes a magnet. The magnetic field is generated by the moving electrons in the wire. The nail will pick up paper clips. Have the students experiment with two dry cells in series to increase the voltage and see how many more paper clips they can pick up. Ask them if increasing the number of turns of wire will make a difference in the strength of the electromagnet. Remember that the dry cells are essentially being short circuited and will quickly become “dead” cells if the contact is maintained too long.
To demonstrate Faraday’s discovery of the generator principle, you will need wire, permanent magnets, and galvanometers, or milliammeters will be needed. Have the students wrap coils of insulated wire around a toilet paper tube or other small cylinder, and then remove it so they have an open coil of wire. Attach the metal ends of the wire to the terminals of the galvanometer.
As the students move the magnet in and out of the coil, the galvanometer will indicate that an alternating flow of electricity is produced in the coil. The electrons will flow one way when the magnet is inserted. They will stop flowing when the magnet is not moving but will flow the other way when the magnet is removed from the coil. Ask the students if a change in the speed of the magnet or an increase in the number of coils makes a difference.
- An aurora video can be very effective. An excellent one is available from University of Alaska at Fairbanks.
- A magnet/iron filings activity is good for illustrating magnetic field.
- A prism demonstration is always visually exciting. It shows how light is composed of many wavelengths.
~{}~
Objectives [] Planning [] Assessment [] Resources
Guides for each Chapter: 1 – 2 – 3 – 4 – 5 – 6 – 7 – 8 – 9
Index of TG Investigations
Guide for Chapter 6
Energy Flow In the Atmosphere
The systems view of the world is an important goal of Global Systems Science. Chapter 1 in the Student Guide A New World View discusses Earth systems.
Teaching About Systems
A system is defined as a group of interacting parts. But a description of a system that focuses only on the parts is static. Systems are dynamic and a description that ignores interactions falls short. For example, much would be lost if we study parts of an ecosystem — plants, animals, and their environment — and ignore their interactions. A better definition of a system should emphasize the idea of interaction. In this view a system is a group of parts that interact with and influence one another.
One of the goals of the Global Systems Science course is to encourage students to begin to think in terms of dynamic systems. Nature works through systems so thoroughly that there is a great deal of truth in the saying, “Everything is connected to everything else.” We hope that when natural systems are studied later in this guide students will strive to understand the interactions that are so vital to the well-being of the Earth. If it hasn’t already been done, here we can begin the study of systems with the automobile.
To begin the lesson you might ask, “What are the essential parts of an automobile system?” List the parts on the chalkboard that the class agrees are essential. They might be: engine, power transmission system, wheels, steering system, frame, ignition system, fuel system, cooling system, braking system, exhaust system, and operator. An obvious point is that one system is often made up of subsystems. Teams of students could then be challenged to diagram an automobile system.
In this course students should often be called upon to model the interactions discussed. Making diagrams to represent their models is a valuable means of understanding the interrelationships.
Students should never forget that systems are dynamic. They should try to describe how flows and actions in one part of a system influence other parts.
Ask for other examples of systems. Have students work in teams to develop maps for selected systems.
Investigation 6-1. Experimenting with Equilibrium
The purpose of this investigation is to make clear by analogy the relationships among incoming solar energy, global average temperature, increase in greenhouse gases, and Earth’s radiation of energy into space.
Answers to questions:
- The higher the water level the faster the rate of flow.
- The water level will rise as more holes are blocked.
- The rate of incoming water equals the rate of outflow.
- After an initial start-up period when the water supply is first turned on, this system establishes dynamic equilibrium. The water content is constantly changing but the water level remains constant. When one or two holes are blocked the equilibrium is disturbed, but after the water level rises to a new height a new equilibrium is established.
- If the water level represents the average temperature of the Earth, the water flowing in and out represents the Sun’s energy. Most of the incoming energy is in the form of light and the outgoing energy is infrared. The higher potential energy of the incoming water and the lower energy level of the outgoing water fits the analogy since photons have more energy than infrared radiation.
The blockage of the holes represents an increase in greenhouse gases in the atmosphere since that increase tends to restrict the flow of energy to space and raises the global average temperature.
Intro: Static and Dynamic Equilibrium
Answers to questions:
- What kind of equilibrium did (the heat trap) achieve? How do you know?
After an initial period of warm-up the heat trap became a dynamic equilibrium system. The thermometer remained at a constant temperature indicating that the energy going in was equal to the energy going out. It is dynamic because the energy is constantly flowing. - What kind of equilibrium has our planet achieved? How do you know? In a way similar to that of the heat trap the Earth system is in dynamic equilibrium. Solar energy is constantly coming in. An equal amount is radiating off into space. The global average temperature varies but in a relatively narrow range. If the amount of greenhouse gases in the atmosphere increases the global average temperature will rise. Eventually the Earth system will again achieve a new equilibrium, although it might be hotter than we can cope with.
6 – III. How the Earth’s Atmosphere “Captures” Solar Energy
It is best to go over page 65 in class. The two main points to be made here are the conservation of energy (flow in = flow out) and the recirculation of infrared energy which constitutes the greenhouse effect.
One method is to make an enlarged drawing of the Sun, Earth’s atmosphere and Earth’s surface system, and to lay it on a table.
Energy in – Start out with a hundred pennies, representing a hundred photons from the Sun. 30 of them are immediately reflected back into space. Move them right back into space. 25 of them are absorbed by the atmosphere. Move them into the atmosphere section. 45 pennies are absorbed by the surface. Move them into the area represented by the Earth’s surface.
Energy out – Mix the 25 and 45 pennies together to represent the exchange of energy between the atmosphere and the surface. Move 4 of the pennies out into “space.” These represent the infrared energy escaping from the surface. Move the remaining 66 pennies around from the atmosphere to the surface and back again. These represent the radiation from the surface to the atmosphere and the reradiation back to the surface by the greenhouse gases. Since these molecules in the atmosphere reradiate absorbed infrared radiation in all directions some of it goes back down to the surface. With each rotation of the 66 pennies a few move off into “space,” and some go back down to the Earth again, warming it further. Eventually all 66 will join the others, so that the input (100 pennies) equals the output (100 pennies.)
While all this is happening another 100 photons are entering the Earth’s atmosphere and so the process continues. Point out that the circulation of the 66 pennies represents a reheating of the surface – the greenhouse effect. If more greenhouse gases enter the atmosphere the recirculation of the infrared energy will take longer and the surface temperature will rise. However, eventually the energy will leave the Earth so that energy in = energy out.
The Greenhouse Effect
The diagrams in this section show the similarities between the gardener’s greenhouse and the Earth’s greenhouse effect.
- Ask the students to trace the flow of energy as it moves from the Sun into the gardener’s greenhouse using a step-by step-approach. They should indicate the energy transformations.
- Repeat the process for the Earth’s greenhouse effect.
Opponents to the global warming hypothesis… Role play simulation—A Congressional hearing
Students can be asked to take on the role of members of a Congressional Committee looking for information on whether or not to propose legislation limiting greenhouse gas emissions.
Selected students can act as testifying experts. Some of them can take the information presented on these pages and represent those scientists who do not see the necessity for immediate action. They should state their reasons why they are doubtful of the greenhouse warming hypothesis. Select other students who would state reasons for immediate action.
For more background the students can read Changing Climate, another Student Guide in the GSS series. Or they can consult the Reader’s Guide to Periodical Literature. Magazine articles and newspaper stories can provide additional information to make the role play discussion more detailed.
Permit the “Congressional Committee members” to ask questions of the expert witnesses.
~{}~
Objectives [] Planning [] Assessment [] Resources
Guides for each Chapter: 1 – 2 – 3 – 4 – 5 – 6 – 7 – 8 – 9
Index of TG Investigations
Guide for Chapter 7
What Causes Thunderstorms and Tornadoes?
Newspapers are excellent sources of weather information. The paper USA Today is a particularly good reference. Students can use the newspaper to track lows and highs, cold fronts and warm fronts, as they move across the country. The relationships among pressure changes and weather can be better understood when storm systems are followed. During the appropriate season the movements of tornadoes and hurricanes can be studied.
Good activities to demonstrate seasons with direct and indirect rays of the Sun can be found in Prentice Hall series: Exploring Earth’s Weather.
~{}~
TG-EF7-1. Investigation:
An Inversion Model
adapted by Alan Chan, Glencoe High School,
Hillsboro, Oregon;from an activity provided by Pat Noel of Woodrow Wilson Environmental Chemistry Institute,
Princeton, 1989.
This activity shows behavior of an “inversion” in a fluid. Inversions of air masses can be indicative of relatively calm weather conditions. However, inversions can also lead to the development of tornadoes.
Materials
4 Ehrlenmeyer flasks (250 ml)
2 thin glass plates (about 3 cm square)
1 hot plate
food coloring—red and blue
Procedure
- Fill the Erlenmeyer flasks to the top with water.
- Add a few drops of red food coloring to two of the flasks and a few drops of blue food coloring to the other two flasks.
- Heat the flasks with red water to a temperature of 50-70°C. on the hot plate.
- Place one of the red flasks on a table and put a glass plate on top of it. Make sure there is no air between the liquid and the glass cover. Carefully invert it and place it on top of one of the blue flasks.
- Remove the glass plate slowly and observe what happens.
- Repeat steps 4 and 5 with the remaining flasks, but with the blue flask (cooler water) on top this time.
Ask students to write what they observe and to explain it in terms of density of fluids. Then ask them to relate it to atmosphere, inversions, and convection. (When the cooler layer is on the bottom, nothing happens; but when the warmer layer is on the bottom, that is an “inversion” and it can occasionally lead to a violent updraft thunderstorm and even a tornado.)
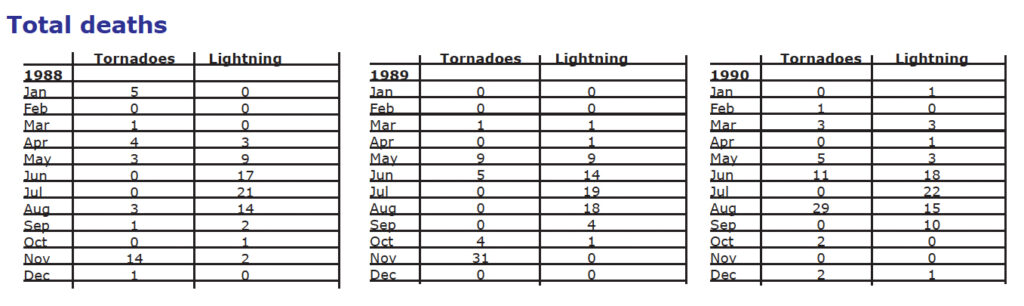
There are some excellent activities on storms in the NOAA Environmental Research Laboratories Forecast Systems Laboratory publication. An example is one in which students compare the risks of being injured or killed by lightning or tornado. Although most people realize that both lightning and tornadoes are spawned by thunderstorms, few people realize that lightning causes more deaths than tornadoes. One explanation for this misconception comes from our method of reporting tragedies. Lightning deaths tend to occur singly with little property damage and, therefore, are deemed less news worthy. On the other hand, multiple deaths and extensive property damage from a tornado frequently make headline news. Furthermore, lightning deaths often occur in weak thunderstorms when people remain outside, not during severe thunderstorms when people take shelter.
Students can plot the number of deaths caused by lightning and tornadoes in each month for a given year, using the statistics presented in the table on the next page.
Questions:
- During what month do most deaths caused by lightning occur?
- What season has the highest number of deaths caused by lightning?
Why does this make sense? - Approximately 3011 people died from lightning strikes from 1959 to 1990: 27% died in open fields and ball parks, 17% were under trees, 13% were boating or involved in water related activities, 6% were near tractors or heavy road equipment, 4% were on golf courses, 1% were on telephones, and 31% were in other locations. How many people were killed in open fields or ball parks?
- Lightning is approximately one mile away for each five seconds it takes the sound to travel that distance. If you hear thunder 35 seconds after you see the lightning, how far away is the lightning?
- Based on your experience and the information in this activity, make a set of lightning safety rules that apply to you in a specific situation. For example, list all of the precautions that you would take to protect yourself and others if you were on a ball field which is not close to home, or if you were baby-sitting for several children, or if you needed to use the telephone for an emergency. Write a title above your list of safety rules.
- Are tornado deaths and lightning deaths related?
Why or why not? - Most U.S. tornadoes occur between April and June- According to the data presented in this activity, during what month do most deaths caused by tornadoes occur?
Explain.
Answers:
- July
- Summer; People are outside more in summer; thunderstorms happen more in spring and summer
- 813 people
- 7 miles
- See the safety information (use cordless phone).
- 2 possible answers: No, lightning deaths occur most often in non-severe thunderstorms because people take shelter less promptly. Yes, both are spawned by thunderstorms.
- November, when tornadoes are more likely to occur in the Southeastern U.S. where there is less tornado awareness than in the mid U.S. Also, forests, haze, hills, and night time occurrences make tornadoes more difficult to see. Be sure to make the point that this is not always the case, as shown in the 1990 data.
Other interesting tidbits/anecdotes:
In July 1990, an 18-year-old man was struck and injured by lightning while attending a concert at an amphitheater 14 miles south of Birmingham, Alabama.
While chatting with a friend near a mulberry tree, a 35-year-old woman was knocked to the ground by lightning in San Manuel, Arizona. She had first and second degree burns, coins in her pockets were partially melted, and rivets on her jeans also were melted.
A 17-year-old girl was shocked and burned while talking on the telephone when lightning struck near the back of her house in Canton, Illinois.
When lightning struck a tree north of Kokomo, Indiana, it killed one person and injured four people who were seated in metal lawn chairs under the tree.
During 1990 there were 1132 tornadoes in 181 days, which killed 53 people, and injured 11. A tornado is the wildly spinning column of air, called a vortex, that extends downward from a cumulonimbus cloud and moves along the ground. Low air pressure within the vortex causes air near the Earth’s surface to rush into the vortex carrying dust and debris. Winds that can reach well over 200 miles per hour circulate counterclockwise around the center of the tornado. Known as the most powerful storms in the world, tornadoes can destroy almost anything in their paths.
Tornado Safety:
- If a tornado WARNING has been issued, this means that a tornado has been spotted or is about to strike. Tornadoes can happen so rapidly you may not get a warning. SEEK SHELTER IMMEDIATELY. Go to the basement, the lowest floor if there is no basement, or an interior hallway on the lowest floor in the center of the building.
- Stay away from windows.
- Get under something sturdy (work benches, pool tables, and staircases are good examples) and protect your head.
- On the street or in a car: LEAVE YOUR CAR. If there is no large building nearby, then lie flat in a ditch or low-lying area. (Be alert for flash floods.)
- It is a good idea to have a battery-operated radio or television to listen for warnings issued by the National Weather Service.
Lightning Safety:
- GET INSIDE OR STAY INSIDE! Stay inside homes, buildings, and automobiles. Automobiles can be lightning shelters because the current in the lightning stroke passes through the metal of the car and into the ground. Avoid touching any metal parts inside the car.
- Don’t use the telephone (lightning can travel down phone wires), or any plug-in electrical equipment like hair dryers, televisions, or computers.
- Get out of and away from open water (don’t take a bath or shower).
- Don’t stand underneath natural lightning rods such as large trees or isolated sheds in open fields.
- Get away from tractors and other metal equipment such as fences, golf clubs and bicycles.
- Stay off exposed rocks and ridges on hills and mountains.
- When you feel an electrical charge – if your hair stands on end or your skin tingles – lightning may be about to strike you. Crouch low to the ground, with your head down, IMMEDIATELY!
Citizen Science apps:
February 6, 2013 – The NOAA National Severe Storms Laboratory, in partnership with the University of Oklahoma, has launched a free app for users to anonymously report precipitation from their Apple or Android mobile device. With the mPING app, anyone can send a weather observation on the go. The user simply opens the app, selects the type of precipitation that is falling at his or her location, and presses submit. The user’s location and the time of the observation are automatically included in the report. All submissions will become part of a research project called PING – Precipitation Identification Near the Ground. NSSL and OU researchers will use the mPING submissions to build a valuable database of tens of thousands of observations from across the United States. The new mPING app for Apple and Android mobile devices lets users report rain, hail, sleet and snow to NOAA’s National Severe Storms Laboratory. See
http://www.noaanews.noaa.gov/stories2013/20130206_mping.html
Also there is SatCam that is an app for capturing observations of sky and ground conditions at the same time that an Earth observation satellite is overhead. The app submits images to a Space Science and Engineering Center server at University of Wisconsin-Madison help ground-truth—check the quality of the cloud products created from the satellite data. In return, get the satellite image that was captured at your location, anywhere in the world. http://satcam.ssec.wisc.edu/
See also
CIMSS iPad Library
http://cimss.ssec.wisc.edu/education/cla/iLibrary
(CIMSS = Cooperative Institute for Meteorological Satellite Studies)
as well as presentation about SatCam at
https://sites.google.com/a/globalsystemsscience.org/courses-lifelines/presentations-mtgs
~{}~
Objectives [] Planning [] Assessment [] Resources
Guides for each Chapter: 1 – 2 – 3 – 4 – 5 – 6 – 7 – 8 – 9
Index of TG Investigations
Guide for Chapter 8
El Niño
For the latest on El Niño information, visit websites such as http://www.odysseyexpeditions.org/oceanography.htm and http://www.nationalgeographic.com/elnino/mainpage.html
~{}~
Objectives [] Planning [] Assessment [] Resources
Guides for each Chapter: 1 – 2 – 3 – 4 – 5 – 6 – 7 – 8 – 9
Index of TG Investigations
Guide for Chapter 9
How Does Energy Flow
in Living Systems?
9 – II. Components of Food Webs
Activity: Food Web
Divide the class into small groups of 3 or 4 and assign each group a different environment, such as: ocean, desert, tropical rain forest, Arctic tundra, etc. Ask them to do library research concerning the animals that live in their environment and to construct a food web for the area. Have them share the finished product with the class.
Compare the food webs produced by the students. Construct on the chalkboard, or as a display, a food web that includes humans. Have the students prepare illustrations of the various parts of the web. Discuss why the phrase “Everything is Connected to Everything Else” is appropriate. Introduce current information on nutrition and vegetarianism to increase interest.
Have class discussion with questions 9.1-9.3 about food webs.
TG-EF9-1. Investigation: Energy Expenditures—A Transparent Problem
Adapted from Hands On!, fall 1994, TERC, Amy Shulman Weinberg
This is actually two activities. In Part 1, students learn about an animal’s energy expenditures by keeping a log of their own activities during a 24 hour period. Using this information, they calculate how much energy they themselves spend doing the activities they log.
In Part 2, students calculate the flow of energy through a simple food chain to address the question of how much solar energy an adolescent wolf requires to support its growth for one year.
Materials: Charts which show how many kcal/hour are expended doing different activities, kilogram scale, calculators
Part 1:
- Have students generate their own ideas about how to calculate their personal energy expenditures.
- Write sample data on the board for students who weigh different amounts and spend different lengths of time doing the same activity. Have students discuss who used the most energy and why they think so. They should identify weight and time as variables that effect energy expended. They then figure out their personal energy expenditure by multiplying their weight by the time spent and the number of kilocalories required per hour. Remember that some students are sensitive about their weight and will not be willing to share this information with the class.
Part 2
- 1. Have students make a flow chart of energy flow from the Sun to the wolf, using arrows and labeling it. They may draw pictures or use words as shown below.
sun →plants → deer→ wolf - Have students figure out how much energy each kind of organism takes in: first the wolf, then the deer that the wolf consumes, and finally the vegetation that the deer consume. In the process they gain insight into how little of the original energy from the Sun becomes new wolf tissue.
Students should already know that of all the energy that an organism takes in (I) only a small percentage produces new tissue or biomass (P). Much of the organism’s energy is lost as heat during its fuel burning process (respiration) Other energy might be unused and excreted as waste.
A wolf puts only about 2 % of its total yearly intake in kilocalories into producing new growth.
Therefore, 2% of Iwolf = Pwolf - Deer put only about 1% of their total yearly intake in kilocalories into producing new growth.
Therefore, 1% of Ideer = Pdeer - Plants put only about 0.5% of the sun’s energy into new growth. Therefore, 0.5% of Iplant = Pplant
- Here is the problem: A typical adolescent wolf produces approximately 8 kilograms of new tissue a year, which has a caloric value of 10,000 Kilocalories.
How much energy does the wolf take in every year?
Every student can decide how to solve for Iwolf. The student can reason that because 2 per cent of a wolf’s yearly intake is 10,000 kcal, then 100 per cent is 50 times that or 500,000 kcal. Others could make ratios or solve algebraically.
.02(Iwolf) = 10,000 kcal
——> Iwolf = 10,000 kcal ÷ .02 = 500,000 kcal - Next, students figure out the yearly total intake of the deer, assuming for simplicity that the wolf’s yearly intake comes only from deer. Therefore, Iwolf, which is equivalent to 500,000 kilocalories, equals the new amount of deer tissue produced (Pdeer) as well (Iwolf = Pdeer = 500,000 kcal). What does Ideer = ?
(If 1% of Ideer = 500,000 kcal, then 100% of Ideer must be 50,000,000 kcal.) - In the final part, students calculate how many kilocalories plants take in (Iplant) from the Sun. At this point, they must understand that Ideer which is equal to 50,000,000 kcal, is also equal to the amount of new plant tissue produced, Pplant.
Therefore, (Ideer = Pplant = 50,000,000 kcal.)
Iplant = 10,000,000,000 kcal
Therefore, by the time the energy taken in by plants (10,000,000,000 kcal) becomes a part of a wolf (10,000 kcal) it has been reduced by a factor of a million kilocalories.
Once students have completed their calculations, have them design visual representations to show the relative amounts of energy lost as energy moves through the food chain. You may have to point out to students that the number of kilocalories produced by each trophic level on the food chain is equal to the amount of energy consumed at the next trophic level. Therefore, the amount of energy produced by the deer is equal to the number of kilocalories that wolves consume. The inefficiency of energy use by each organism leads to massive inefficiency of energy transfer among organisms which increases as the trophic levels go higher.
Assessment:
You may wish to check student understanding by having them draw a biomass period to show the reduction in biomass at each trophic level, justifying its shape by backing it up with the mathematical calculations they have made. Problems using other organisms could be posed, to check and see if they understand that these rules hold for all organisms at varying trophic levels. These could be extended to biomass pyramids as well.
~{}~
TG-EF9-2. Investigation: Energy Bingo
by R. James Kurtz, University of Detroit Jesuit High School, Detroit, Michigan
and Elizabeth Montgomerie-Jones, Springbrook High School, Silverspring, Maryland
TIME REQUIRED: 45 minutes
To reinforce understanding and to verify that the students are making the proper global and conceptual connections, have the students draw a concept map using 16 of the concepts listed at right. Students must show links between terms and explain their basis for making those connections. Students must use the concepts: chemical energy, photosynthesis and respiration. Explanations must show clear understanding of the concepts.
| 1) CO2 | 7) energy flow | 13) joule | 19) residue |
| 2) fossil fuel | 8) greenhouse gas | 14) mass | 20) pollution |
| 3) chemical energy | 9) greenhouse effect | 15) temperature | 21) fuel |
| 4) heat energy | 10) oxygen | 16) photosynthesis | 22) respiration |
| 5) specific heat | 11) carbon | 17) paraffin | 23) atmosphere |
| 6) combustion | 12) calorie | 18) hydrocarbon | 24) climate |
Note: Although concept maps may vary from group to group, students should be able to connect the words by drawing on their prior knowledge, their lab experience, and the class discussion. For example, they should be able to make the connection between food, energy stored and photosynthesis.
Playing Energy Bingo:
Using the list of 24 words, students can play bingo. One approach is to pass out teacher-prepared bingo cards so that all students have a different card. Sample bingo cards are at the bottom of this page.
Another approach is to have the students generate their own bingo cards, working in pairs or in groups of three. The teacher may write the words on the blackboard or display them using an overhead projector. The term “Global Systems” represents the “free space” in Bingo for all cards.
After each student has received a bingo card, the teacher can work with the class to generate descriptions that connect the terms with the activity and show its global implications. Once there is a general consensus, the teacher can call out randomly any of the concepts (or agreed upon connections or ideas). Students who have made the connections will be able to cross out their terms and be on the way to completing a bingo card. Students who are confused or uncertain will be able to share in a cooperative learning mode.
As in the case of concept mapping, it is important that the students successfully arrive at conceptual understanding so that they develop the ability to make connections between each term and its global implications. For instance: carbon dioxide could be described as “the greenhouse gas generated by the burning of the peanut,” or energy flow could be described as “the change of stored energy to heat energy.”

~{}~
Objectives [] Planning [] Assessment [] Resources
Guides for each Chapter: 1 – 2 – 3 – 4 – 5 – 6 – 7 – 8 – 9
Index of TG Investigations
Index of Teacher Guide Investigations
- TG-EF1-1. Energy Transformations
- TG-EF1-2. Energy Conversion
- TG-EF1-3. To Eat Or To Burn—The Energy’s the Same
- TG-EF1-4. Human Sling Shot
- TG-EF2-1. Demonstration: Sea Floor Spreading
- TG-EF4-1. Fission and Fusion Game
- TG-LB7-1. An Inversion Model
- TG-EF9-1. Energy Expenditures—A Transparent Problem
- TG-EF9-2. Energy Bingo
~{}~
Objectives [] Planning [] Assessment [] Resources
Guides for each Chapter: 1 – 2 – 3 – 4 – 5 – 6 – 7 – 8 – 9
Index of TG Investigations
Resources for Teaching Energy Flow
For latest material relevant to Energy Flow,
see the Staying Current section of the GSS website.
The list below is from the original development of GSS and is out of date and in no way exhaustive for the resources that are available for teaching ecosystem change and related topics. However, if the teacher is new to the discipline and is looking for basic reference materials, these are a number of good places to begin.
Software
Earthquest, from Earthquest Inc., 125 University Ave., Palo Alto, CA 94301, (415) 321-5838. This mini-encyclopedia covers more than 150 subjects, which are brought to life through dozens of interactive challenges, graphics, animations, samples of languages and music, 43 maps, and a variety of charts and tables.
CD-ROMS Contains over 155,000 bibliographic records of the acquisitions of four of the USGS libraries since 1975. IBM/compatible only. Earth Science Data Directory (ESDD), OCLC Online Computer Library Center, Inc. 6565 Frantz Rd., Dublin, OH 43017-0702, Attn: Mary Marshall, 614-764-6000 Plate Tectonics, from TASA Graphics. Describes via excellent graphics processes of plate tectonics. Includes “motion” graphics and review sections. I use this in class and the students found this information very interesting. Space Sciences Sampler: Volumes 1-2., from CDROM Inc., 1667 Cole Blvd., Ste 400, Golden, CO 80401, 303-231-9373; FAX: 303-231-9581. Volume 1 includes 800 of the best Voyager images of Uranus, its rings and moons. Space and Earth science data collected from scientists during a NASA project called the PDS Interactive DATA Interchange. Volume 2 contains a wide variety of space science data collected during the Interactive DATA Interchange in 1986. Both volumes were produced by NASA and the University of Colorado. The discs conform to ISO 9660 Standard, Level 1, for CD-ROM interchange. IBM/compatible only. Voyages to the Outer Planets, Vol. 1-12, from CD-ROM Inc., 1667 Cole Blvd., Ste 400, Golden, CO 80401, 303-231-9373; FAX: 303-231-9581. This is a 12 disc set with over 25,000 images returned by NASA’s twin Voyager Spacecraft during their journeys to Jupiter, Saturn, Uranus, and Neptune. Software included for image display for Macintosh with EGA/VGA or better, or IBM/compatible. Water Resource Abstracts; Volume 1., from CDROM Inc., 1667 Cole Blvd., Ste 400, Golden, CO 80401, 303-231-9373; FAX: 303-231-9581. 1967-present. The entire 225,000 abstracts of the USGS on one disc. Advanced software features make this disc of choice for the USGS and any other users. A NISC DISC Publication. IBM only
Books
How to Build a Habitable Planet, ELDIGIO PRESS, LDGO Box 2, Palisades, NY 10964. An excellent book on the physical evolution of the solar system and the Earth. Much about the chemical evolution of the Earth, including the carbon cycle. A few chapters on Earth’s temperature controls, water systems, resources for civilization, and the future of the Earth at the hands of humans. Broecker, from Columbia Univ., is one of the premier so-called Earth System scientists. He is a chemical oceanographer who works a lot with biologist, geologists, and climatologists.
The Thomas Edison Book of Easy and Incredible Experiments, John Wiley and Sons Inc., New York. The book is full of experiments that students could do or teachers could use for demonstrations related to magnetism, electricity, radio, camera, energy. Volcanism and Climate Change, American Geophyscial Union, 2000 Florida Ave., NW, Washington, DC 20009. A nice, short volume that explains how volcanoes can control climate, with much of the focus on the recent Mt. Pinatubo eruptions in the Philippines. Cheap! Useful for discussion of energy, suspensions, and reactions in the atmosphere.
GeoMedia, from InterNetwork, Inc., 411 Seventh St., Del Mar, CA 92014 Great program for biodiversity. Maxis Corporation (see above).
SimEarth, Maxis Corporation, Two Theatre Square, Orinda, CA 94563-3346, 510-254-9700. SimEarth is a computer simulation of the grand cycles which maintain a livable environment on Earth. The program tracks atmospheric gases, air and water temperatures, crustal movement, biomass and biodiversity, and many other indicators. It was released as a best selling game. Maxis now publishes a teachers manual to accompany it. SimLife Teaching Earth Science through new technology. Textual and visual information on water cycle, earthquakes and maps. Macintosh only.
Videos
Energy Flow, TV Ontario, US Sales Office, 143 W. Franklin St. Suite 206, Chapel Hill, NC 27516, 1- 800-331-9566 fax 919-967-8005. An excellent video. Features an astronaut stranded in space. How can he survive longest? Problem solving activity and manual.
Power to Dream, from Pennsylvania Department of Energy. Power to Dream is a fast-paced overview of the history of energy use by man, highlighting major discoveries that impacted the world. It then shows the energy use per day of a typical Pennsylvanian and her sources of energy. This segment concludes with a total use multiplied state wide. It then explores sources of energy and problems associated with each. Future alternatives are looked at and current research.
Curriculum Guides
Geological Society of America, Boulder Colorado. Student activity. Video and model building. Student activity consists of building a series of models illustrating the geologic history of Boulder Colorado with video @ 30 minutes. Cover Laws of Superposition, Law of Horizontality, etc..
Global Warming, a GEMS guide from the Lawrence Hall of Science, U.C. Berkeley, Berkeley, CA 94720- 5200 (510) 642-7771. Have a little extra time? The “ Global Warming Game” activity requires extra planning but is well worth it. You’re given step-by-step visual instructions for carrying out the activity along with a complete narrative. The activity involves students in several activities: a board game culminating in a class tally, a short class dramatization, and homework sheets. The game board with pieces and the worksheets are all reproducible. In this stimulating activity, students recognize what happens to the light energy from the sun when it enters the Earth’s atmosphere. The concept of visible and infrared photons interacting with molecules in the Earth’s atmosphere is clearly demonstrated. The relationship between the amount of carbon dioxide in the atmosphere and the extent to which energy from the sun is trapped by the molecules is explained. This activity could take 2 or 3 classes to complete.
Solar Physics and Terrestrial Effects, A Curriculum Guide for Teachers, Grades 7-12. National Oceanic and Atmospheric Administration (NOAA). An excellent collection of activities and text relating to the Sun and how it affects Earth systems. By Roger P. Briggs and Robert J. Carlisle, Boulder Valley Schools; edited by Babara B. Poppe, Space Environment Laboratory, NOAA. U.S. Government Printing Office (USGPO): 1993—574-133.
Bibliography for Energy Flow
This listing contains references that were used in writing the Student Book and Teacher’s Guide for Energy Flow.
Alvarez, Walter, Alvarez, Luis Michel, Helen, and Asaro, Frank, Science, June 6, 1980.
Alvarez, Walter and Asaro, Frank, and Courtillot, Vincent E., “What Caused the Mass Extinction?” Scientific American, Vol. 263, No. 4, page 76-92, October, 1993.
Armbruster, Ann, and Taylor, Elizabeth A., Tornadoes, New York: Franklin Watts, 1989.
Aylesworth, Thomas G., and Aylesworth, Virgina L., The Mount St. Helens Disaster, New York: Franklin Watts, 1983.
Beatty, J. Kelly, Chaikin, Andrew, Editors, The New Solar System, Third Edition, New York: Cambridge University Press, 1990.
Broad, William J., “New Theory Would Reconcile Rival Views on Dinosaurs’ Demise,” The New York Times, pages B7-B8, December 27, 1994.
Christensen, John W., Global Science (Text and Student Lab Manual), Kendall Hunt Publishers, 1984.
Coffin, Millard F., and Eldholm, Olav, “Large Igneous Provinces,” Scientific American, Vol. 269, No. 4, page 42-49, October, 1993.
Decker, Robert, and Decker, Barbara, Volcanoes, San Francisco: W.H. Freeman & Co., 1981.
Dobb, Edwin, “Hot Times in the Cretaceous,” Discover, February, pages 11-13, 1992.
Eagleman, Joe R., Severe and Unusual Weather, New York: Van Nostrand Reinhold & Co., 1983.
Earth Science Curriculum Project, Investigating the Earth, Teacher’s Guide, Parts 1 and 2, Boston: Houghton Mifflin & Co., 1972.
Gribbin, John, Blinded by the Light: The Secret Life of the Sun, New York: Harmony Books, 191991.
Grove, Noel, “Volcanoes: Crucibles of Creation,” National Geographic, pages 5-41, December, 1992.
Hewitt, Paul G., Conceptual Physics (Adisson Wesley, 1987), pp. 115-118 & 300-310.
Holton, Gerald, Rutherford, F. James, and Watson, Fletcher G., Directors, Project Physics, New York, Holt, Rinehart, and Woinston, Inc., 1970. Kasting, James F., toon, Owen B., and Pollack, James B., Scientific American, February, 1988, page 93.
Larson, Roger L., “The Mid-Cretaceous Superplume Episode,” Scientific American, Vol. 272, No. 2, pages 82-86, February, 1995.
Lauber, Patricia, Volcano: The Eruption and Healing of Mount St. Helens, New York: Bradbury Press, 1986.
Lord, John and Braaten, Glenn, Energy Flows in Nature: Teaching About Energy, Part 2 (Santa Monica: Enterprise for Education, 1986), pp. 2-42B ff.
Milne, Lorus J., and Milne, Margery, Understanding Radioactivity, New York: Atheneum, 1989.
Monastersky, Richard, “Closing in on the Killer,” Science News, Vol. 141, No. 4, pages 56-58, January 25, 1992.
Morrison, David, Wolff, Sidney, and Fraknoi, Andrew, Abell’s Exploration of the Universe, Seventh Edition, Philadelphia: Harcourt Brace Jovanovich College Publishers, 1995.
Pasachoff, Jay M., “The Sun: A Star Close Up,” Mercury, May/June, 1991, pages 67-76.
Shane, Scott, Discovering Mount St. Helens: A Guide to the National Volcanic Monument, Seattle and London: University of Washington Press, 1985.
Smithsonian Exposition Books, The Fire of Life, New York: W.W. Norton & Company, 1981.
Staff of The Daily News, Longview, Washington, and The Journal-American, Bellevue, Washington, Volcano: The Eruption of Mount St. Helens, Longview Publishing Company: Longview, Washington, and Madrona Publishers: Seattle, 1980.
Stanford, John L., Tornado: Accounts of Tornadoes in Iowa, Second Edition, Ames, Iowa: Iowa University Press, 1987.
Tepper, Morris, “Tornadoes,” Scientific American, Vol. 198, No. 5, pages 95-101, May, 1958.
Watts, Alison W., Greeley, Ronald, and Melosh, H.J., The Formation of Terrains Antipodal to Major Impacts,” Icarus, Vol. 93, pages 159-168, 1991.
Wentzel, Donat G., “The Solar Chimes: Searching for Oscillations Inside the Sun,” Mercury, May/June, 1991, pages 77-84.
Whipple, A.B.C., and the Editors of Time-Life Books, Planet Earth: Storm, Alexandria, Virginia: Time-Life Books, 1982.
Williams, David A., and Greeley, Ronald, “Assessment of Antipodal-Impact Terrains on Mars,” Icarus, Vol. 110, vpages 196-202, 1994.
Wilson, J. Tuzo, et. al., Readings from Scientific American: Continents Adrift and Continents Aground, San Francisco: W.H. Freeman & Co., 1976
TG-EF0-. Investigation: TITLE
TEMPLATE