TG Ecosystem Change
{ GSS Teacher Guide Index } { All GSS Books }

_____________________________________________
Objectives [] Planning [] Assessment [] Resources
Guides for each Chapter: 1 – 2 – 3– 4 – 5 – 6 – 7
Teaching Objectives
Ecosystem Change addresses the topic of the natural interaction of organisms in their environment and the affect human activity has on the environment. The first chapter is an overview, bringing in the controversial Gaia hypothesis, that the Earth functions as an “organism.” It introduces the idea of positive and negative feedback and the use of modeling to understand living systems.
Chapter two focuses on energy and how it moves through an ecosystem. As students study this, they can grasp the complexity of a biological system and the movement of energy to all areas of the system.
In Chapter three, students get to meet Dr. Samira Omar, a research scientist in the field of rangeland ecology. Students get a first hand look at the devastating effects of humans on a fragile ecosystem.
Chapter four looks at natural, large scale models of global systems, that of the Ice Ages. Students can appreciate the complexity of the system and the natural positive and negative feedback that cause them. This leads into a discussion of temperature change and the gases involved in that potential change.
Chapter five focuses on Carbon, the most significant gas in its form, Carbon Dioxide. Students realize that Carbon is necessary for life, but in large amounts, can raise the temperature of the Earth significantly. Trees are an essential part of the Carbon Dioxide balance and the consequences of tree loss in an environment are detailed in the case of Atlanta, Georgia.
Carrying capacity and habitat fragmentation are the two areas of focus for chapter six. The idea that ecosystems have a finite size and ability to support species and that it is dependent on the energy coming into the system and the size of the ecosystem itself. When fragmentation occurs, it is followed by species diversity loss and invasive species into areas in which they are usually not found.
The final chapter discusses what can be done by people to reduce their impact on the environment. It is emphasizes that small changes in their habits can result in a significant, positive change. It ends with a reexamination of the Gaia Hypothesis and a final plea that we are all dependent on the environment and we all impact it in some way. The goals of this module are briefly summarized in the following section.
Goal 1: Students appreciate the complex interdependence and interaction of life on Earth.
- Objective 1A: students can explain the idea of a system and affect of feedback on the system.
Goal 2: Students understand the importance of energy to maintaining ecosystems
- Objective 2A: Students can explain the ideas of food webs and food chains that show how energy is transferred from organism to organism in the environment.
- Objective 2B: Students understand the consequences of human impacts on an ecosystem.
Goal 3: Students recognize the ability of ecosystems to change naturally in response to changes on the Earth.
- Objective 3A: Students understand the complexity of a natural feedback model like Ice Ages.
- Objective 3B: Students recognize the significance of Carbon in the biosphere.
- Objective 3C: Students understand the effects of temperature change in an environment.
Goal 4: Students understand the limits of environments to support life and the human impact on it..
- Objective 4A: Students can explain the ideas of limiting factors and Carrying Capacity on the area and population of an ecosystem.
- Objective 4B: Students understand the importance of preserving habitats and the consequences of habitat fragmentation and species diversity.
- Objective 4C: Students realize that even with small changes, they can have a significant impact on species and habitat preservation.
Objectives [] Planning [] Assessment [] Resources
Guides for each Chapter: 1 – 2 – 3– 4 – 5 – 6 – 7
Planning Your GSS Course
Global Systems Science is intended to be an inquiry-based course, with many hands-on laboratory activities and interactive discussions; but the extent to which it is based on inquiry depends on you!
The student guide, Ecosystem Change, contains two laboratory experiments (chapter 1 and 5) and three investigations (chapter 2, 6 and 7). It is assumed that, in this unit especially, teachers will try and get there students outdoors to investigate the environment around them and develop project ideas that involve their surroundings. This teacher’s guide provides additional activities and ideas for you to enrich your course. High school teachers who participated in a GSS INSTITUTE in 1995 prepared many of these additional activities. Each of these activities is located in the chapter to which they are most appropriate.
Most of these activities, those in the student guide as well as those in this teacher’s guide are meant to be adjusted to fit the needs of your curriculum. You may add to or delete segments of each of these as you see fit. Feedback is welcome on all of them since they are all works in progress.
Additionally, the resources at the end of the guide are there as suggestions as supplements to the readings in the booklet as well as more detailed background reading for the teacher or the student who wishes more information on selected topics. As well, these are not meant to be all inclusive; there are many more books, software and other information which are not included that the teacher may already be aware of and has used in his or her classroom. Your library and local conservation office may also have other resources that could be useful.
When you have completed this unit, you may want to continue with other GSS units that follow from Ecosystem Change. For example:
- Life and Climate is concerned with the evolution of our planet over the past 4.6 billion years. It emphasizes the factors that have affected the Earth’s atmosphere and climate, how the changing climate has affected the evolution of life, and how life has profoundly affected Earth’s climate in the past. Students learn how we know what we know about Earth’s prehistory. Life and climate can be considered a companion volume to Changing Climate. It places current climate trends into a much broader context.
- Energy Flow illustrates one set of principles on which scientists base their analysis and prediction of global climate change. In chapters most closely related to Changing Climate, students trace energy from its production within the Sun, to what happens to it when it enters the atmosphere and interacts with greenhouse gases.
- Losing Biodiversity discusses the vast biodiversity of life on Earth and the threatened status of many of its species. Students look at the work of Charles Darwin and how the species that inhabit the Earth originated. It links to many of the topics in Life and Climate, especially the discussion of life in the past. It focuses on the complexity of life and its fragility in life of human activity.
The ideas presented in the Chapter-by-Chapter notes are just suggestions. From time to time we will make suggestions for small or large group discussions, questions to encourage thinking about the information that is presented, or ways to engage your student’s interests. However, your best guide will be your own intuition.
Please keep in mind that this Teacher’s Guide is a work in progress. Please annotate any questions you might have, or ideas that would work in addition to, or in place of those suggested. Note anything that doesn’t work and how students seemed to grasp the concepts, develop skills or recognize the relationship between their own actions and global environmental change so that we can include them in future editions of the Teacher’s Guide. Send your suggestions to:
gssmail@berkeley.edu
Global Systems Science
Lawrence Hall of Science
University of California
Berkeley, CA 94720-5200
Alan Gould
Global Systems Science Director

Before you start
- At least a day or two before you begin Ecosystem Change, distribute copies of the three assessment tasks on the previous pages and ask your students to answer the questions. Explain that they will not be graded on these. The purpose is for them to show you what they already know so that you can plan the course accordingly.
- Invite students to bring in news clippings about the diversity of life on our planet, endangered species, and other related topics. Put these on a bulletin board, organized by topic. Relate the articles to class discussions, and make them available for students to use at the end of the unit, when they are asked to identify an article on their choice as the focus of an essay
Objectives [] Planning [] Assessment [] Resources
Guides for each Chapter: 1 – 2 – 3– 4 – 5 – 6 – 7
Assessment Tasks
1. Portfolios
General ideas for assessing student progress towards the goals and objectives of the GSS course are suggested in the Basic GSS Overview. We especially encourage the use of portfolios as a means of providing feedback to students and to demonstrate evidence of student progress to parents. Portfolios for Ecosystem Change might include:
- Written answers to the numbered questions in each chapter.
- An art or writing project to describe the environment where each student grew up.
- Systems diagrams.
- An expanded diagram of the water cycle in a tropical rain forest (in section 1-III of Ecosystem Change student book).
- Diagrams and written descriptions showing examples of positive and negative feedback (1-IV, 1-V and page 43 of Ecosystem Change student book).
- Lab report on “Make a Model Ecosystem” (Investigation 1-I of Ecosystem Change student book).
- Report on “Mapping Future Wetlands” (Investigation 4-I of Ecosystem Change student book)
- “Estimate the tree canopy of your school or neighborhood, then develop a plan with your friends to increase the tree cover by 50%” (End of 5-VI in student book).
- Lab report on “Decomposition in a Bag” (page 51 of student book).
- Report on “How Do Cultures Affect Ecosystems” (Investigation 5-I of student book).
- Report on “Environmental Savings for Recycling” (Investigation 7-I of student book).
- “Write a Letter to the Future” (Found in section 7-IV of student book).
- Concept maps of selected chapters of the Student Guide.
- An essay or other form of assignment in response to the challenge “In Your Opinion.”
In addition to portfolios, we suggest that you use assessment tasks both before and after presenting the unit. The papers that students’ complete before beginning the unit will help you diagnose their needs and adjust your plans accordingly. Comparing these papers to the students’ responses on the same tasks after completing the unit will allow you to determine how your students’ understanding and attitudes have changed as a result of instruction.
Tasks which we suggest be used for pre- and post- assessment are as follows:
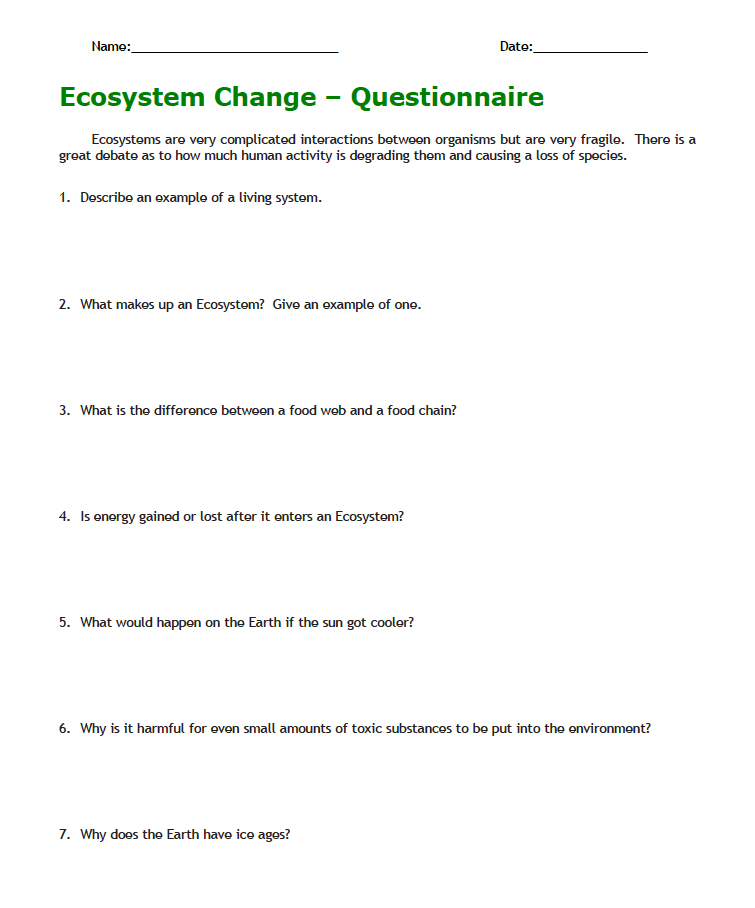
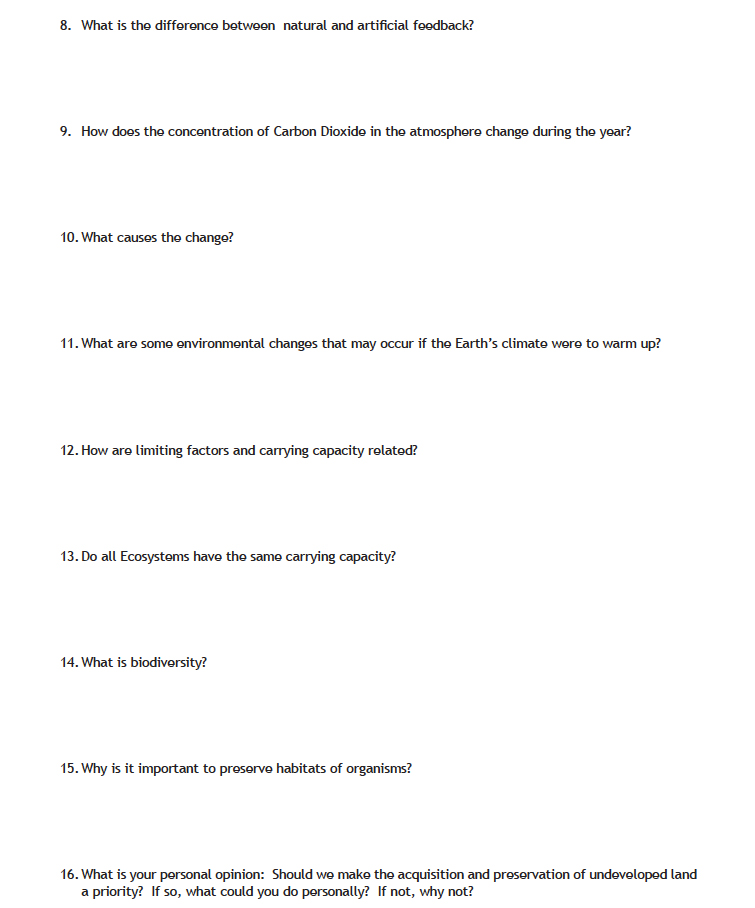
2. Questionnaire
These questions are designed to determine how students’ knowledge of key concepts have changed during the unit, and whether or not they have changed their opinions concerning personal actions and environmental issues. Download Questionniare (pdf).
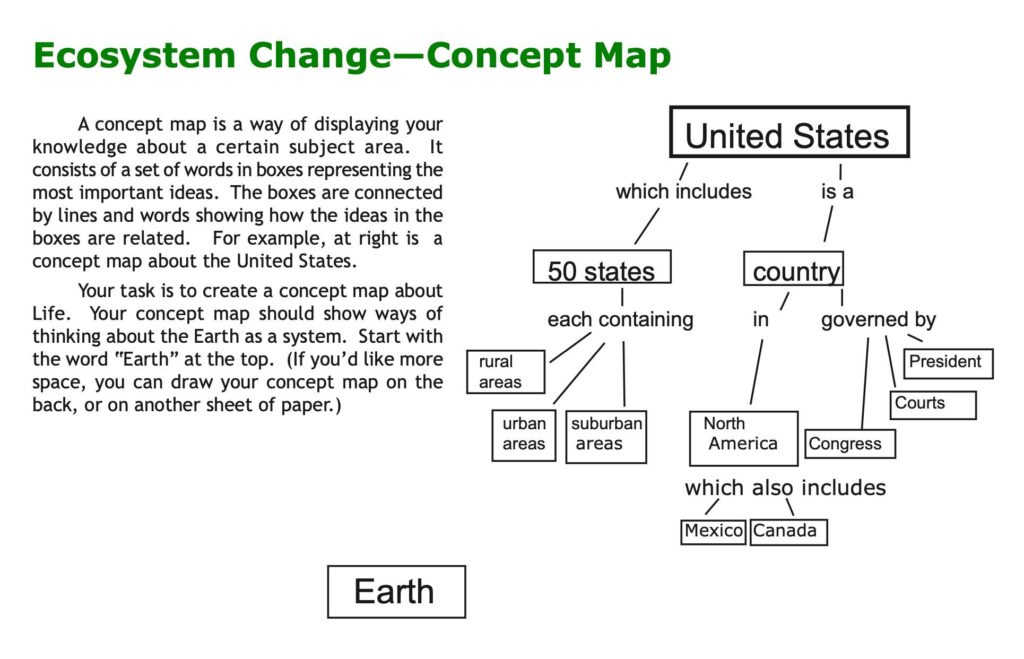
3. Concept Map
Asking students to create a concept map before and after the unit is one way to determine which concepts they have learned and their understanding of the connections among these concepts. If students have not had experience in concept mapping, you might want to start them out with a hand-out showing an example (master on p. 9), a general idea of what they are to map, and starting word(s) to help get them started. Once they have had experience with concept maps, they can create them on blank sheets of paper (no photocopying required.
Alternatively, they can use concept mapping software such as
- Inspiration (http://www.inspiration.com)
- Decision Explorer (http://www.banxia.com).
- CMap (http://cmap.ihmc.us/conceptmap.html – free for noncommercial use).
- Omnigraffle (http://www.omnigroup.com/applications/omnigraffle Mac OSX)
- Freemind (http://freemind.sourceforge.net/wiki/index.php/
- Main_Page – open source software for mind-mapping.)
- Microsoft Draw (comes with Microsoft Office)
Some possible key words to use: biology, ecosystem, biome, negative feedback, positive feedback, desert, food web, biosphere, carbon, carbon dioxide, habitat, decomposition, carrying capacity, Gaia, species. These assessment strategies fall along a spectrum from traditional to nontraditional ways of assessing student progress. The Questionnaire is a traditional way to elicit student understanding. It assesses students’ abilities to express themselves as well as insights that they gained from the unit. The Concept Map is nonlinear. Students do not need to think in terms of sentences and paragraphs, and their ideas can flow more freely. Students who are more visual might be better able to show what they know on this task than on the Questionnaire. The Porfolio represents yet another approach to evaluating the overall quality of student work. Download Concept Map (pdf).
Interpreting Student Responses
The tasks should be interpreted in terms of the objectives listed in the objectives section of this guide. This is straightforward in the case of the questionnaire, where questions correspond to the objectives as follows:
The Concept Map and Drawing Interpretation tasks are more loosely related to specific objectives. Comparing students’ papers before and after instruction may show that they have learned more about some objectives than others, or that certain misconceptions persist while others have been corrected. Eventually, we hope to be able to provide sets of instructions (called “rubrics”) to score student papers with respect to course objectives; but we do not yet have enough student data to do this.
In the meantime, we suggest that you pair students’ pre-and post-assessment papers and compare them. With the list of objectives in mind, look for changes in the students’ attitudes and understanding. As you look through your students’ papers, you’ll be able to jot comments for individual students concerning main points they may have missed, or praising them for their insights and ideas. After looking over all of the papers you will be able to write down some generalizations about what the class as a whole learned or did not learn during the course.
You may want to make two class sets of each of the 3 tasks, using one color of paper for the pre-assessment measures and a different color of paper for the post-assessment measures.
Objectives [] Planning [] Assessment [] Resources
Guides for each Chapter: 1 – 2 – 3– 4 – 5 – 6 – 7
Guides for Each Chapter
Guide for Chapter 1 – Earth Alive!
This chapter sets the stage for ecosystems by discussing the idea of systems and introduces the Gaia theory, the idea, proposed by James Lovelock that the Earth is self-regulating with its own systems providing positive and negative feedback. This would be a good point for students to think about how the Earth works. Some good questions would be:
- Can a planet be considered “alive?”
- What are some examples of self-regulation on the Earth?
The chapter connects the idea of living systems to an ecosystem or a system involving living and non-living things. In a map, the chapter shows the many biomes of the world and focuses on tropical rainforests as an example. Many students have a “disconnect” with their own environment and don’t realize that it is a complex system in it’s own right. If your school has green space around it, it would be a good idea to take a “field trip” around the school grounds to see the diversity in the neighborhood.
With the map that illustrates the biomes of the world, you could illustrate the scope of size when comparing biological regions such as ecosystem and biome. Many students don’t realize that there is a scale of size when looking at biological regions and interactions of organisms.
- Biosphere
- Biome
- Ecosystem
- Community
- Niche
The title of this section, Everything is Connected to Everything Else, is a key concept that should be emphasized when discussing ecosystems and biomes. The next activity is a good way to illustrate the various factors that create the different biomes, including ocean currents, prevailing winds and geography.
The connection between climate, ocean currents and prevailing winds with the formation of biological regions such as biomes is important to stress to students.
The tropical rainforest is familiar to many students through the news and the numerous science programs found on television. However, the complexity of the system is often unknown to them. At this point in the module, the rainforest that is discussed can be used to reinforce how an ecosystem works.

TG-EC1-1. Investigation:
Imaginary Continent
Materials Needed:
• Ruler
• Colored Pencils
• Maps of Ocean Currents and prevailing winds
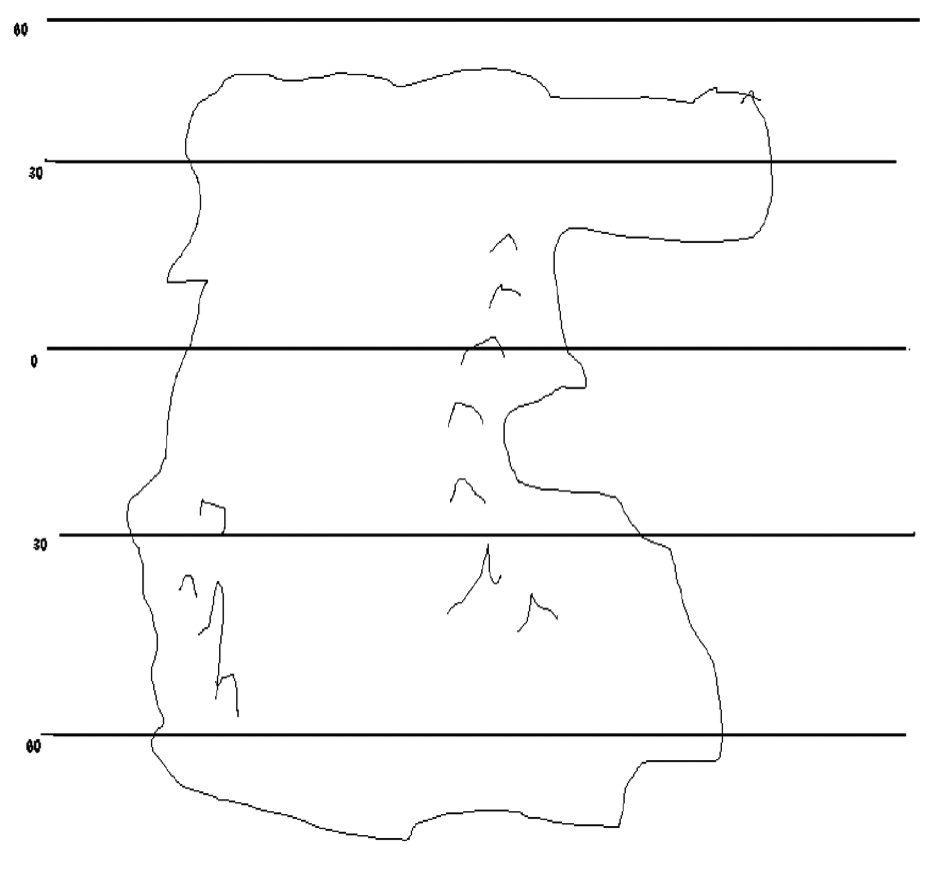
The map above is an imaginary continent that stretches from the geography of northern Canada and the tip of South America. Using maps of ocean currents and prevailing winds on the Earth, draw in the currents and winds that would be found in the world. Do each in a different color so you can tell them apart later.
Once they are all drawn, divide the continent into different regions based on temperature and precipitation. For example, one region would be cold and dry and another would be hot and wet. What about mountains? Color in each region. Are any of these areas similar to those found on Earth?
A follow-up to this activity might be for students to research the basic characteristics of a specific biome and have them match them with similar areas on the imaginary continent.
TG-EC1-2. Investigation:
Mapping Ecosystems
by Theresa Thompson, Gro Buer
PURPOSE:
The purpose of this activity is to familiarize the student with the different biomes and ecosystems of the world, the impact of humans and global warming on these systems, and the possible solutions to these concerns.
STUDENT OBJECTIVES:
Students should be able to:
• identify all ecosystems (biomes) on a world map
• give characteristics of each ecosystem (biome)
• discuss human impact on the ecosystem (biome)
• discuss the impacts of global warming on the ecosystem
• provide possible solutions for environmental concerns
- PROCEDURE:
- 1. Select a research team as directed by the teacher
- 2. Select a biome (or have one assigned by the teacher)
- 3. Research, in the school or public library, the biome using the following guidelines:
- a. physically indicate the biome on the world map; trace biome, label and tape to world map; include the average latitude and the larger countries in your discussion
- b. give the characteristics of the biome; i.e. plants
- c. give the abiotic factors-climate (temperature/ rainfall) and any geological processes
- d. give other biotic factors, such as the animals
- e. specify the interactions between the biotic and abiotic factors (ecosystems); include how the animals and plants are specifically adapted for this area
- f. indicate human impact on the ecosystem; include how human activities are affecting the system
- g. predict what impact global warming will have on the ecosystem; answer the following questions.
- 1. What human activities have caused environmental impacts on the ecosystem? Discuss each.
- 2. What do you predict will happen to your ecosystem if the world temperature rose 10°C?
- 3. Would the species of your ecosystem move to a higher/ lower elevation or latitude, or remain, as the climate warms? Give reasons for your answers.
- 4. Would all of the species in a vegetational zone have to move together? Explain your reasoning.
- 5. Which is more logical to determine first, the ranges for plants or for animals? Why?
- 6. Predict what will happen to the humans in your terrestrial ecosystem if global warming occurs. Remember to think about food supply and other needs, such as water. How will the water biomes be affected? Consider food supply and other needs. Will the impact be as great in a water/marine biome? Explain.
- 7. What solutions would you suggest to lessen the impact that humans have on your ecosystem? List several.
- 8. How does your precipitation/temperature data compare with an adjacent ecosystem? How are they similar, how are they different?
- h. suggest possible solutions to environmental impacts
4. Prepare a visual presentation. Suggestions: a. diorama b. poster c. slides
RESULTS:
Students should use the following guidelines in presenting their activity:
- Outline the research on notecards; reading from a book is not acceptable.
- Each member of the team should contribute equally. During the research process, your team should decide who will discuss each part of the assignment. Each team should design their own method of presentation.
SAMPLE GRADING SHEET:
TEAM MEMBERS:
1.
2.
3.
4.
I. Biomes
_____A. Location
_____B. Latitude
_____C. Countries
II. Characteristics (plants)
_____A.
_____B.
_____C.
_____D.
III. Abiotic Factors
_____A. Temperature
_____B. Rainfall
_____C. Geological processes
IV. Biotic Factors
_____A.
_____B.
_____C.
_____D.
V. Interactions
_____A. Plants
_____B. Animals
VI. Human Impact
_____A.
_____B.
_____C.
_____D.
VII. Global Warming Questions and Predictions (10 points)
VIII. Solutions (10 points)
An important part of the entire GSS curriculum is the idea of feedback, positive and negative, and artificial and natural. A number of the modules focus on the artificial feedback induced by human activities. In this module, the natural mechanisms of the Earth are highlighted. If you have used the idea of positive and negative feedback in previous units, this would be a good time to reinforce it but having students give examples of natural feedback mechanisms on the earth. Doing this in a concept map might be an excellent way of accomplishing this task.
An important part of science is modeling. Because ecosystems are so vast both in complexity and area, it is very difficult for students to see an entire ecosystem or really visualize all of its components. The investigation, Making A Model Ecosystem, gives students a sense of the complexity of ecosystems by creating a small system of their own design. This lab isn’t designed to be “cookbook” but to allow students a wide latitude in designing what they want in it. Many of these systems might fail and will need intervention or remodeling in order to last for any period of time. This is what makes this an excellent way to understand ecosystems.
The Biosphere II project is an excellent tie-in to this chapter and to the lab. They have a website detailing it and students studying it realize that it isn’t as perfect a system as one might think.
One way of bringing this into the discussion is to have students debate the merits of whether scientists should have intervened to maintain the biosphere’s ecosystem or if it should have been allowed to fail.
Objectives [] Planning [] Assessment [] Resources
Guides for each Chapter: 1 – 2 – 3– 4 – 5 – 6 – 7
Guide for Chapter 2:
Energy Through the System
The primary focus of this chapter is the movement of energy through the system with the food web and its components, food chains. The two main examples are woodlands with the familiar squirrels and birds and a complex pond ecosystem with a large number of food chains. These are familiar environments to most students and many are within close proximity to either of these environments.
A simple exercise would be to have students map out the food chains in the pond environment using twine. Each student represents an organism and is connected to another by a piece of string. As each organism is eliminated, students can see that one organism is often important to several other organisms as an energy source.
The concept of community is introduced for the first time here. Many students can be confused by the difference between community and ecosystem. This is a good place to introduce the idea of biotic and abiotic factors in order to help the students differentiate between the two terms. Communities can be defined as the interaction of groups of organisms living together in the same area, whereas ecosystem is a unit that combines biotic communities and the abiotic environment in which they interact. Ecosystems vary greatly in size and characteristics.
The chart in 2-I. Forest Food Web illustrates the roles of organisms in an ecosystem but it is also important to stress the idea that these are also ways that organisms get the energy they need to survive. This leads into the next section on the transfer of energy and nutrients through the environment.
Energy transfer is often a difficult concept for students to understand since it can’t be seen. If you used the above exercise with twine and had them form food chains it can be easily extended to show how energy will move in an environment. Start with a gallon of water that represents solar energy. The basic rule of thumb is that about ten percent of available energy is consumed by any organism. Have the “plants” pass ten percent of the water to the next organism in the chain and on up the line to humans at the top of the heap. There will be little left when the top is reached when based on humans having a carnivorous diet. If you repeat this with humans eating greater amounts of plant matter, the difference is dramatic.
TG-EC2-1. Investigation: Energy Expenditures – A Transparent Problem
Adapted from Hands On! Fall 1994 TERC. By Amy Shulman Weinberg
Part I:
Purpose:
Students will learn about an animal’s energy expenditures by keeping a log of their own activities during a 24 hour period. Using this information, they will calculate how much energy they themselves spend doing the activities they log.
Materials:
- Charts which show how many kcal /hour are expended doing different activities
- kilogram scale
- calculators
Procedure:
Students will generate their own ideas about how to calculate their personal energy expenditures. The teacher records data on the board for students (fictitious ones) who weigh different amounts and spend different lengths of time doing the same activity. Students discuss who used the most energy and why they think so. They identify weight and time as variables that effect energy expended. They then figure out their personal energy expenditure by multiplying their weight by the time spent and the number of kilocalories required per hour. [Some students are sensitive about their weight and will not be willing to share this information with the class].
Part II:
Purpose:
In the second part of this lab, students calculate the flow of energy through a simple food chain to address the question of how much solar energy an adolescent wolf requires to support its growth for one year.
Procedure:
Students first make a flow chart of energy flow from the sun to the wolf, using arrows and labeling it. They may draw pictures or use words (example below)
sun———> plants ————> deer————> wolf
Students will then figure out how much energy each kind of organism takes in: first the wolf, then the deer that the wolf consumes, and finally the vegetation that the deer consume. In the process they gain insight into how little of the original energy from the sun becomes new wolf tissue.
Students should already know that of all the energy that an organism takes in (I) only a small percentage produces new tissue or biomass.(P) Much of the organism’s energy is lost as heat during its fuel burning process (respiration) Other energy might be unused and excreted as waste.
A wolf puts only about 2 % of its total yearly intake in kilocalories into producing new growth. Therefore, 2% of Iwolf = Pwolf
Deer put only about 1 % of their total yearly intake in kilocalories into producing new growth. Therefore, 1% of Ideer = Pdeer
Plants put only about 0.5% of the sun’s energy into new growth. Therefore, 0.5% of Iplant = Pplant
Here is the problem:
A typical adolescent wolf produces approximately 8 kilograms of new tissue a year, which has a caloric value of 10 000 Kilocalories. Thus 2% of Iwolf = 10 000 kilocalories.
Every student can decide how to solve for Iwolf . The student can reason that because 2 per cent of a wolf’s yearly intake is 10 000 kcal, then 100 per cent is 50 times that or 500 000 kcal.
Others could make ratios or solve algebraically. .02Iwolf = 10 000 kcal, Iwolf = 10 000 kcal / .02 = 500 000
Next, students figure out the yearly total intake of the deer, assuming for simplicity that the wolf’s yearly intake comes only from deer. Therefore, Iwolf , which is equivalent to 500 000 kilocalories, equals the new amount of deer tissue produced (Pdeer ) as well (Iwolf = Pdeer = 500 000 kcal)
Now, if 1% of Ideer = 500 000 kcal, then 100% of Ideer must be 50,000,000 kcal.
In the final part, students calculate how many kilocalories plants take in (Iplant ) from the sun. At this point, they must understand that Ideer which is equal to 50,000,000 kcal, is also equal to the amount of new plant tissue produced, Pplant.
Therefore, (Ideer = Pplant = 50,000,000 kcal.)
Iplant = 10,000,000,000 kcal
Therefore, by the time the energy taken in by plants (10,000,000,000 kcal) or 1 x 10 10 kcal becomes a part of a wolf (1 x 10⁴ kcal) it has been reduced by a factor of a million kilocalories.
Once students have completed their calculations, they design their own visual representations to show the relative amounts of energy lost as energy moves through the food chain. Teachers may have to point out to students that the number of kilocalories produced by each trophic level on the food chain is equal to the amount of energy consumed at the next trophic level.
Therefore, the amount of energy produced by the deer is equal to the number of kilocalories that wolves consume. The inefficiency of energy use by each organism leads to massive inefficiency of energy transfer among organisms which increases as the trophic levels go higher.
Assessment:
Teachers may wish to check understanding by having students draw a biomass period to show the reduction in biomass at each trophic level, justifying its shape by backing it up with the mathematical calculations they have made. Problems using other organisms could be posed, to check and see if they understand that these rules hold for all organisms at varying trophic levels. These could be extended to biomass pyramids as well.
There are a number of questions that can be considered as extensions of this activity:
- Are some organism’s roles more efficient?
- Is energy lost as it moves up the food chain?
- What diet is “best?”
The different or niches that organisms occupy can be reinforced in light of energy. Is one role better than the other? Why aren’t there a lot of large organisms? Why are there less carnivores than herbivores?
2-VII. Positive Feedback Responses. A dramatic example of human effects on ecosystems is the idea that certain chemicals build-up in the environment such as pesticides. There are a number of dramatic affects of this in the past few decades such as the loss of peregrine Falcons due to the fragility of eggs because of DDT buildup and the increase of pesticides in the fatty tissues of fish. There are many other examples, but happily this trend has been reversing itself in many cases of the last decade.
2-VIII. A Global Challenge. The final part of this chapter focuses on the balance between several organisms and asks the question that if things change, how can they stay the same? The chapter uses microorganisms as examples. A good classroom extension would be to grow or obtain cultures of known predator/prey microorganisms such as paramecium and amoeba or rotifers. Using deep well slides or demoslides students can observe first hand the interaction between these organisms. This can be extended to the idea of feedback mechanisms and what type of feedback would occur as the food supply, or the numbers of predators or prey increases or diminishes.
LOOKING BACK
By this time, if your students made the model ecosystems in chapter one, they should be established enough to ask some questions that would pertain to the idea of balance between positive and negative feedback, the cycling of materials through the system and a comparison of the Biosphere II model.
- What would be the effect if a pollutant is introduced into your system?
- What would occur if acid rain were introduced?
- How are gases recycled through your system?
- What are the major constituents of your system?
- What is the average temperature range?
- Identify predator-prey, parasite-host, commensualistic-mutalistic relationships
Objectives [] Planning [] Assessment [] Resources
Guides for each Chapter: 1 – 2 – 3– 4 – 5 – 6 – 7
Guide for Chapter 3:
Studying Desert Ecosystems
In this chapter, students meet Dr. Samira Omar, a native of Kuwait who pioneered the study of rangeland ecology in her region. She was the recipient of numerous awards in her field. However, the chapter focuses on her new area of study, the devastation of Kuwait by the war with Iraqi in 1990. In particular, she turned her attention to the oil that was burned or released by retreating Iraqi troops. Her long-term study was to determine the effects of oil on the soil and the native plants.
This chapter gives students a sense of what scientists do and how they determine what they will study. Dr. Samira was obviously motivated by the destruction of a habitat that she grew to love as a child.
The activity is a way for students to get a sense of how difficult it is to clean up pollutants. While it isn’t directly related to the problem of something as toxic as petroleum, it does give students a way to see that it can be cleaned.
Objectives [] Planning [] Assessment [] Resources
Guides for each Chapter: 1 – 2 – 3– 4 – 5 – 6 – 7
Guide for Chapter 4:
Changes in the Global System
In this section, the focus is on the Ice Ages. Unlike global warming, ice ages come and go as a natural mechanism of the Earth. Many students don’t realize the complexity of Ice Ages. While earlier chapters focused on ecosystems and the interactions of the organisms within them, glacial growth is an example of a natural mechanism that has profound implications on ecosystems. An excellent exercise would be to use the map at the end of section VIII (How Might Temperature Changes Affect Organisms) together with the map of biomes in Chapter 1 section II (Everything’s Connected to Everything Else) and have students determine where the biomes would be located at the height of the Ice Age 18,000 years ago. This is similar to the map on 4-VIII, which is just a comparison of change in North America.
The activity in this teacher’s guide, while challenging, gives students a sense of climate change and how ecosystems are affected by this change over time.
TG-EC4-1. Investigation:
Who Dirtied Chesapeake Bay?
by Paul Conway
Objectives:
1. Students will be able to list themselves as being the cause of pollution of the Chesapeake Bay Estuary.
2. Students will see themselves as the solution to the problem
Materials:
- 11 empty 35 mm film canisters
- Dirt
- Oil
- Other materials such as soap, grease, etc.
Procedure:
Fill a glass container with water, explaining to the class that the water in the tank represents the Chesapeake Bay (or another nearby body of water) hundreds of years ago before the ancestors of all those except Native Americans came to this continent. The water is pure and clear. Ask the following questions:
—Would you go boating in this water?
—Would you go fishing in this water?
—Would you eat the fish if you caught them?
—Would you want to live near this water?
—Would you want to swim in this water?
—Would you worry if you got some of this water in your mouth while swimming?
The students should respond favorably to each question. In addition, ask the students if they would drink this water. Hopefully someone will realize (if this is the Chesapeake Bay) that the water is salty. It is from an estuary, which is a place where salt water from the ocean mixes with fresh water from a stream or river. Discuss with the class that this water was never drinkable and cannot be drinkable without a great deal of expensive processing. This doesn’t mean that it is not clean, however. The Bay is one of the most productive seafood producing regions in the world, but its productivity is decreasing. Let’s find out why.
Give 11 students or groups of students each a film canister filled with a mystery material and labeled as follows:
Nature, storm sewers, boaters, partiers, industry, home owners 1,2,3,4, and 5, and beach goers.
Here’s the scenario:
It is raining outside and when it rains, dirt leaves and other natural debris run into streams and eventually into the Bay. Ask the student representing nature to add the canister contents to the Bay. Then lead a discussion about these things being safe and natural. Repeat the questions asked at the beginning.
Repeat the procedure with each container. Ask appropriate questions and discuss each pollution source as you see fit. Suggested contents include dye to represent industrial waste, food scraps, plastic, etc to represent beach goers, cooking oil to represent petroleum, can tabs and debris from parties to represent partiers on the boats, soap or shampoo and hair to represent drainage from showers, food from garbage disposals, laundry detergents, and toilet paper and some dog food or fish food pellets to represent waste from the toilet.
After the contents of each can have been added, ask the students this final question: Who dirtied the Chesapeake Bay? Then ask who should clean it up. Brainstorm ways to clean up the mess. Try any methods possible within the confines of your classroom, for example, skimming off debris, let solids settle or filter. Discuss how this is done in real life.
Extension:
Should you wish to add more sophisticated methods to clean pollutants, create a “sludge” of chemicals and debris such as inks, pebbles, salts, alcohol, etc. This can then be separated with more sophisticated techniques such as distillation, filtration, etc.
TG-EC4-2. Investigation:
Pollen and Global Climate Change
To understand if the global climate is changing naturally or artificially, scientists need to study historical patterns. Human activity has only been a factor in the last several centuries and record keeping doesn’t go much further back. Scientists need data that goes back thousands of years. One method they use is the analysis of pollen grains.
Pollen falls from trees and plants and collects in sediment where it is buried over time. The ideal location to find pollen is in aquatic environments such as ponds and swamps since the lack of oxygen in the water preserves the pollen intact. In this lab you will use pollen analysis to look at climate changes in your area since the last ice age. Pollen grains are excellent indicators of environments because each pollen genus is unique in structure and maintains its shape just like a fossil. In addition, pollen grains of vegetation that existed long ago can be matched to modern vegetation. Because we know what type of climate modern vegetation requires, we can match it to the pollen of the past.
You will be asked to collect a core of sediment from a nearby lake, bog, marsh or other undisturbed area. The less disturbed the soil is by human activity the more accurate picture it will present of the past.
Materials:
- Pollen identification charts
- Microscope
- Filter paper
- Funnel
- Ruler
- Slides
- Coverslips
- 150 ml beaker
- droppers
- Soil corer or equivalent instrument
Procedure:
- Using a soil corer, collect a sample of sediment from the area assigned by your teacher.
- Using a dowel, rod or some other instrument, push out your soil sample from the corer. Be sure to keep the sample intact; mixing the sediment will disturb the record of events presented by the different layers.
- Lay a ruler alongside your sediment sample with the zero level marking the surface layer of the sediment.
- Take a pea-sized sample of the sediment, carefully recording how far down the surface it measures i.e. 2.3 centimeters below the surface.
- Place the sample in a 150 mL beaker. Add just enough 1 molar NaOH to cover the sample. Swirl/stir the mixture until the sediment is broken up and you have a muddy solution. 6. Decant your mixture through a funnel lined with filter paper.
- Place several drops of your filtrate on a slide to examine under a microscope.
- Record the various number and type of pollen grains. Use a pollen identification chart to assist you in identifying them.
- Compare your results with others in the class.
Teacher Notes:
This is an ideal investigation for schools located in the northern part of the US where glacial activity took place during the Pleistocene. Teachers in non-glaciated areas can still collect pollen from ponds, etc. and show students that despite not having glaciers in their area, they still had an effect on the climate and ecosystems of the region. It might shock students in the mid-Atlantic states to learn that their region was Arctic Tundra during the height of the Ice Age.
If coring isn’t a possibility, then an artificial core can be created using larger graduated cylinders (100 ml or larger) to act as cores. Pollen can be collected from any flower or tree in season and inserted into the column. Students can then follow the procedure to extract the pollen and analyze. If the pollen is taken from random plants then the teacher would need to create their own ID chart.
Natural climate change occurs not just on the Earth, but also on other planets. The two planets discussed are Mars and Venus. Many student might ask why those particular worlds. A quick study of the solar system would show that Mercury is no more than a melted world and that the other planets are gas giants, completely inhospitable to human habitation. Both Mars and Venus have been written about extensively in fiction and non-fiction as worlds were life could easily have arisen. There are a number of good books that could be used as sources of information and for stories.
If you didn’t raise the idea of the Goldilocks Theory as to why life is only found on Earth, from other GSS units, this would be a good time to do so. There are a number of good questions that could be asked of students.
- What factors make Earth a good candidate for life?
- Might the other planets have had life?
- Are there other Earths, or is life rare?
Many of these questions can lead students to understand why it is so important for us to maintain the Earth’s balance with respect to climate and biodiversity: There may not be anywhere else for us to go if we “foul the nest.”
4-III. Is the System Heating Up?
This is one of the essential questions of the GSS curriculum, “are we heating up our planet?” The difficulty with answering this question is that while there is a lot of evidence that can point towards rising temperatures, there is also evidence that glacial cycles are very long and that we are quite possibly still in an ice age and that we are just in an interim period between advances of ice.
Another approach is to have students look at various cycles on the Earth that vary over time. Examples would be population cycles of animals, cycles of natural weather patterns such as El Nino, precipitation cycles, etc. There are a number of other examples that could show the difficulty of having a definitive answer.
A debate to present the evidence would work as well with one side presenting the argument for heating up the atmosphere and the other side showing evidence that it might be cooling.
4-IV. Energy and Matter In and Out of Ecosystems
Energy flow is an essential part of an ecosystem. Too much energy can affect an ecosystem as easily as too little. Students often think of ecosystems as isolated areas that are unaffected by what goes on outside of its boundaries. The diagram at the end of this section illustrates the concepts on input and output. While students understand what they see, energy is a difficult concept to understand. It is important to realize that there is a finite amount of energy coming into an environment with all of that energy being supplied by the sun.
TG-EC4-3. Investigation: Energy Inventory
Over a 24 hour period have students chart the total amount of calories they consume, including snack foods, meals or even a “nibble” on someone else’s snack. Students should be as accurate as possible. With the packaging found on most food items, there is plenty of information that can be gathered as useful data. Students can convert the amount of calories they consumed into energy by the simple conversion
1 Calorie = 1000 calories
1 calorie = 4.18 Joules = 1 Watt
Students can then figure out how many Watts of energy they emit by assuming that the average person needs 2000 calories a day to maintain their energy level. Adolescents are as high as 2500. Using the diagram, students can put themselves into the cycle and inventory their input and their output.
- What happens if you consume more that the necessary amount of calories?
- Where does all of the energy you emit go?
- If 1 calorie of energy raises 1 g of water 1∞C. How much would your body temperature rise if all of the calories you consumed were converted to energy? Is it?
- Animals have two primary gases that are emitted as waste products, Carbon Dioxide and Methane. Do humans contribute to this? How?
This activity can be tied to the three short sections (4-I, 4-II, 4-III) in this chapter very nicely. It also is an extension of the teacher guide investigation Energy Expenditures – A Transparent Problem in chapter 2 of this guide. Carbon Dioxide absorbs heat, Methane even more so. Combined too much increases the Earth’s temperature. A personal inventory can show students how humans are part of this problem due to our increasing population, our dependent animal population such as cows, the deforestation of vast tracts of trees which absorb Carbon Dioxide and our industrial output.
4-VIII. How Might Temperature Changes Affect OrganismsThe activity follows directly from the 4-VII questions. If the ocean levels were to rise, what would happen to the configuration of land? A topographic of the area around where students live would be very relevant if it’s near the coast. An extension would be to use the map in this section to not only see the ecosystem change but to consider how the coastline of North America would change with a rise in sea level.
4-IX and 4-X; Positive and Negative Feedback Systems on a Global ScaleUp to this point the concept of positive and negative feedback has been applied to smaller examples such as a population cycle or a food chain. In this case, they are being applied to a larger model. If this is applied to the Ice Ages, students could debate whether it is an example of a positive or negative feedback model, or both.
Objectives [] Planning [] Assessment [] Resources
Guides for each Chapter: 1 – 2 – 3– 4 – 5 – 6 – 7
Guide for Chapter 5:
Carbon in the Biosphere
There are three biologically significant gases in the atmosphere, Nitrogen, Oxygen and Carbon Dioxide. While students are aware of Oxygen and Nitrogen, Carbon Dioxide is the one most relevant to global warming and other important environmental issues. These sections focus on the Carbon Cycle and its importance in plants as a crucial ingredient in photosynthesis or the formation of sugars.
As well as showing students how Carbon is cycled through the system, a look at the oxygen and nitrogen cycles would also be relevant. A close look would reveal to students that in the Oxygen Cycle, Ozone is continually produced in the upper atmosphere. This could lead to a discussion of ozone depletion and how to remedy the problem. As well, with the nitrogen cycle , an important revelation is that nitrogen is not readily consumed by organisms but that it gets into the biochemical cycles through plants and nitrogen fixing bacteria. It is important to show students the interrelatedness of each of these cycles to each other. Groups of students might work together on a specific cycle and show how they interconnect with each other.
In this section it is important to distinguish between Carbon Dioxide the atmospheric gas and Carbon, the biologically important element as a building block of life and essential molecules for organisms such as sugars, starches and proteins. Many students only consider Carbon as Carbon Dioxide and don’t realize that there is a very large amount of Carbon stored in the Earth. This is a good time to review the Carbon Cycle and point out Carbon Reservoirs. It is a good idea to point out to students that they are carbon reservoirs as well.
5-II to 5-IV The primary focus of these sections is on the role of trees as regulators of Carbon Dioxide levels. As the numbers of trees fall, the levels of CO2 rise.
It points out the significance of the tropical rain forests as regions that help to maintain the amount of Carbon Dioxide in the atmosphere. An important tie-in is that not only are those areas important, but the area where student live as well.
In the next investigation, students become aware of the effects of increasing carbon dioxide in the atmosphere on plants and in turn agriculture and other resources in our Global System.
The carbon cycle is based on carbon dioxide gas, which makes up only 0.03% by volume of the troposphere and is also dissolved in water. Although the amount of carbon dioxide is very small, carbon dioxide is one of the raw materials needed by plants to carry out the process of photosynthesis (food making). Carbon dioxide is removed from the atmosphere by the process of photosynthesis and returned to the atmosphere by the respiration of plants and animals. Decayed organisms (flora and fauna) also return carbon dioxide back into the carbon cycle. The carbon cycle is part of the Global System.
Carbon dioxide fertilizes plants, stimulates growth and improves efficiency and water use by plants under controlled conditions. The carbon dioxide in the atmosphere can have both positive and negative feedback. While crop production would increase, so would weed production in uncontrolled conditions. Therefore, we as a population on this vast earth need to consider the effects of carbon dioxide on plants globally.
Materials can be obtained from local pet shops or science supply houses. Aquatic plants (Elodea, algae, and Seratophylum) should be used because it is easier to regulate and test in an aquatic environment. Gather enough material for groups of two to four students. Two 45 minute class periods for setting-up and gas collection are needed. Remind students that carbon dioxide gas and water produces or yields carbonic acid (pH may be tested as an additional part of the activity).
TG-EC5-1. Investigation: The Effects of Carbon Dioxide on Elodea Plants
By Joan Bennett, 1994
Numerous studies have shown that carbon dioxide affects organisms and it has been shown that flora and fauna are affected by global warming due to increased amounts of carbon dioxide. In some cases organisms have evolved to protect themselves. However, some of the changes have occurred so rapidly, that some organisms have not been able to successfully evolve.
The link between increased atmospheric CO2 and increased growth is the process called photosynthesis. Through photosynthesis plants assimilate CO2 from the atmosphere and covert it into nutrients, which are stored in the plant. This activity will help students to determine whether additional CO2 in the atmosphere might increase the rate of oxygen bubbles given off by Elodea.
OBJECTIVE:
To observe the effects of CO2 on Elodea.
SAFETY:
Goggles and apron
MATERIALS: (for each student team)
- Lab aprons
- Goggles
- One set of 500 ml Erlenmeyer flasks
- One set of large test tubes
- 300-ml. club Soda
- Two sprigs of Elodea (7-10 cm long, but both the same size)
PROCEDURE:
Put club soda and a sprig of Elodea into one of the two large test tubes. FILL TO OVERFLOWING. Put plain water and a sprig of the same size Elodea into the second large test tube FILL TO OVERFLOWING. Put 250 ml of club soda into one flask and invert the test tube of elodea and club soda WITHOUT LETTING ANY AIR INTO THE TUBE and stand it inverted inside the flask. (This is tricky, but can be done) Do the same with the other set of apparatus, using plain water.
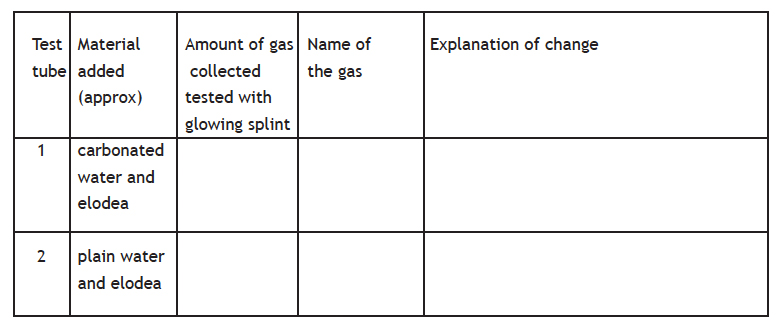
RESULTS:
Using the accompanying table as a guide, prepare a table listing the contents of your test tubes used in this experiment. Complete the first three columns on day one (set-up day). Complete the last two columns on day two.
CONCLUSIONS:
- What do carbonated water and your breath have in common that might be responsible for similar results?
- What action would be required to restore the original color of the BTB?
- How is increasing atmospheric carbon dioxide likely to affect plants on a global scale? 4. How do you compare your results with what is happening globally?
No matter where students live, their primary weather forecasts come from TV stations in major cities. The Urban Heat Island phenomenon can easily be shown by having students track daily high and low temperatures for the nearest large city and the rural areas surrounding it. If students live in cities, the opposite would occur. Students should quickly see that there are significant temperature differences due to the amount of tree cover and the affect of large amounts of paved areas.
The story of Atlanta is ongoing even as this module is being written. It has been speculated that given the growth in the region around Atlanta, there will be a severe shortage of water in the next decade. It would be a good idea for students to evaluate their region. If you are situated in an urban environment, there may be many of Atlanta’s problems faced by your city. If you are outside of a metropolitan region, large cities in your area may be encroaching towards you and using valuable land space for development of expanding populations. This would be an excellent long term project to evaluate the quality of the environment in your area and the long term consequences.
The Tree Musketeers story gives students a sense that something can be accomplished to counter the trend of deforestation. A city with significant green space in the form of parks or greenbelts along rivers has a much lower temperature difference than a city that has few trees. The exercise on page 49 is an excellent to get students involved in improving their town’s air quality and tree cover.
5-VII. Carbon Sinks and VIII. Carbon Beneath the ForestsIf you discussed Carbon reservoirs earlier then these next two sections expand on the idea of reservoirs and discuss how Carbon gets into and out of these sinks. An excellent tie-in is to point out to students that our current energy needs in the country are met by mining these carbon sinks that are in the form of coal and petroleum. A good discussion to have with students is that if we burn these products and they release Carbon Dioxide, How do they get back in the ground?
The focus of this unit is to show that the gases in the atmosphere are inextricably tied to the organisms that use and produce them and that by both natural and artificial means these gases are alternately released or stored by the Earth. It is important to point out whenever possible examples of the Earth as a system.
The lab on decomposition can be altered to suit your class’s needs. If you are tying this into a chemistry unit or are focusing at all on biochemistry, an excellent extension to this is simply to take preserved foods such as dried fruit or such snacks as Twinkies„ and expose them over a period of time. In experiments with Twinkies, they can be unchanged over weeks even if broken in half. However, if any amount of water is added, fungus and mold grow rapidly.
Objectives [] Planning [] Assessment [] Resources
Guides for each Chapter: 1 – 2 – 3– 4 – 5 – 6 – 7
Guide for Chapter 6: Carrying Capacity
In this chapter the main idea is that in any ecosystem there is an upper limit as to how large the population can be of any organism and the consequences of the limit being exceeded. It is important to distinguish between limiting factors and the carrying capacity. A good exercise might be for students to study an ecosystem and find population estimates for various organisms as well as the limiting factors in that environment. Students should quickly see that the larger the organism, the less the number that occur in that ecosystem. In any ecosystem the largest number of organisms will be insects.
Feedback loops can also be brought in here. In general, the warmer the environment, the more plant life, the more diversity of animals and the larger populations of each. Conversely, Tundra environments would have less large animal diversity and numbers. A good question to ask students would be to have them decide which type of environment could withstand greater human impact, warmer or colder regions?
There are a number of stories of species that have been reintroduced to their former habitats. This would be a good research project for students to find other examples of this reintroduction and determine how successful each project was with the species.
6-I. Habitat Fragmentation and Carrying Capacity
An important concept to reinforce here is that all ecosystems are interdependent on each other and that the boundaries between each are arbitrary. Many organisms need to migrate across ecosystems to find food or to increase their range. Consequently, as their habitat shrinks, the effect on populations of organisms increases.
Habitat fragmentation is a difficult concept to grasp. The story of the rainforest tract preservation is particularly telling. For many environments the pressures are many, farmland, housing, businesses and roads crisscross land.
A good project would be to have the local conservation commission or a representative of an environmental group such as Audubon come and speak to students about land use and land pressures, and the effect on organisms. Students can also usually obtain information on the amount of conservation land that their town may have acquired. Is there any attempt by the town to link parcels with corridors for animal migration? What percentage of the town’s land is preserved? Is there a master plan for conservation in the town? What about on a regional level? Some students probably live near National Parks. This would also be a good long-term project for study.
6-III. Invasive Species
Invasive species are a real problem in the country. This issue in some way affects all regions of the country. Have students do an inventory of possible invasive species in their area. As well, students may have had chance meetings with animals found in the wild, inhabiting their backyards.
A good way to monitor animal migration patterns in your area is to participate in the RoadKill Project run by ENVIRONET, an umbrella group that monitors online student research projects. In this project, students send observations of animals they observe dead found by the side of the road. The class keeps track in their area and reports their findings to the national database. Students can then check their data against others both in their region and around the country. The web address can be found in the reference section.
6-VI. Food Resources and Carrying Capacity and VII. Over Use of Natural Resources
Use and overuse of resources is an important topic. For better or worse, humans are an integral part of the world’s biome. Many students live in urban areas that do not grow their own food and are dependent on imports from the surrounding area or from other parts of the world. A way to reinforce this concept is to have students accompany their parents to the supermarket and inventory the fruits and vegetables available. See if they can find out where they actually came from. How much was local? Even in the summer the amount of local produce is surprisingly small for most parts of the country.
It is surprising how little students realize the impact certain resources have on the environment. The following “recipe” can fuel some excellent discussions. While it isn’t meant to take a position on vegetarianism vs. meat eating, it does show how resources are diverted to a source of food which can be considered inefficient.
TG-EC6-1. Investigation:
How To Make A Cow
Ingredients:
- 1 -80 lb Calf
- 8 acres of grazing land
- 12,000 lbs of forage
- 125 Gallons of Gasoline
- 305 lbs of fertilizer
- Fertilizer Recipe—Combine:
- 170 lbs. Nitrogen
- 45 lbs. Phosphorus
- 90 lbs. Potassium
- 1.5 Acres of farmland
- 2,500 lbs of corn
- 350 lbs Soybeans
- insecticides, herbicides
- pesticides, hormones
- 1.2 million gallons of water to be added regularly
Take one calf, allow to nurse and eat grass for six months, then wean. Over next 10 months, feed 12,000 pounds of forage. Use about 25 gallons of petroleum to make fertilizer to add to the 1.5 acres of land. Set aside rest of gasoline to power machinery, produce electricity and pump water. Plant corn and soybeans-apply insecticides and herbicides. At 24 months, feed cow small hormones to speed up fattening. During next 4 months, feed remaining crop mixed with roughage. Recipe yields 440 usable pounds of meat-1000 7 ounce servings.
Option: Bake the 2500 pounds of grain and 350 pounds of soybeans into bread and casseroles-18,000 8 ounce servings.
History is replete with stories of civilizations that risen and fallen, and are no longer with us. The research project at the end of the chapter is an excellent way to understand the many ways in which civilizations can crumble. As students will find, it is often the overuse of resources that is a major factor in their demise.
Objectives [] Planning [] Assessment [] Resources
Guides for each Chapter: 1 – 2 – 3– 4 – 5 – 6 – 7
Guide for Chapter 7:
Neighborhood and Global Stewardship
This section gives students a sense that they can do something to help preserve the richness of the Earth’s biomes. This same hopeful sense has been shown throughout the module. While many warnings are sounded, the Tree Musketeers, Wastebusters and other groups around the country all do their part to preserve the environment and make their cities and towns better places to live.
Many students, in studying this module, often feel that we’re doomed as a species. It is important to stress that only if humans do nothing will that be the case and there are very simple things that can be done to help. Ideas include:
- Start a recycling program at your school
- Map green spaces that might be preserved on your school grounds
- Walk rather than drive short distances
- Plant trees
Have your class brainstorm more ideas. An excellent book that came out a few years ago was “50 simple things you can do to help the Earth”. It is surprising to many students how very small changes can have profound effects.
7-II. Another Look at Gaia
This is a great time to summarize and return to the Gaia Hypothesis. It is important to stress that the theory doesn’t mean to say that the Earth is alive but merely a self-sustaining system that regulates the environment by feedback mechanisms. The developer of the Gaia theory, James Lovelock has written several books on the idea of Gaia and it might be good for students to read his own words to try and understand the complexity of the Earth and its systems.
Also, by this time, students should have a firm grasp on the interrelatedness of organisms, ecosystems, climate and non-organic factors such as atmospheric gases. Through natural mechanisms such as Ice Ages the Earth is able to maintain a stable environment characterized by varied ecosystems that sustain a wide biodiversity of life.
7-V. The Global Commons
The final section of the module discusses the idea of the Global Commons or the interdependence of humans on one another. It stresses the idea that humans can work together to better the planet and that the actions of one group affect all humans.
There are two resources that might be an excellent way to sum up the unit and the consequences that are entailed from not sharing our resources. The first is a simple analogy called, “If the Earth Were a Village.” This story reduces the size of the Earth to one thousand inhabitants and statistically shows how everything is distributed from money to land use to education. While it is only tangentially related to ecosystem change, it does develop the idea of distribution of resources or, in a sense energy.
Another resource is the story of the Commons. Many towns in New England have a town commons but few students know that it was supposed to be common grazing land used by all of the town’s inhabitants. Over time it became over grazed as more people put more livestock on the land and tried to get the most use for themselves. The legacy of this is the town land now often used as a park for all to enjoy.
This story has repeated itself in many modern versions in particular, overgrazing of prairie land and western sagebrush areas, and over fishing which resulted in the closure of many fisheries in an attempt to save the stock of fish for food.
All of these are excellent ways in which to lead into the unit Losing Biodiversity, a natural follow-up unit after Ecosystem Change.
Objectives [] Planning [] Assessment [] Resources
Guides for each Chapter: 1 – 2 – 3– 4 – 5 – 6 – 7
Resources
Resources for Ecosystem Change
For latest material relevant to Ecosystem Change,
see the Staying Up To Date section of the GSS website.
The list below is from the original development of GSS and is out of date and in no way exhaustive for the resources that are available for teaching ecosystem change and related topics. However, if the teacher is new to the discipline and is looking for basic reference materials, these are a number of good places to begin.
Ecosystem Change Bibliography
The following books and articles provided the information and perspectives on which this book is based.
Adams, L.W. and Dove, L. E.Wildlife Reserves and Corridors in the Urban Environment. National Institute for Urban Wildlife, Columbia, MD, 1989.
Adams, L.W. and Leedy, D. L. editors, Wildlife Conservation in Metropolitan Environments. National Institute for Urban Wildlife, Columbia, MD, 1991.
Adey, Walter H. “Ecosystem Encounters: Lessons in Synthetic Ecology” The Science Teacher Sept. 1992, pgs. 22-28. Adler, J. and Hager, M. How Much is a Species Worth? National Wildlife 1992:30(3): 4-15.
American Association for the Advancement of Science, Project 2061, Benchmarks for Science Literacy. Oxford University Press, New York, 1993.
American Institute of Biological Sciences, High School Biology. Biological Sciences Curriculum Study, Green Version, Rand McNally & Co., Chicago, 1963.
Ausubel, J. H. Can Technology Spare the Earth? American Scientist, March/April 1996. 84:166-178.
D’Antonia, C. and Dudley, T. L. Alien Species: How Inadvertent Immigrants Affect Habitats. Pacific Discovery 1993:46(3): 8-11.
Baskin, Y. Ecosystem function of biodiversity. BioScience, 1994: 44(10): 657-660.
Berg, P., Magilavy, B. and Zuckerman,S. A Green City Program for the San Francisco Bay Area and Beyond. Planet Drum Books, San Francisco,1989.
Blaustein, A. et al. UV Repair and Resistance to solar UV-B in Amphibian Eggs. Proceedings National Academy of Science, 1994:91:1791-1795.
Bohlen, J.T. For the Wild Places: Profiles in Conservation. Island Press, Washington, DC 1993.
Botsford, Louis W., Castilla, Juan Carlos, and Charles H. Peterson “The Management of Fisheries and Marine Ecosystems” Science July 25, 1997, Vol. 277, pgs. 509- 515.
Brooke, Elizabeth H. “Brazil’s Nature Savior” Nature Conservancy May/June 1993 Pgs. 8-15.
Brown, L., Hane, H., and Roodman, D. (ed. Starke, L.) Vital Signs. W. W. Norton and Co., New York, 1994.
Burdick, A. Invasion of the Naure Snatchers. The New York Times Magizine, Nov. 13, 1994.
Carson, Rachel, Silent Spring. Houghton Mifflin Company Boston, 1962.
Chadwick, D.H. What Good is a Prairie? Audobon, Magazine of the Audubon Society, 1995. 97(6):36-47.
Chapin III, F. Stuart, Walker, Brian H., Hobbs, Richard J., Hooper, David U., Lawton, John H., Sala, Osvaldo E. and David Tilman “Biotic Control over the Functioning of Ecosystems” Science July 25, 1997, Vol. 277, pgs. 500-503.
Chase, Alston, Playing God in Yellowstone: the destruction of America’s first national park, Harcourt, Brace and Jovanovich. 1987
Cohen, Joel E. How Many People Can the Earth Support? Norton, 1995
Costanza, R. Ecological Economics, the Science and Management of Sustainability. Columbia University Press, New York, 1991.
Cox, George W., Alien Species in North America and Hawaii: Impacts on Natural Ecosystems Island Press, 1999.
Cronon, William Changes in the Land: indians, colonists and the ecology of New England Hill and Wang, 1984
Crosby, Alfred W. The Columbian Exchange: Biological and cultural consequences of 1492 Greenwood Press, 1972
Crosby, Alfred W., Ecological Imperialism: The biological expansion of Europe 900-1900, Cambridge University Press, 1988
Crutzen, Paul J. and Meinrat O. Andreae “Biomass Burning in the Tropics: Impact o Atmospheric Chemistry and Biogeochemical Cycles” Science Dec. 21, 1990, Vol. 250, pgs.1669-1677.
D’Antonia, Carla and Tom L. Dudley, “Alien Species: How Inadvertent Immigrants Affect Habitats,” Pacific Discovery Summer 1993, Vol. 46, No. 3. pgs. 8-11.
Derr, Mark “Redeeming the Everglades” Audubon Sept.-Oct. 1993 pgs. 48-56.
Devine, Robert S. Alien Invasion: America’s Battle with NonNative Animals and Plants National Geographic Society, 1999.
Dobson, Andy P., Bradshaw, A.D., and A.J.M. Baker, “Hopes for the Future: Restoratio Ecology and Conservtion Biology Science July 25, 1997, Vol. 277, pgs. 515-521.
Dunlap, T. Saving America’s Wildlife. Princeton University Press, Princeton, NJ, 1988.
Durrell, L. Gaia State of the Ark Atlas, World Conservation in Action. Anchor Books, Doubleday, New York, 1986.
Ehrlich, Paul R. and Anne H. Ehrlich, Extinction: the Causes and Consequences of the Disappearance of Species. Ballantine, New York, 1983.
Elton, Charles S. The Ecology of Invasions by Animals and Plants Univ. of Chicago Press, 2000
Emerson, Ralph Waldo, Nature. in Nature, Addresses and Lectures, the Works of Ralph Waldo Emerson. Standard Library edition 14 vols. Boston, 1883.
Farb, P. Tragedy on the Plains. in Ecology. Time-Life Books, New York, 1963.
Fleischner, T. L. Ecological Costs of Livestock Grazing Western North America. Conservation Biology, 1994:8(3):629-644.
Friend, T. Power Tool. National Wildlife, National Wildlife Federation, 1995:33(6):16-23.
Garber, S. D. The Urban Naturalist. Wiley, New York, 1987. Gilbert, B. Earth Day Plus 20, and Counting. Smithsonian, 1990:21(1): 47-55.
Gore, Al, Vice President, Earth in the Balance, Ecology and the Hmman Spirit, Plume Books, New York, 1992.
Graham, Frank Jr., “Winged Victory,” Audubon, Magazine of the National Audubon Society, July-Aug. 1994, Vol: 96, No. 4 pgs. 36-40.
Gruson, Lindsey, “Plan to Save Iguanas, and the Rain Forests in the Bargain” The New York Times, The Environment Aug. 22, 1989.
Hamblin, W. Kenneth, Earth’s Dynamic Systems 6 th ed. Macmillan, 1985
Harrison, G.H. Is there a Killer in your House? National Wildlife, National Wildlife Federation, 1992:33(6):10- 21.
Harrison, P. Wildlife and People: Scrambling for Space. People and the Planet. United Nations Population Fund, World Conservation Union & Internation Planned Parenthood Federation, 1993: 2(3):6-9.
Harter, J. ed. Animals,1419 Copyright-Free Illustrations of Mammals, Birds, Fish, Insects, etc. Dover Publications Inc., New York, 1979.
Heck, J.G. Heck’s Pictorial Archive of Nature and Science. Dover Publications, N.Y.
Hicks, C. Minimum Standards Needed to Protect U.S. Rangelands. NewsReport, Vol.XLIV No. 2, National Research Council, Office of News and Public Information, Washington DC, 1994.
Howe, H.F. Managing Species Diversity in Tallgrass Prairie: Assumptions and Implications. Conservation Biology, Sept.1994:8(3): 691-704
Hyman, R. Rise of the Rubber Tappers. International Wildlife, National Wildlife Federation Sept.-Oct.1988:18(5): 24- 28.
Imbrie, John Ice Ages: Solving the Mystery Enslow Publishing, 1979
Katz, P. The New Urbanism: Toward an Architecture of Community. McGraw-Hill, New York, 1993.
Koebner, Linda et. al. (eds) Scientists on Biodiversity American Museum of Natural History, 1998
Kricher, John C. and Plotkin, Mark J. A Neotropical Companion Princeton Univ. Press, 1999.
Kump, Lee R., The Earth System Prentice-Hall, 1999.
Kutner, L. A. and Mares, R. Environmental Discrimination: An Annotated Bibliography. Council of Planning Librarians Bibliography Series (Issue #306), Justice Booksellers, Washington, DC.
Lawren, B. Net Loss. National Wildlife, National Wildlife Federation Oct.- Nov. 1992:33(6):46-53.
Lean, Carston, Olympic Battleground. 1994.
Leopold, Aldo, A Sand County Alamanac, And Sketches Here and There. Oxford University Press, New York, 1949. Lovelock,James Gaia: A New Look at Life on Earth Oxford, 1987
Lovelock, James The Ages of Gaia: A biography of our living Earth Bantam, 1988
Luoma, Jon R. “Gazing Into Our Greenhouse Future” Audubon March 1991, pgs. 52-59.
MacArthur, Robert H. and, Wilson, Edward O. The Theory of Island Biogeography Princeton Univ. Press, 2001.
McIntosh, P. Embracing Dilemmas the World Over. InternationalWildlife, Nov-Dec. 1990:20 (6): 12-16.
Makower, J. Good, Green Jobs, How Business is Putting the Environment to Work for California. California Department of Conservation, 1995.
Marsh, George Perkins, Edited by David Lowenthal, Man and Nature. originally published in 1864, Harvard University Press, Cambridge, 1965.
Marshall, R. Impressions from Wilderness. Nature Magazine, 1951:44:481.
McKisson, M. and MacRae-Campbell, L. Endangered Species: Their Struggle to Survive. Zephyr Press, Tucson, AZ 1990.
Matson, P.A. Parton, W.J., Power, A.G., and M.J. Swift, “Agricultural Intensification and Ecosystem Properties” Science July 25, 1997, Vol. 277, pgs. 504-509.
Maxwell, J. True Nature. Audubon, Magazine of the Audubon Society, July-Aug. 1994:96(4): 28-33.
Miller, B., Ceballos, G. and Reading, R. The Prairie Dog and Biotic Diversity. Conservation Biology, 1994:8(3): 677-681.
Miller, J. and Van Loon, B. Darwin for Beginners. Random House, New York,1985.
Mitchell, J.G., Our Polluted Runoff. National Geographic, 1996:189(2):106-125.
Nash, R. Wilderness and the American Mind. Yale University Press, New Haven, 1978
National Geographic, 1491 America Before Columbus. 1991:180(4): 4-99.
National Research Council, Ecological Knowledge and Environmental Problem-Solving. National Academy Press, Washington DC, 1986.
National Wildlife Federation, People Who Make a Difference. National Wildlife, 1993: 31(6): 44-51.
Naeem,S., K. Haakenson, L.J. Thompson, J.H. Lawton and M.J. Crawley. Biodiversity and plant productivity in a model assemblage of plant species. Oikos, 1996:76:259-264.
Noble, Ian R. and Rodolfo Dirzo, “Forests as Human-Dominated Ecosystems” Science July 25, 1997, Vol. 277, pgs. 522-525.
Parfit, M. Facing Up to Reality in the Amazon. Smithsonian, 1989:20(8): 58-77.
Parkman, Francis, The Oregon Trail: Sketches of Prairie and Rocky-Mountain Life. Boston, 1873.
Pick, M. How to Save Your Neighborhood, City or Town: The Sierra Club Guide to Community Organizing. Dell, New York, 1993.
Pimentel, David et al. Environmental and Economic Costs of soil Erosion and Conservation Benefits. Science Feb. 24, 1995:267:1117-1122.
Poten, C.J. A Shameful Harvest, America’s Illegal Wildlife Trade. National Geographic. 1991:180(3):106-132.
Pyle, R.M. The Thunder Tree: Lessons from an Urban Wildland. Houghton Mifflin, New York, 1993.
Quammen, David, The Song of the Dodo Simon and Schuster, 1996
Quammen, David Wild Thoughts from Wild Places Scribner, 1998
Register, R. Ecocity Berkeley: Building Cities for a Healthy Future. North Atlantic Books, 1987.
Ricketts, Taylor Terrestrial Eco-regions of North America, Island Press, 2002
Ricklefs, Robert E and, Gary L. Miller Ecology Roger, Lewin, Thread of Life, The Smithsonian Looks at Evolution. Smithsonian Books, Washington, DC, 1982. Sale, K. The Conquest of Paradise. Alfred A. Knoph, New York, 1990.
Salopek, P. Gorillas and Humans: an Uneasy Truce. National Geographic, 1995:188(4):72-83.
Shaller, G. Gentle Gorillas, Turbulent Times. National Geographic, 1995:188(4):65-69
Slack, G. Natural Law: Congress Reconsiders the Endangered Species Act. Pacific Discovery, 1992:45(2):22-31.
Slack, G. Emerald Cities. Pacific Discovery 1994: 47(2):27- 33.
Smith, Robert L., Ecology and Field Biology 5 th ed HarperCollins, 1996 Spurr, Stephen H. and Barnes, Burton, V. Forest Ecology, 3 rd ed. J. Wiley, 1980
Stegner, W. It All Began with Conservation. Smithsonian, 1990:21(1): 34-43.
Stein, S.The Evolution Book. Workman Publishing, New York, 1986.
Stein, S. Noah’s Garden: Restoring the Ecology of Our Own Backyards. Houghton Mifflin, New York, 1993.
Steinhart, P. The City: An Evolutionary Crucible. Pacific Discovery, 1994:47(2): 6-9.
Steinhart, P. California’s Wild Heritage, Threatened and Endangered Animals in the Golden State. California Department of Fish and Game, 1990.
Sunquist, F. Zeroing in on Keystone Species. International Wildlife, National Wildlife Federation. 1988:18(5):18- 23.
Swan, L.W., The Scientific Spiritualist. Pacific Discovery, 1993:46(2):24-25.
Thelander, C.G. Ed. Life on the Edge, a Guide to California’s Endangered Natural Resources: Wildlife. Biosystems Books, Santa Cruz, CA 1994.
Thomas, J.W., Forsman, E.D., Lint, J.B., Meslow, E.C., Noon, B.R. and Verner, J. A Conservation Strategy for the Northern Spotted Owl, U.S. Government Printing Office, Washington, DC, 1990.
Thoreau, Henry David, Walking. in Excursions, the Writings of Henry David Thoreau. Riverside edition, Boston, 1983. Tilman, D. and J.A. Downing. Biodiversity and stability in grasslands. Nature (London), 1994:367:363-365.
Todd, Kim and Emery, Claire, Tinkering with Eden: A Natural History of Exotics in America
Trefethen, J. An American Crusade for Wildlife. Winchester Press, 1975.
Trefil, J. A Scientist in the City. Doubleday, New York, 1994.
Van Driesche, Roy and Jason Nature Out of Place: Biological Invasions in the Global Age Island Press, 2000.
Vessel, M.F. and Wong, H.H. Natural History of Vacant Lots. University of California Press, Berkeley, 1987.
Vietmeyer, Noel, “Iguana Mama” International Wildlife, National Wildlife Federation, Sept.- Oct. 1989, Vol. 19, No. 5, pgs. 24-27.
Vitousek, Peter M., Mooney, Harold A., Lubchenco, Jane and Jerry M. Melillo “Human Domination of Earth’s Ecosystems” Science July 25, 1997, Vol. 277, pgs. 494- 499.
Waldman, C. Atlas of the North American Indian. Facts on File Publications, New York, 1985.
Watkins, T.H., What’s the Matter with the Endangered Species Act? Audubon, Magazine of the National Audubon Society, Jan.-Feb. 1996.
Western Regional Environmental Education Council, Project Wild, Revised 1986.
Wexler, M. Americans Speak Out. National Wildlife, National Wildlife Federation,1995:33(3): 34-37.
Whitmore, Timothy An Introduction to Tropical Rain Forests Oxford Univ. Press, 1998.
Wilson, E.O. The Current State of Biological Diversity. in Biodiversity, National Academy Press, Washington, Wilson, E.O. and Peter, F. M., editors Biodiversity. National Academy Press, Washington, DC, 1988.
Wilson, E.O. “E. O. Wilson to the Defense.” NationalWildlife, National Wildlife Federation, 1996:34(1):10-17.
World Resources 1994-95, Short Duration Grazing: Reclaiming or Ruining the Range. World Resource Institute. 1709 New York Ave. NW, Washington, DC, 20006.
World Resources Institute, The 1992 Environmental Almanac. Houghton Mifflin Company, Boston, 1992.
Wright, H.E. ed The Quaternary of the United States Princeton, 1965
Youth, H. Flying into Trouble. World Watch, 1994a: 7:10- 19.
Youth, H. Birds are in Decline. In L. Brown, H. Hane, and D. Roodman, (ed. L. Starke) Vital Signs. W.W. Norton and Co., New York, 1994b.
Software
Earthquest Explores Ecology, from Earthquest Inc., 125 University Ave., Palo Alto, CA 94301, (415) 321-5838. Students can explore and learn about the major Earth ecosystems and the vital relationships and cycles that sustain all life through this program. EcoAdventures in the Rainforest, from Chariot Software Group, 3659 India Street, Suite 100, San Diego, California 92103, (619) 298-0202. A computer game that introduces players to the world’s ecosystems, increases the students’ study skills, and provides a focus for classroom discussions about the environment.
Eco-Adventures in the Oceans, from Chariot Software Group,3659 India Street, Suite 100, San Diego, California 92103, (619) 298-0202. A computer game that simulates a dive into the ocean. During their dives deep into cold water and shadowy light, users observe a fascinating variety of plants and animals and develop their critical thinking and vocabulary skills.
Ecomap, from Planet Software, P.O. Box 45, Pitkin, CO 81241, (303) 641-5035. A new electronic atlas that helps students and teachers visualize the placement and variety of global ecosystems. SimLife, SimEarth Simulation software by Maxxis Software. SimLife is a program where students create life forms and place them in an environment. SimEarth allows students to manipulate the environment they create and study the consequences.
POPULUS This freeware is a set of simulations that can be used to teach population biology and evolutionary ecology. http://www.fs.fed.us/fmsc/index.php Forest Vegetation Simulator—This is freeware from the Forest Service website http://www.fs.fed. us/fmsc/index.php
ESRI Mapping Software This is the home of ARCView, the primary mapping software in use by many schools as well as businesses and the government. http://www.esri.com STELLA This is a modeling software program which was developed originally as a business application but has become popular in schools as a way to model events graphically. They have a number of applications which also run on their own including Predator-Prey models. http://www.hpsinc.com INSPIRATION This is a software program that allows students to write ideas and brainstorming either as an outline or a concept map/flow diagram. There are many uses for it in the classroom. http://www.inspiration.com
CD-ROMS
Alaskan Marine Contaminants Database, from Dr. Jaweed Hameedi, NOAA/OAD, Alaska Office, 222 W. 8th Ave., Anchorage, AK 99513. This disc contains data collected from 35 studies of the marine waters of Alaska and includes information about the areas of study, contaminants, and the quality of the data. The database allows oceanographic chemists to access data from the past decade.
GLORIA (East Coast Hurricane), from USGS Department of the Interior, 810 National Center, Reston, VA 22092. Disk A: image maps of the hurricane along the east coast of the USA. Disk B: Data files. IBM/compatible, DOS format only.
Global Ecosystems Database, from US EPA, NOAA National Geophysical Data Center, 325 Broadway, Boulder, CO 80303. Major databases on atmospheric data, vegetative patterns, etc. IBM/compatible, DOS format only. Wildlife and FIsh Worldwide — Volume I, from CD-ROM Inc., 1667 Cole Blvd., Ste 400, Golden, CO 80401, 303- 231-9373; FAX: 303-231-9581. 1971-present. More than 200,000 citations from the US Fish and Wildlife Services Wildlife Review and Fisheries Review. Excellent subject coverage, taxonomic, and geographic identifiers as specific as the county, community, lake, and stream level make this CD-ROM an excellent choice for the natural resource researcher. Semi-annual updates. IBM/ compatible only.
Wildlife and Fish Worldwide — Vol. 1, from National Information Services Corp. Citations from the US Fish and Wildlife Service’s Wildlife Review and Fisheries Review. Over 200,000 in-depth records of taxonomic and geographic identifiers.
1989 Toxic Release Inventory, from Government Printing Office, N. Capitol and H Streets, NW, Washington, DC 20401, 202-783-3238. The complete National 1989 Toxic Release Inventory and Hazardous Substances Fact Sheets containing reference materials on the health and ecological effects of the regulated substances. IBM/ compatible only.
Pacific Ocean Temperature and Salinity Profiles, from National Oceanographic Data Center, 1825 Connecticut Ave., NW, Room 404, Washington, DC 20235, Attn: Richard Abram, 202-673-5591. Over 1.3 million Pacific Ocean temperature-depth and salinity-depth profiles taken from 1900 and 1988. IBM/compatible only.
Agricola, from Quanta Press, Inc., 2550 University Ave. W., Ste. 345N, St. Paul, MN 55114, 612-641-0714. Contains the bibliographic cataloging and indexing records of the National Agriculture Library, from 1985 to the present. IBM/compatible only
Arctic and Antarctic Regions, 1950-Present, from National Information Services Corp. More than 260,000 abstracts and citations from six important databases dealing with the Arctic and Antarctic regions.
1:2,000,000-Scale Digital Line Graph Data, from U.S.G.S. National Mapping Division, Earth Science Information Center, 507 National Center, Reston, VA 22092, (703) 648- 6045. Contains data for all 50 states, organized into 21 geographic regions. The data are from late 1979 to the present. Categories of data include: political boundaries, administrative boundaries, streams, water bodies, hypsography, roads and trails, railroads and cultural features.
Global Ecosystems Database, from US EPA, NOAA National Geophysical Data Center; 325 Broadway, Boulder, CO 80303. Major databases on atmospheric data, vegetative patterns, etc. IBM/compatible, DOS format only.
Aquatic Sciences and Fisheries, from Cambridge Scientific Abstracts. Contains citations, abstracts, etc., from leading journals and other publications. Coverage includes biological, ecological, social, economical, and technical aspects of marine, freshwater, and brackish environments. IBM/compatible only.
Acid Rain, from University of Vermont, Bailey/Howe Library, Burlington, VT 05405-0036, Attn: Albert Joy, 802-656-8350. A selection of more than 100 Canadian federal and provincial documents, many in French and English. There are also over 6000 images in the two disk set. IBM/compatible only (386+).
San Francisco Bay/Delta GeoDataBase CDROM- this is a database of information on the San Francisco Bay area from REGIS; Center for Environmental Design Research; 390 Wurster Hall; University of California; Berkeley, CA 94720
Organizations
Coalition to Restore Urban Waters, c/o Golden State Wildlife Federation, 1250 Addison Street #107, Berkeley, CA 94702, (510) 848-2211. A nationwide network of grassroots groups that pursues urban stream restoration and legislation. Friends of Portland Audubon Society, 5151 NW Cornell Road, Portland, OR 97210, (503) 292-6855. Works to preserve and educate about urban wildlife in Portland.
The Planet Drum Foundation, P.O. Box 31251, San Francisco, CA 94131, (415) 258-6556. Works toward greening cities, places volunteers in a wide range of urban restoration projects.
SLUG, San Francisco League of Urban Gardeners, 2088 Oakdale Avenue, San Francisco, CA 94124, (415) 285-7584. Teaches people to develop and maintain urban community gardens. SLUG’s Green Team of teenagers learn valuable skills, while helping to build new gardens.
Urban Ecology, P.O. Box 10144, Berkeley, CA 94709, (510) 549-1724. Dedicated to making the San Francisco Bay Area a sustainable metropolis. Publishes The Urban Ecologist, a good source of information about green city groups worldwide.
Urban Streams Council, The Wetlands Conservancy, P.O.Box 1195, Tualatin, OR 97062, (503) 691-1394. The Conservancy acquires and manages wetlands in Oregon and organizes restoration work.
Convention on Biological Diversity. The Convention on Biological Diversity is now located in Canada. The address is: Secretariat for the Convention on Biological Diversity World Trade Center, 413 St. Jacques St., Office 630, Montreal, Quebec, H2Y 1N9, Canada Tel. (514)-288-2220, Fax. (514)-288-6588, e-mail address: http://www.unep.ch/biodiv. http://www.unep.ch/ bio/conve.html
National Audubon Society, P.O. Box 52529, Boulder CO 80322-2529. Membership information Tel. 1-800- 274-4201. This organization provides educational materials and programs for teachers and the public, and publishes the magazine: Audubon.
National Geographic Society, P.O. Box 96583 Washington DC 20078-9973. The Society has extensive educational materials for teachers and the public, inlcuding National Geographic, and World, and dozens of video productions on wildlife. For information on the Radio Expeditions Program with National Public Radio (which has CDs, audio cassettes, and Teachers” Kits) call 1-800-555-2875. Visit the Radio Expeditions World Wide Web site at http://www.npr.org/RE/
National Wildlife Federation, 8925 Leesburg Pike, Vienna, Virginia 22184. This organization has extensive educational materials for teachers and the public, and publishs: National Wildlife, International Wildlife, EnviroAction News Digest, Ranger Rick, and Your Big Backyard.
World Resources Institute, 1709 New York Ave, N.W., Washington, DC 20006, (202) 638-6300. The institute deals with population education and activities and is one of the most influential environmental organizations in the world. They have an enormous number of resources on the environment and publish a yearly State of the World book as well as a biannual book of statistics .
World Watch Institute, from World Watch Institute, 1776 Massachusetts Ave. N.W., Washington, DC 20036, (202) 452-1999. This institute deals with population education and activities. Sierra Club, The Sierra Club is one of the oldest environmental/outdoors organization. Its’ grassroots advocacy has made it America’s most influential environmental organization. Founded in 1892. http://www.sierraclub.org
Friends of the Earth , is a federation of autonomous environmental organizations from all over the world founded in 1981. There are members, in 66 countries, campaign on the most urgent environmental and social issues of our day, while simultaneously catalyzing a shift toward sustainable societies. http://www.foe.org
Nature Conservancy, founded in 1951, the conservancy is an agency that negotiates the purchase of open space to save it from development. They have an excellent website detailing new purchases http://nature.org
Greenpeace, is an activist environmental organization founded in 1972 that calls attention to world environmental problems. http://www.greenpeace.org
Websites
Global Commons Institute http://www.gci.org.uk Modeling software (freeware or Applet) that shows the trends in climate change if there isn’t a sustained effort to change the world’s economics.
BASIN Boulder Area Sustainability Information Network http://bcn.boulder.co.us/basin/ index.html This is a local group which has excellent resources on the connectedness of everything from ecosystems to earth systems. Sponsored by the Geological Society of America.
University of Texas Maps Online – a series of online maps from around the world. http:// www.lib.utexas.edu/maps/index.html
National Climatic Data Center – supplies weather data from around the country http://lwf. ncdc.noaa.gov/oa/ncdc.html
The Tree of Life – the last word on the classification of organisms. It gives phylogenetic information on organisms. http://phylogeny.arizona.edu/tree/phlogeny.html
Globe – Educators nationwide are linked with University of Arizona researchers to develop a program in which students make environmental measurements and collect them into a global data base. http://www.globe.gov
The Virtual Library of Ecology and Biodiversity – a thorough listing of websites related to ecology http://conbio.net/vl
NatureServe Explorer – an online encyclopedia on life. Offers conservation information on more than 50,000 plants, animals and ecological communities in the United States. http:// www.natureserve.org/explorer
The US Forest Service – They have an excellent website that includes print resources as well as online information. http://www.fs.fed.us/index.html
Governmental publication
USA by Numbers: A statistical portrait of the United States. (Susan Weber, Ed., 1988), from Zero Population Growth, Washington, DC An update is in progress using the 1990 census. A Teaching Kit is available to accompany the book.
Index to Teacher Guide Investigations
- TG-EC1-1. Imaginary Continent
- TG-EC1-2. Mapping Ecosystems
- TG-EC2-1. Energy Expenditures – A Transparent Problem
- TG-EC4-1. Who Dirtied Chesapeake Bay?
- TG-EC4-2. Pollen and Global Climate Change
- TG-EC4-3. Energy Inventory
- TG-EC5-1. The Effects of Carbon Dioxide on Elodea Plants
- TG-EC6-1. How To Make A Cow
TG-EC0-. Investigation: Title
TEMPLATE