TG Climate Change
{ GSS Teacher Guide Index } { All GSS Books }

{}
Overview [] Planning [] Objectives [] Assessment [] Resources
Guides for each Chapter: 1 – 2 – 3– 4 – 5 – 6 – 7 – 8 – 9 – 10
Index of Investigations
Overview
Climate Change addresses the controversial question of how human activities may be changing Earth’s climate. The first three chapters lay groundwork for understanding the science concepts that help us to understand the causes of climate change.
Chapter 1, What Is the Greenhouse Effect?, deals with a key concept that plays a role in the cause of climate change. The principle is applied to a greenhouse, and to Earth systems, pointing out how these systems are similar and different.
Chapter 2, What’s So Special About CO2?, offers a deeper understanding of the fundamental physical theory that underlies the theory of global warming and the greenhouse effect. It provides an overview of modern theories of matter and energy and their interactions, leading to the understanding that greenhouse gas molecules absorb infrared energy because they resonate at infrared frequencies.
Chapter 3, The Composition of Earth’s Atmosphere, is a survey of gases in the atmosphere, and an overview of all of the greenhouse gases and their sources.
Chapter 4, What Is Global Warming?, brings in the first elements of controversy that began in the 1980s and 1990s when people were first realizing that average global temperatures were rising. There is special emphasis on how the debate changed over those decades and how the International Panel on Climate Change (IPCC) was formed with scientists from around the world working to resolve the questions around global warming.
In Chapter 5, How is Carbon Dioxide Measured?, and Chapter 6, How is the Atmosphere Changing?, the students take a “field trip” to Mauna Loa Observatory where they see how scientists have measured carbon dioxide in the Earth’s atmosphere since 1957. They graph and interpret data from Mauna Loa and other observatories which led to the prediction, in 1988, that changes in our atmosphere will cause the entire globe to gradually warm up. They also measure carbon dioxide in the laboratory to find out how much is contained in a sample of human breath and car exhaust. The chapter ends with a look at evidence for human activities which now thought to be responsible for the increase in atmospheric carbon dioxide.
Chapter 7, What Is the Controversy About?, invites students to view controversy within the scientific community, and to begin to distinguish what things are really controversial in the scientific community, as opposed to those things that are seen as controversial in popular media, which are often not at all the subject of controversy among scientists. This chapter poses a dilemma that is frequently found at the interface of science and society: “Decision-makers want clear, definite answers, but the very nature of science is that it rarely produces certainty.” As students explore each of the issues at the forefront of research today, they learn about fundamental concepts of Earth systems and how scientists use both theory and experiment to resolve the outstanding issues. In this chapter, the Staying Up to Date sections of the GSS website are particularly helpful, since new findings are happening frequently.
Chapter 8, What Are The Consequences of Global Warming?, continues the examination of controversy in particular in the realms of what we are seeing more and more in the news that may be a result of climate change.
In Chapter 9, What Are Governments Doing About Climate Change?, and Chapter 10, What Do YOU Think About Climate Change?, students face how the science of global warming has implications for social policy. Starting with excerpts from a Congressional hearing on climate change in the 1990s and consideration of President Clinton’s Action Plan, and bring the societal controversy up to date in international, national, and local realms, students to wrestle with the dilemma of setting social policy in light of scientific findings which are clear on some questions, but uncertain on others. In the last chapter students examine the possibility of global warming from the viewpoints of science and technology, economics, politics, and ethics, and are encouraged to crystallize their personal views of what it all means, and what, if anything, should be done about it.
Overview [] Planning [] Objectives [] Assessment [] Resources
Guides for each Chapter: 1 – 2 – 3– 4 – 5 – 6 – 7 – 8 – 9 – 10
Index of Investigations
Goals and Objectives
Goal 1: Students realize how our way of life depends on Earth’s stable climate.
- Objective 1A: Students can distinguish between the natural greenhouse effect, which has kept our planet at a livable temperature for billions of years, and the increased greenhouse effect, in which human activities may be changing the climate of our planet over a relatively short time scale of a century or two.
- Objective 1B: Students can describe what might occur if the global climate increases by just a few degrees, ranging from positive effects, such as increased rainfall and plant growth, to negative effects, such as increased flooding and drought, loss of coastal plains and wetlands, changing forests, and threats to human health.
- Objective 1C: Students can explain why global climate change is controversial: a change in climate would have significant impact on people and the environment; but doing what is required to prevent climate change would cause economic difficulties. Deciding what to do is even more difficult because scientists cannot provide answers to all of the policy-makers’ questions.
Goal 2: Students grasp how the greenhouse effect controls Earth’s climate.
- Objective 2A: Students can use the concept of resonance to explain why carbon dioxide and other greenhouse gases absorb infrared energy, while oxygen and nitrogen do not.
- Objective 2B: Students can explain how the absorption of infrared energy by glass leads to warming of a greenhouse.
- Objective 2C: Students can describe how warming of a greenhouse is similar to and different from what occurs in the Earth’s atmosphere.
- Objective 2D: Students can describe how the Earth’s climate would change if the greenhouse effect were to significantly increase or decrease.
- Objective 2E: Students can explain major points of agreement and disagreement among scientists about the prospect of global warming.
Goal 3: Students understand how we know that greenhouse gases are increasing, and how the observed increase is related to human activities.
- Objective 3A: Students can describe how the concentration of carbon dioxide in the air can be measured by chemical analysis.
- Objective 3B: Students are able to describe how the concentration of carbon dioxide in the air is measured at Mauna Loa Observatory.
- Objective 3C: Students can discuss the results of the observations at Mauna Loa and the South Pole, and draw conclusions about both seasonal and long term changes in the concentration of carbon dioxide in the atmosphere.
- Objective 3D: Students are able to identify the burning of fossil fuels as the main source of increased carbon dioxide; and three factors that lead to increased fossil fuel burning: growing human population, industrialization, and deforestation.
- Objective 3E: Students are able to able to identify greenhouse gases besides carbon dioxide and discuss some of the human activities that lead to their increase in the atmosphere.
Goal 4: Students formulate a personal response to the possibility of global warming .
- Objective 4A: Students can describe efforts being made by world governments and by the U.S. government to reduce the emission of greenhouse gases.
- Objective 4B: Students formulate a personal position on global warming and the greenhouse effect, taking into account perspectives of science and technology, economics, politics, and ethics. Their position is clearly stated, and leads to a conclusion about whether strong action, moderate action, or no action is necessary to reduce the buildup of greenhouse gases in the atmosphere.
Overview [] Planning [] Objectives [] Assessment [] Resources
Guides for each Chapter: 1 – 2 – 3– 4 – 5 – 6 – 7 – 8 – 9 – 10
Index of Investigations
Planning Your GSS Course
Global Systems Science is intended to be an inquiry-based course, with many student investigations, hands-on laboratory activities, and interactive discussions; but the extent to which it actually is based on inquiry depends on you!
The student book, Climate Change, contains two laboratory experiments (in chapters 2 and 5), a data analysis activity in chapter 6, and several brief activities and projects in the other chapters that involve students in experimenting with materials at home, critical reading, discussions, and writing.
The original Teacher’s Guide to GSS provided additional ideas to enrich the course, with short descriptions of activities from collections that had been published in the 1980s & 90s. The list was prepared by three high school teachers who participated in a GSS Summer Institute in 1995. For a more recent resource on teaching about climate change, a rich collection can be found at the Climate Literacy and Energy Awareness Network (CLEAN) website – http://cleanet.org/
This Teacher’s Guide offers additional laboratory activities developed by other participants in the GSS Summer Institutes. See the Index of Teacher Guide Investigations. They range from fairly well-developed descriptions containing lists of materials and student data sheets, to ideas for activities that you may wish to develop further. These suggestions are included at appropriate places in the body of this Teacher’s Guide. We recommend that you spend some time looking through the entire Guide to decide which activities are most appropriate for your students, and which are feasible given the constraints of time and resources that you have to work with.
Additionally, we encourage you to supplement these materials with relevant articles about global and local environmental issues, as well as other related instructional materials that you may already have on your library shelf. The Staying Current section of the GSS website has links to recent and current articles that are of interest and relevant, keyed to each chapter of this online “book.”
When this unit is completed, you may wish to plan other GSS units that follow logically from Climate Change. For example:
- Life and Climate is concerned with the evolution of our planet over the past 4.6 billion years. It emphasizes the factors that have affected the Earth’s atmosphere and climate, how the changing climate has affected the evolution of life, and how life has profoundly affected Earth’s climate in the past. Students learn how we know what we know about Earth’s prehistory, and meet several Earth Systems scientists. Life and Climate can be viewed as a companion volume to Climate Change in that it places current climate trends into a much broader context.
- Energy Flow illustrates one set of principles on which scientists base their analysis and prediction of global climate change. In chapters most closely related to Climate Change, students trace energy from its production within the Sun, to what happens to it when it enters the atmosphere and interacts with greenhouse gases.
- Energy Use familiarizes students with the vast infrastructure that enables us to draw on Earth resources to meet our energy needs. Students consider the magnitude of fossil fuel burning, how it effects global systems including Earth’s climate system, and what can be done to modify these trends.
- Population Growth is about how the rapid growth of human populations is impacting world systems, including production of greenhouse gases.
Overview [] Planning [] Objectives [] Assessment [] Resources
Guides for each Chapter: 1 – 2 – 3– 4 – 5 – 6 – 7 – 8 – 9 – 10
Index of Investigations
Assessment Tasks
Portfolios
General ideas for assessing student progress towards the goals and objectives of the GSS course are suggested in The Teacher’s Guide – Overview of the GSS. We especially encourage the use of portfolios as a means of providing feedback to students and to demonstrate evidence of student progress to parents. Portfolios for Climate Change might include:
- Short writing assignments, such as analysis of the newspaper articles in Chapter 4.
- A series of written statements, which students select from their own writings during the unit, showing how their ideas may have changed as they learned new information, or took new perspectives into account.
- Written results of laboratory work, from short activities such as use of an infrared remote control device (Chapter 2), to the complete laboratory investigations in Chapters 2 and 5.
- Graphs and analyses of the Mauna Loa data from Chapter 6.
- “What are the human caused sources of carbon dioxide?” investigation, especially the question, “How Has the Area Where You Lived Changed?” from Chapter 6. An example of a student’s essay from this assignment can be found in the GSS Teacher’s Guide—Overview of the GSS Course.
- Answers to questions found throughout the book.
- Observational report of students’ individual contributions to small group work throughout the unit, and especially within the “caucus” group discussions in Chapter 10.
- Final essay in which students describe their personal position on global climate change.
Pre- & Post- Assessments
In addition to portfolios, we suggest that you use assessment tasks both before and after presenting the unit. The papers that students’ complete before beginning the unit will help you diagnose their needs and adjust your plans accordingly. Comparing these papers to the students’ responses on the same tasks after completing the unit will allow you to determine how your students’ understanding and attitudes have changed as a result of instruction.
Tasks which we suggest be used for pre- and post- assessment are as follows:
1. Questionnaire
These questions are designed to determine how students’ knowledge of key concepts have changed during the unit, and whether or not they have changed their opinions concerning personal actions and environmental issues. The Questionnaire is a traditional way to elicit student understanding. It assesses students’ abilities to express themselves as well as insights that they gained from the unit.
2. Concept Map
The Concept Map is nonlinear. Students do not need to think in terms of sentences and paragraphs, and their ideas can flow more freely. Students who are more visual might be better able to show what they know on this task than on the Questionnaire. Asking students to create a concept map before and after the unit is one way to determine which concepts they have learned and their understanding of the connections among these concepts. If students have not had experience in concept mapping, you might want to start them out with a hand-out showing an example (master on p. 10), a general idea of what they are to map, and starting word(s) to help get them started. Once they have had experience with concept maps, they can create them on blank sheets of paper (no photocopying required). Alternatively, they can use concept mapping software such as
Inspiration (http://www.inspiration.com)
CMap (http://cmap.ihmc.us/conceptmap.html – free for noncommercial use).
Omnigraffle (http://www.omnigroup.com/applications/omnigraffle (Mac OSX)
Freemind (http://freemind.sourceforge.net/wiki/index.php/Main_Page – open source software for mind-mapping.)
Microsoft Draw (comes with Microsoft Office)
See Concept Map.
Interpreting Student Responses
The tasks should be interpreted in terms of the objectives listed on page 4-5.
This is straightforward in the case of the questionnaire,
where questions correspond to the objectives as follows:
| Goal | Objective | Questionnaire Number |
| 1 | 1A | 3 |
| 1B | 13 | |
| 1C | 14 | |
| 2 | 2A | 5 |
| 2B | 1 | |
| 2C | 3 | |
| 2D | 4,13 | |
| 2E | 11, 12 | |
| 3 | 3A | 6 |
| 3B | 7 | |
| 3C | 8,9 | |
| 3D | 9, 14 | |
| 3E | 10 | |
| 4 | 4A | 15 |
| 4B | 16 |
The Concept Map task is more loosely related to specific objectives. Comparing students’ papers before and after instruction may show that they have learned more about some objectives than others, or that certain misconceptions persist while others have been corrected. Eventually, we hope to be able to provide sets of instructions (called “rubrics”) to score student papers with respect to course objectives; but we do not yet have enough student data to do this.
In the meantime, we suggest that you pair students’ pre-and post-assessment papers and compare them. With the list of objectives in mind, look for changes in the students’ attitudes and understanding. As you look through your students’ papers, you’ll be able to jot comments for individual students concerning main points they may have missed, or praising them for their insights and ideas. After looking over all of the papers you will be able to write down some generalizations about what the class as a whole learned or did not learn during the course.
The Questionnaire and Concept Map tasks are linked in sub-pages below You may want to make two class sets of each of the tasks, using one color of paper for the pre-assessment measures and a different color of paper for the post-assessment measures.
Overview [] Planning [] Objectives [] Assessment [] Resources
Guides for each Chapter: 1 – 2 – 3– 4 – 5 – 6 – 7 – 8 – 9 – 10
Index of Investigations
Guides for Each Chapter
Guide for Chapter 1:
What is the Greenhouse Effect?
This chapter directly addresses several common misconceptions about global warming:
- The “hole” in the ozone layer is not the suspected cause of global warming.
- Soot from industry will not warm the Earth. In fact, the particles released by burning are expected to reflect light back into space, and will therefore have a cooling effect.
- The predicted changes in climate are not expected to cause major problems in the near future. Large changes in climate—if they in fact occur—will affect our children and grandchildren more than they will affect us.
There is an interesting website that addresses a number of
misconceptions about greenhouse effect:
http://www.ems.psu.edu/~fraser/Bad/BadGreenhouse.html
CAUTION: Don’t use faulty greenhouse effect demonstrations or labs!
For examples of faulty demonstrations and discussion of some of what they get wrong, see
http://climatechangeeducation.org/hands-on/difficulties/heating_greenhouse_gases/problem_examples
There you may see one or more science demonstrations you are acquainted with. Many variations exist, but generally they include: incandescent lamps or the sun as the energy source, glass or soda bottle containers, measuring temperature rise comparing containers full of carbon dioxide next to containers full of air. Some variations add water, soil or rocks to the containers. In practice, it is very hard to conduct an experiment or demonstration that really illustrates greehouse effect.
Fortunately, there are online some scientifically sound demonstrations of aspects of how the greenhouse effect works. See:
http://climatechangeeducation.org/hands-on/difficulties/heating_greenhouse_gases/sound_examples
Overview [] Planning [] Objectives [] Assessment [] Resources
Guides for each Chapter: 1 – 2 – 3– 4 – 5 – 6 – 7 – 8 – 9 – 10
Index of Investigations
Guide for Chapter 2:
What’s So Special About CO2
The cartoon and short paragraph in the introduction are intended to illustrate why the students are asked to learn more about matter and energy. In the cartoon, we see Mother Nature adding just a pinch of carbon dioxide to the atmosphere, “to make the whole thing really work.” As described in the paragraph below the cartoon, the purpose of the chapter to follow is to find why carbon dioxide is so special that without it, our world would be unsuitable for life as we know it.
In order to answer that simple question, the chapter provides an introduction to modern theories of matter and energy. The key concept presented is resonance. Molecules of carbon dioxide gas resonate when they encounter photons of infrared energy; while molecules of oxygen and nitrogen do not. Later, the same explanation will be expanded to encompass all of the greenhouse gases.
Please keep in mind that this chapter is not intended to be a substitute for courses in chemistry and physics; but is intended to whet the students’ appetites for learning more about science. Therefore, we suggest you focus on communicating an intuitive grasp of how matter and energy interact, and what this interaction can tell us about life on Earth.
2 – I. Matter
This very brief sketch of the history of ideas about matter is intended to lead to the idea that matter is composed of atoms and molecules. This is probably not the first time your students have heard this theory, but they may have misconceptions about it. A good way to find out your students’ ideas is to draw a picture of a stoppered flask on the board, with a few tiny circles to represent molecules of nitrogen, the most common gas in air. Explain that the molecules are drawn thousands of times larger than they would be if drawn to scale, and ask them a few questions about it: Suppose I leave this flask alone overnight. Tomorrow, what will happen to the molecules? Will most of them be along the top, bottom, or distributed throughout the flask? Is there anything in between the molecules? What will happen if I introduce carbon dioxide molecules (color these in)? Will they flow in along the bottom, top, or be distributed throughout the flask? Invite your students to share their ideas, then argue and debate different points of view.
2 – II. Light Energy introduces both the wave and particle theories of electromagnetic energy and the idea that photons of different colors have different wavelengths and frequencies. It is important for your students to explore the colors in white light with prisms or diffraction gratings. (A good way to create a rainbow in a darkened classroom is with a diffraction grating placed on top of an overhead projector. A prism placed in the beam will also work. )
Have students play with Slinkies™, other long springs, or ropes, observing how wavelength is related to frequency (speed of shaking). A good activity is for the students to tie one end of a rope or Slinky™ to a stationary object and observe how a single pulse is reflected from the fixed end. (They will see that the direction and shape of the wave is reversed when the wave is reflected.)
It may seem redundant to identify light by both wavelength and frequency, but both concepts are important in understanding the nature of electromagnetic radiation. Wavelength is the most visible and concrete property that allows us to distinguish x-rays from radio waves, or blue light from red or green light. While frequency makes the same distinctions (since it is just the reciprocal of wavelength), it also captures the idea of different energies corresponding to different wavelengths. When students shake the slinky or rope (or in the next activity, the model molecule) they feel that greater energy is needed to produce the vibration than when they shake it more slowly.
2 – III. Infrared (Heat) Energy
The discussion of infrared energy in this section can be made more meaningful if your students can actually feel radiant energy in the classroom. If direct sunlight is streaming into the window, they can put their hands in the beam. They can shade the infrared energy with a piece of cardboard, and feel the cool shadow. If the weather is cloudy, bring in a small space heater, candle, or heat lamp so they can feel the infrared energy.
The activities in Investigation 2.2 might best be done at home, where most students have access to televisions and remote control devices. Short written reports on the student’s findings can be shared in class.
2 – IV. Carbon Dioxide is a very important introduction to resonance which is the central idea that explains how greenhouse gases absorb infrared energy. Nearly everyone has experienced pushing people on a swing, so it should not be difficult for them to relate to the example; but it would also be valuable to set up several pendulums in class. Weights on strings with different lengths have different resonant frequencies. Students will be able to measure these resonant frequencies by finding the rhythm for pushing each pendulum to keep it swinging, and then counting the number of pushes in ten seconds.
2 – V. The Resonant Frequencies of Real Molecules
Investigation 2.3: Why Do Some Molecules Absorb Infrared Energy?
Several different kinds of materials have been used successful to construct model molecules to achieve the resonance effect. Following are the different kinds of materials that were developed by high school teachers during the GSS summer institutes.
- Polystyrene Balls
- Long, Stiff Springs
- Springy Steel Rods
- Taped Hacksaw Blades
- Plastic Strips with Nuts and Bolts
We recommend that you determine which would be easiest to obtain and build a set of molecules to see how easy it is to observe a difference in resonance before presenting the lesson to your students. (To demonstrate the effect, carbon dioxide and methane molecules should resonate quite easily when shaken at moderate speed by hand, while oxygen and nitrogen should only resonate if shake very rapidly, or may not resonate at all.)
Here are two movies by high school teacher Kate Meredith that may help you prepare for Investigation 2.3:
The concept of resonance is a broad and powerful principle in physics that explains a very wide variety of phenomena. In this section, several examples besides molecules are given. Ask your students to think of others in their own experience. Feel free to add some ideas of your own to get the juices flowing.
You can also ask a few questions to help the students see more examples of resonance around them. (For example, the way we speak and hear can be explained by resonance. What is resonating when we speak? What is resonating when we hear? What resonates when a drum is played, or a clarinet or trumpet? Why is it easier to play deep notes on a tuba than on a trumpet?)
Applying resonance to the tiny world of photons and molecules is not easy; but it will be easier for the students to visualize once they have felt resonance in the previous activity, and applied the concept to other situations that they see around them every day. At a microscopic level, they need to visualize infrared photons as vibrating at just the right speed to cause a carbon dioxide or methane molecule to absorb that vibration. In contrast, infrared and visible photons pass right by oxygen and nitrogen molecules without causing them to vibrate. In this way, the concept of resonance explains why air is transparent to visible light, and why it would be transparent to infrared radiation, if it were not for the small percentage of carbon dioxide, methane, and a few other greenhouse gases which all resonate at infrared frequencies.
Have the students look back at the “quick-and-dirty” explanation of the greenhouse effect in Chapter 1 sections I & II. Then have them compare it with the explanation at the end of section 2-V. Ask the students what the explanation on 2-V provides which the description in Chapter 1 does not. (The discussion in 2-V offers an explanation at the molecular level, involving the concept of resonance.) Ask the students to try to describe how the greenhouse effect occurs in their own words.
The greenhouse effect in the Earth’s atmosphere differs from the effect in an actual greenhouse. The explanation is at a molecular level. A good assignment to see if individuals understand the concept presented on the previous pages is to ask them to read page 29-31, and to write a story about what happens to a single infrared photon from the time it leaves the sun, to the time it leaves the Earth for space. Students who finish early might do the same for a photon of visible light.
To help the students review the chapter, you might ask:
- If the greenhouse effect is not new, why do we hear so much about it in the newspapers?
- If carbon dioxide has always existed in the atmosphere, why are scientists making such a big deal about it?
- What do you think life would be like on Earth if we had no carbon dioxide or other greenhouse gases in the atmosphere?
- What if our atmosphere were 1% carbon dioxide instead of .036% that is in the atmosphere today?
- How do you think scientists know how much carbon dioxide is in the atmosphere?
The last question was not answered previously in the book. It is the subject of the next chapter, and a good way to get them to think about the difficulties involved in making such measurements.

TG-CC2-1. Investigation:
Observing Carbon Dioxide Gas
Materials for each team
1 empty tub or dish pan
1 small chunk of solid carbon dioxide (dry ice)
1 bottle of soap solution and bubble-blowing ring
Activity
A wonderful way to test your students’ predictions about what will happen to the carbon dioxide molecules in the flask, is to have lab teams put a lump of solid carbon dioxide (dry ice) into an empty tub. Within a few seconds, the solid carbon dioxide will sublime, forming a cloud of gas in the bottom of the tub. The students can blow soap bubbles and watch them fall into the tub. The bubbles will settle as far as the top of the mass of carbon dioxide gas, where they will stop and hover. In a few minutes the mass of carbon dioxide gas will get larger as more of the dry ice sublimes.
Going back to the drawing on the board, ask the students what their experiments suggest about what will happen to the carbon dioxide atoms in the flask. (They will probably predict that the carbon dioxide molecules will cluster along the bottom of the flask, while the nitrogen molecules will be pushed upwards.)
You may want to return to some of the ideas in section 2-I to conclude the session, explaining that the modern particle theory of matter agrees with Democritus, that there is absolutely nothing between the molecules; and that there are different kinds of molecules, which have different properties. If molecules did not move around all the time, they would fall to the bottom of the flask, but because they are always in motion, they bounce around, filling the flask. This is inferred by the behavior of gases in situations such as balloons, in which the molecules of gas push on the rubber, filling out the balloon. Because the carbon dioxide molecules are “heavier” (have more mass than) the nitrogen molecules, they tend to be found on the bottom of the flask, pushing the nitrogen towards the top.
TG-CC2-2. Investigation:
Resonance Activity Modifications
by Agnes Wu, Greyhills High School, Tuba City, AZ
Wes Knapp, Scotia-Glenville Central High School, Scotia, NY
and Peter Leddy, Norton High School, Norton, MA
Materials
We found the best materials to be styrofoam balls joined by stiff heliacal springs, about 15 cm long. Each team will need the following: 3 styrofoam balls; 2 or 4 springs; 1 clock or watch
Activity
Have the students push the springs into the styrofoam balls as shown in the illustrations. In all models, the springs should be secured with a small quantity of glue after locating the proper positions of the springs.
Creating a methane molecule which accurately reproduces the structure of a tetrahedron is an extra challenge. We were able to mark the styrofoam ball that represented the carbon atom for the positions of the springs as follows:
- Form a piece of wire into a loop with a diameter .95 times the circumference of the styrofoam ball. Mark the circle in three spots, so it is divided into three equal segments (do not cut the wire!)
- Place the wire on the ball, and mark the ball where each of the marks on the wire touch it. This is the location of three of the bonds.
- To find the location of the fourth bond, reposition the wire so that only two of the marks made above align with the marks on the wire. Mark the ball a fourth time at the third mark on the wire. The result should be a ball (carbon atom) with four marks equally spaced three dimensionally around it.
- Push in ends of springs at each mark, and glue into place. Glue styrofoam balls representing hydrogen atoms on the ends of each spring.
Resources
An excellent video available from the American Association of Physics Teachers (AAPT) is entitled Tacoma Narrows Bridge Collapse. This short (10 minute) illustrates how gusts of wind at the resonant frequency of the bridge structure, caused the entire bridge to collapse.
Overview [] Planning [] Objectives [] Assessment [] Resources
Guides for each Chapter: 1 – 2 – 3– 4 – 5 – 6 – 7 – 8 – 9 – 10
Index of Investigations
Guide for Chapter 3:
What Are the Greenhouse Gases?
These pages provide an overview of the composition of the atmosphere, and put the various gases discussed so far into perspective.
The alternative theories in 3-I illustrate two different feedback effects involving water vapor. If the students have used feedback diagrams in the volume GSS A New World View, have them fill in blank diagrams to illustrate these effects. These diagrams can be done in a number of different ways. Following is one interpretation.
If this is a good time to further explore the concept of feedback with your students, you may want to do the activity outlined in the next few pages which illustrates a positive feedback effect that may increase global warming.
3 – I. Ozone (O3) deals with a common misconception that “the hole in the ozone layer causes global warming.” Although the thinning of ozone gas in the upper atmosphere does contribute a small amount of additional radiation, it is in the ultraviolet range, and not the infrared range that causes most of the warming.
This point is further complicated by the fact that ozone is a greenhouse gas and an air pollutant in the lower atmosphere. It is probably easiest to deal with this by suggesting that your students think of ozone in the same way they think of carbon dioxide. It is a greenhouse gas that appears in the lower atmosphere. Ozone in the stratosphere is the same kind of gas, but it is not significantly related to the global warming problem.
3 – II and IV.
These sections summarize all the greenhouse gases and the human activities that have increased their concentration in the atmosphere during the past 130 years.
It is important that students recognize both the positive and negative aspects of the activities that lead to increased levels of greenhouse gases in the atmosphere, and the difficulty of changing these activities without increasing unemployment and poverty. You might ask the students to write two paragraphs about each of the activities listed in 3-IV; one describing the value that activity has had for improving the quality of human life, and the other describing how the activity might be modified so as to slow the increase of greenhouse gases.
Example of Positive Feedback
Theory B. Increased temperature leads to more water vapor in the atmosphere. Water vapor is a greenhouse gas so it will increase global warming.
Example of Negative Feedback
Theory A. Increased temperature leads to more clouds which shade the Earth and decrease global warming.
TG-CC3-1. Investigation:
Calculation: How Much CO2 from a Gallon of Gas?
by Eloise Farmer, Torrington High School, Torrington, CT
Inspired by an activity from the Teacher’s Pet Project, Zero Population Growth, Incorporated
This activity is designed to help students discover how much carbon dioxide their family contributes to the atmosphere.
In the “Carbon Dioxide” section of “The Greenhouse Gases” in chapter 3 of Climate Change, it says, “Just one gallon of gasoline burned in a car’s engine adds about 10 kilograms of carbon in the form of carbon dioxide to the atmosphere.” As your students will find by following the instructions on the next page, this is close, but not completely accurate.
Your students can calculate precisely how much carbon dioxide is in a gallon of gasoline by following the instructions on the student sheet (below; also on separate page).
Name_______________________ Date_____
How Much Carbon Dioxide from a Gallon of Gas?
How much carbon dioxide does your family put into the air every year just by driving the car? You can find out from the Periodic Table of the Elements, and the following equation.
2C8H18 + 25 O2——>18H20 + 16 CO2
The equation shows that for every molecule of octane burned, 8 molecules of carbon dioxide are formed. How much mass is this? Start by finding the weight of atoms by using the Periodic Table of Elements, then use that information to calculate the weight of the octane molecule and the carbon dioxide molecule.
1. The weight of a carbon atom is __________ amu.
2. The number of carbon atoms in octane is __________ atoms.
3. Therefore, the total weight of carbon in octane is __________ amu.
4. The weight of a hydrogen atom is __________ amu.
5. The number of hydrogen atoms in octane is __________ atoms.
6. The total weight of hydrogen in octane is __________ amu.
7. The total weight of the octane molecule is __________ amu.
8. The number of carbon atoms in carbon dioxide is __________ atoms.
9. The weight of each carbon atom is __________ amu.
10. The number of oxygen atoms in carbon dioxide is __________ atoms.
11. The weight of each oxygen atom is __________ amu.
12. The total weight of a carbon dioxide molecule is __________ amu.
A mole (short for gram molecular weight) is a certain number of molecules that has a mass in grams equivalent to the weight of a single molecule in amus. For example, since the molecular weight of water is 18 amu, we can weigh out 18 grams of water and have one mole of water.
13. How much does a mole of octane weigh? __________ grams.
14. How much does a mole of carbon dioxide weigh? __________ grams.
15. One gallon of gasoline weights 2800 grams.
How many moles is that? __________ moles.
16. Since 8 moles of carbon dioxide are produced for each mole of octane burned, how many moles of carbon dioxide are produced from a gallon of gasoline? __________ moles.
17. How many grams does that number of moles weigh? __________ grams.
18. How many kg of carbon dioxide are produced by a gallon of gasoline? __________ kg.
Check the annual mileage that your family car is driven. Assuming that your car averages 28 miles per gallon of gas, how many kg of carbon dioxide does your family driving add to the atmosphere every year? __________ kg
There are more than 200,000,000 cars in the world. If they are driven as much as your family’s car, how much carbon dioxide do these cars add to the atmosphere each year? __________ kg
Answer Key for “How Much Carbon Dioxide in a Gallon of Gasoline?”
1. 12 amu
2. 6 atoms
3. 96 amu
4. 1 amu
5. 18 atoms
6. 18 amu
7. 114 amu
8. 1 atom
9. 12 amu
10. 2 atoms
11. 16 amu
12. 44 amu
13. 114 grams
14. 44 grams
15. 24.6 moles
16. 196 moles
17. 8,645 grams
18. 8.645 kilograms
TG-CC3-2. Investigation: A Comparative Study of Common Atmospheric Gases
by Ellen Strother-Pitts,
Western Senior High School, Baltimore, MD
This laboratory investigation could be used to stimulate discussion in answer to a variety of questions, such as: What would happen to the temperature of our planet if the atmosphere consisted of 100% of each of the gases used in the experiment? What adaptations would humans have to make to survive in such an atmosphere (both mutationally and artificially)?
Materials for each lab team
Same materials above with the addition of silica gel (or other drying agent)
Procedure
- Humid air sample. Create a sample of humid air by pouring enough water into the bottle to cover the bottom. Put on the stopper with thermometer inserted. Allow the bottle to stand overnight so the air becomes saturated with water vapor. It is then at 100% humidity.
- Dry air sample. Cover the bottom of a clean dry bottle with silica gel and cap the bottle tightly.
- Other greenhouse gas samples—carbon dioxide, methane, or nitrous oxide—may be prepared as described above and compared with the samples of humid and dry air.
- Record the temperature in each bottle every two minutes until the temperature stops changing. Make a temperature vs. time graph, showing the results for each bottle in a different color. Answer the following questions:
• Which gas absorbed energy the fastest?
• Which gas retained heat the longest?
• How do these results help you to answer the questions above?
TG-CC3-3. Investigation: Measuring the Heat Capacity of Greenhouse Gases
by Hector Montano, Canutillo High School, Canutillo, TX
More advanced students can do a similar experiment, with two additions:
- use of more sophisticated laboratory equipment; and
- calculating heat capacity of the various gases.
Materials
4 Centigrade thermometers
3 volumetric flasks of 1 liter
3 1 hole rubber stoppers
1 infrared heat lamp with clamp
1 CO gas cylinder with regulator
CH4 gas (lab table gas jets will do)
2 feet rubber tubing
Safety Notes: The 1 liter volumetric glass flasks are very thin and should be handled with extreme care. Also, methane is flammable so any flames or sparks could ignite it causing a fire or burn to the student. Insert thermometers for the students as they can break easily and cause injury. High pressure gas cylinders can be dangerous if they tip over. Place the carbon dioxide cylinder on the floor, and tie it to the table leg.
Procedure
- Make sure the volumetric flasks are clean and thoroughly dry. Label each flask: CO2, CH4, and H2O. Dampen each thermometer with glycerine and drive it through the rubber stopper so that 2 inches are sticking out being ever careful not to break the thermometer.
- Fill each flask as follows:
- H2O: Pour 5 ml of water into a flask and place it underneath the heat lamp until moisture appears on the neck near the opening. Incline the flask so that air will not displace H2O vapor , which tends to rise. When this occurs, immediately insert the thermometer-rubber stopper assembly onto the flask.
- CO2: Connect one end of the rubber tubing to the regulator of the CO2 gas cylinder and insert the opposite end of the tube into the volumetric flask. Keep the flask is upright as CO2 is denser than air. Turn the regulator valve so the gas flows for about 20 seconds, then immediately place the thermometer-rubber stopper assembly onto the mouth of the flask.
- CH4: Connect the rubber tubing to the lab table gas jet in order to collect a sample of methane. Fill for 30 seconds with the flask inverted as CH4 is less dense than air. Immediately insert the thermometer-rubber stopper assembly and have a classmate close the gas jet valve.
- Take the temperature of each flask before starting. Record in the table next to Start.
- Expose the 3 flasks to an infrared light source and start taking readings. Take care that the 3 volumetric flasks are getting the same amount of light. The lamp should be 4 inches from the top of the thermometers. Take a temperature reading every minute for ten minutes.
- Graph the temperature versus time on the graph. Plot your data for all 3 gases on the same graph. Draw a smooth line or curve for each gas and label each curve.
Data Analysis
- Calculate Δ T (change in temperature) for each gas.
- Calculate the heat absorbed by each gas in calories. The specific heat for each gas is as follows:
CO2 – 8.9 calories / mole °C
CH4 – 8.4 calories / mole °C
H2O – 7.2 calories / mole °C
- Step 1 – Calculate the calories, per gram °C of each gas:
calories/gram°C X mole /weight of gas = calories /gram °C - Step 2 – Calculate the calories per gram of each gas:
calories / gram °C X Δ temp = calories / gram - Step 3 – Calculate the weight of 1 liter of each gas:
1 mole / mole weight X 22.4 liters / mole = liters / gram - Step 4 – Calculate the calories in one liter of each gas:
grams / 1 liter X calories / gram °C = calories / liter - Answer the following questions about your results.
- Which temperature rose more slowly?
- Which gas absorbed the greatest amount of energy?
- How is the concept of heat capacity related to the greenhouse effect?
- What do the results of your experiment reveal about which are the most effective greenhouse gases?
TG-CC3-4. A Teacher Challenge;
Heat Absorption by Greenhouse
It occurred to several groups of teachers at the Global Systems Science institutes that an especially valuable experience would be for students to measure heat absorption by greenhouse gases. The idea was certainly promising. Scientists at Mauna Loa Observatory used a heat absorption method to accurately measure the concentration of carbon dioxide gas at a concentration of just .035%. Surely, a pure sample left in sunlight would heat faster than a sample of air! This plan was supported by a published activity in which students measured heat absorption by water vapor, a greenhouse gas.
Unfortunately, all of the efforts by GSS staff and teacher participants have failed (so far) to develop a procedure, using laboratory equipment that is easily available, that will enable students to measure the differential absorption of heat energy by air and pure samples of greenhouse gases. While the results seemed reasonable in most of the pilot experiments, the class data only turned up random differences in the temperatures of the various samples. This was even the case when we tested the published activity.
We have speculated on several reasons why it may be difficult to find consistent differences among the samples. Perhaps the gas samples were too small to absorb enough energy so that we could measure a difference. Perhaps heat was lost through the walls of the containers. Perhaps our methods of measurement were not sensitive enough. We won’t know for sure, until we find a method that works!
We still believe that there’s a simple answer out there, somewhere, and we invite you to join in the search! To get you started, we’d like to share the excellent work done by the high school teachers at the GSS institutes, so that you can benefit from their experience. If you develop a method that seems to show consistent differences when the experiment is done by an entire class of students, please tell us how to do it!
References
Activities for the Changing Earth System (ACES), 1993, “How do Greenhouse Gases Affect Heat Absorption?”
Ward’s Natural Science Establishment, Inc, Rochester, NY; Wards Bulletin 1989; Global Warming
TG-CC3-5. Investigation: Will Melting Ice Caps Increase Global Warming?
by Terry Jimarez-Leyva, Coronado High School, El Paso, TX
Fernando Salvador, City As School High School, New York, NY
and John Clarke, Tewksbury High School, Tewksbury, MA
Inspired by an activity in Hot Water and Warm Homes from Sunlight, a Teacher’s Guide from Great Explorations in Math and Science (GEMS), Lawrence Hall of Science, University of California, Berkeley, CA 94720-5200.
Overview
In this activity, your students will test one aspect of a theory that reduction in the polar caps will speed global warming. They simulate a polar region with pans of water—one painted white to represent a glacier, and one painted black or blue to represent the same area after the ice has melted. They place the covered pans in the sun with water in the bottom, and measuring and compare the temperature of the water in the two pans over about 30 minutes. The results are almost always startling in the degree of difference between the two surfaces.
Background
The Sun is the main source of energy for the Earth. However, about 25% of the Sun’s energy that reaches Earth is reflected back into space by clouds. The rest passes to the Earth’s surface where about 5% is reflected back. On average, 70% of the Sun’s energy is absorbed the land, oceans, and atmosphere, and keeps our planet warm. However, the amount reflected back to space varies from place to place, ranging from almost zero in dark, forested regions, to more than 90% over the white polar regions.
It is possible that a positive feedback effect involving the polar caps may enhance the effect of global warming by decreasing the 5% of the Sun’s energy that is reflected back to space from the Earth’s surface. According to this theory, if an increased greenhouse effects warms the Earth enough to melt a substantial portion of the planet’s ice caps, there will be less white snow to reflect solar energy. The Earth will absorb more energy from the Sun, and will warm even more. This, in turn will cause more of the ice caps to melt, so the Earth will absorb even more solar energy. The positive feedback effect will increase until the Earth reaches a new equilibrium temperature, possibly as hot as it was during the Cretaceous period, when there were virtually no permanent glaciers at the poles, and most of the planet had a tropical climate.
NASA and the British Meteorological Service have both been monitoring glaciers at the North and South Pole, and both have reported that Antarctic ice packs are beginning to break up. It is still too early to determine if this is caused by the greenhouse effect. Also the difference is probably insufficient at this point for a positive feedback effect to kick in.
Research Question
In this experiment, your students will test one aspect of the “ice cap feedback hypothesis.” How much warmer will a region become if the ice has melted, and the surface has turned from white to dark?
Possible Objective
Depending on the specific assignment you give them, your students can improve their abilities to accomplish the following tasks:
- Conduct an experiment to answer a research question.
- Create a table and graph of the data.
- Interpret their findings in terms of the research question.
- Show how the flow of energy explains the result by drawing a diagram.
- Explain how their findings relate to the positive feedback theory.
- Discuss how human activities (such as the burning of fossil fuels), interact with Earth systems (such as the Earth’s absorption of solar energy).
Materials for each lab group
- 2 painted foil pie pans, one painted black the other white
- 2 thermometers
- 2 large locking plastic bags
- 1 cup, beaker, or graduated cylinder for measuring water
- 1 or 2 sheets of lined paper and pencil
- 1 sheet of graph paper; pencils or pens of two colors
- 1 watch with a second hand
Procedure
- Divide the class into teams of 3-4 students.
- Demonstrate the procedure:
- Put the same amount of water in each pan (about 200 ml, enough to cover the bottom).
- Put a thermometer into the water so it can be easily viewed.
- Carefully slip a plastic bag around each pie pan and zip it closed.
- Record the initial temperature in each pan.
- Expose both trays to the same level of sunlight for 20-30 minutes.
- Record the temperature of each pan in a table once per minute.
- Discuss calibration of the thermometers. At the beginning of the experiment, all of the thermometers should read the same, because we know the temperature of the water in the room is the same. If they do not read the same, they must be calibrated by adding a certain number of degrees (usually just one or two degrees) to the one that reads lower. Tell the students that when they record the temperature in the two pans, they should always add that same amount to the thermometer that has the initial lower reading.
- You may want to suggest that one student be in charge of reaching the temperature in each pan, and one student be in charge of recording the results.
- Answer questions about the procedure, then have the students pick up their materials and begin. When they are finished, they can return to the classroom to graph the data.
Conducting the Activity
- Paint the pans at least a day before. Black and white spray paint is quick and easy and adheres very well to the aluminum pie pans.
- If at all possible, do the activity on a bright, sunny day. It is also possible to do it in the classroom with bright lamps, but if so it is important to illuminate the pairs of pans equally.
- If the inside of the plastic bags fog up, students may have difficulty reading the temperature. The bags should be kept closed so the water does not cool off. While it is instructive to plot the entire warming curve, the initial and final temperatures are most important, so it is okay if they miss a few data points because of the fogging of the plastic.
Questions to guide the analysis and discussion
- Which of the two surfaces absorbed more energy from the sun? The light or dark surface? How much was the difference in temperature?
- Draw a diagram explaining the result by showing what happened to the sunlight in the two pans.
- Do your results support or refute the positive feedback theory? Why?
Going Further
- Apply these results to other areas. Is it best to wear dark or light clothes in the winter? Summer? Should houses in cold northern regions be painted with dark or light colors? How about homes in tropical regions?
- Over a series of lab activities, students can learn to use the “V heuristic” to summarize their lab reports on a page. Initially, you may want to fill out all but the “Results” and “Conclusions” sections. During subsequent lab activities you can give them a sheet that has less and less filled out, until they are able to fill in the entire sheet for a lab activity. A copy of the “V Heuristic” for this experiment, with all but the Results and Conclusions filled out is attached.
References
“Do Clouds Provide a Greenhouse Thermostat?” Science News, vol. 142, No. 5, August 1, 1992.
“Greenhouse Snow: Melting Preconceptions,” Science News, vol. 140, No. 7, August 24, 1991.
“Global Warming,” Earth Magazine, vol. 4, no. 3, June, 1995. Miller, Tyler, Living in the Environment, Wadsworth Publishing Co., Belmont, CA.
Stern, P., Young, O., and Druckman, D., Global Environmental Change, National Academy Press, Washington, D.C., 1992.
Overview [] Planning [] Objectives [] Assessment [] Resources
Guides for each Chapter: 1 – 2 – 3– 4 – 5 – 6 – 7 – 8 – 9 – 10
Index of Investigations
Guide for Chapter 4:
What Is Global Warming?
4-Introduction.
This chapter provides a very brief history of the idea of global warming, and responds to a question that intelligent students are likely to raise: Who cares about one or two degrees? This is a good question for class discussion, as it is likely to draw out both information that they have read in the chapter, and their personal opinions and values.
A good sequence of questions for ending the chapter might be:
- What is global warming?
- Why is it controversial?
- How much is the Earth’s temperature likely to change, and when?
- A change of 1° to 3.5° seems like very little. What’s the fuss all about?
You may want to conclude the discussion by emphasizing that in this course students are expected to form their own judgments and opinions: “In the end you will be the judge of what it all means, and what, if anything, we should do.”
Ask for someone to explain the graph ‘Average Global Temperature (Degrees Celsius from 1880 to present). Hansen showed this graph to Congress and it was later published in papers across the country. What does it show? How much did the global average temperature change from 1866 to 1988? (A gradual increase of less than one degree Celsius.) Is it convincing?
Note: A graph showing this data appeared in the newspapers as part of the article about Hansen’s testimony in 1988. Data collected since 1988 are reported on subsequent sections and in Chapter 3. A complete graph updated to 1999 is shown on in the chapter.
Some people have pointed out that the first graph does not begin at zero, and so exaggerates the increase in temperature. While this is true, it is not essential that all graphs begin at zero, as long as they are appropriately labeled. Appropriate horizontal and vertical scales are generally chosen to encompass all of the data, and to reveal details and trends.
Investigation 4.1 How has the depate changed over decades?
This investigation is designed to empower students to think critically and prepare to exercise that skill with other findings and policy making decisions that follow in later chapters.
This activity provides a number of good projects for homework and small group work. Following are some questions that you might want to pose to individuals and/or teams of students:
- Read the article ‘S.F. Forum on Global Warming Hears Heated Scientific Debate‘. In your own words, describe what Hansen said, and each of the objections made by other scientists.
- Read the article ‘Earth’s Temperature Shot Skyward in 1998‘. What new information is provided? What does the new data have to say about the controversy reported in chapter 4? Overall, how has the opinion of the scientific community changed between 1988 and 1999?
- Do the opinions of the two reporters, Petit and Monatersky, come out in the articles? If so, what are their opinions and passages in the articles reveal their points of view?
- What is your opinion of the two articles? What do you think about the prediction of global warming at this point?
Investigation 4.2 A Look at the Berkeley Earth Surface Temperature Project
This investigation was added by high school teacher, Kate Meredith, in 2012. It brings the discussion about whether or not the globe is warming more up to date, at least into the 21st century. When GSS was first developed in the early 1990s, it was an active scientific question as to whether or not the predicted rise in average global temperature (predicted from greenhouse considerations) was actually happening. That is not currently in dispute except by climate change deniers who are for the most part not basing their “beliefs” on scientific bases.
Investigation 4.3 Caption writers
The investigation can be small group work and/or homework. The photos depict:
- a city with encroaching sand dunes,
- storms which may become more frequent and more intense,
- a city that might be inundated by rising sea levels and storm surge,
- wildlife endangered by flooding.
Overview [] Planning [] Objectives [] Assessment [] Resources
Guides for each Chapter: 1 – 2 – 3– 4 – 5 – 6 – 7 – 8 – 9 – 10
Index of Investigations
Guide for Chapter 5:
How is Carbon Dioxide Measured?
The primary purpose of this chapter is for students to learn how the concentration of carbon dioxide in the stratosphere is monitored. Other greenhouse gases are monitored in a similar way. A secondary purpose is for students to learn more about who does science. It is not unusual that the carbon dioxide monitoring project was conceived by a scientist with a Ph.D., but the day-to-day conduct of the project is conducted by people who have a wide variety of different skills, from electrical engineers to meteorologists and student assistants. The interviews in this chapter are intended to help students see that science is done by people with different ethnic and cultural backgrounds, who have taken a variety of different career paths.
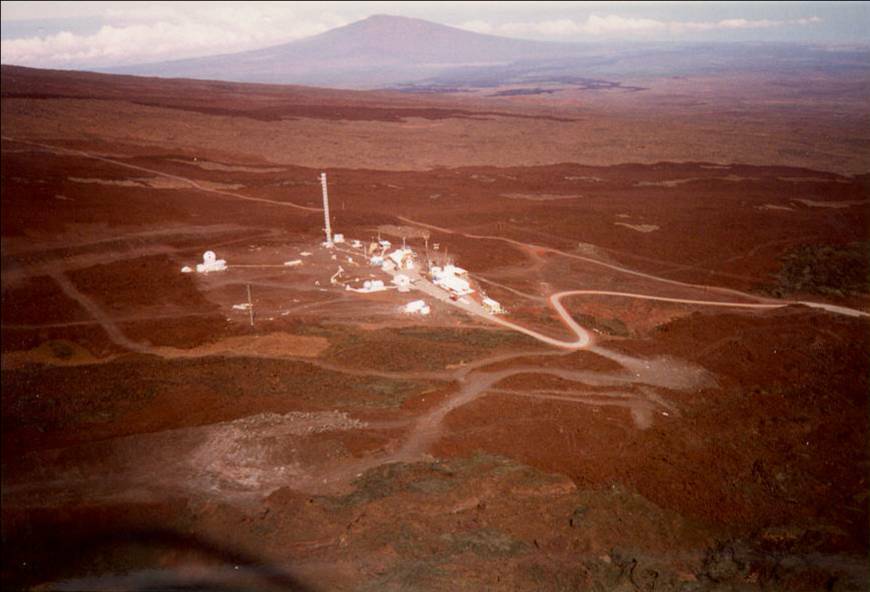
Help students find Mauna Loa on a map. Where is it with respect to other places in the State of Hawaii that they may have heard of, such as Waikiki and Honolulu? (Both are on the smaller island of Oahu.) The two large volcanoes, Mauna Loa (Where the Earth observatory that we visit is located), and Mauna Kea (where the new Keck telescope is located) are both on the Big Island of Hawaii. The Big Island of Hawaii is also a tourist destination, where the famous Kona Coast and the town of Hilo are located.
TG-CC5-1. Investigation:
Observing Carbon Dioxide Gas
Materials for each team
1 empty tub or dish pan
1 small chunk of solid carbon dioxide (dry ice)
1 bottle of soap solution and bubble-blowing ring
A wonderful way to test your students’ predictions about what will happen to the carbon dioxide molecules in the flask, is to have lab teams put a lump of solid carbon dioxide (dry ice) into an empty tub. Within a few seconds, the solid carbon dioxide will sublime, forming a cloud of gas in the bottom of the tub. The students can blow soap bubbles and watch them fall into the tub. The bubbles will settle as far as the top of the mass of carbon dioxide gas, where they will stop and hover. In a few minutes the mass of carbon dioxide gas will get larger as more of the dry ice sublimes.
Going back to the drawing on the board, ask the students what their experiments suggest about what will happen to the carbon dioxide atoms in the flask. (They will probably predict that the carbon dioxide molecules will cluster along the bottom of the flask, while the nitrogen molecules will be pushed upwards.)
You may want to return to some of the ideas for the beginning of Chapter 2 to conclude the session, explaining that the modern particle theory of matter agrees with Democritus, that there is absolutely nothing between the molecules; and that there are different kinds of molecules, which have different properties. If molecules did not move around all the time, they would fall to the bottom of the flask, but because they are always in motion, they bounce around, filling the flask. This is inferred by the behavior of gases in situations such as balloons, in which the molecules of gas push on the rubber, filling out the balloon. Because the carbon dioxide molecules are “heavier” (have more mass than) the nitrogen molecules, they tend to be found on the bottom of the flask, pushing the nitrogen towards the top.
Investigation 5.1. An Interview with Pieter Tans
This is an interview we had the good fortune to arrange in the summer of 2011 with a senior scientist at the Earth System Research Laboratory (ESRL) of the National Oceanic and Atmospheric Administration (NOAA) in Boulder, Colorado. It is a rare insight into methods, motivations, and career paths.
In Part 2 – II. To the Top of Mauna Loa,
responses to the questions raised are:
Why is it necessary for Aidan Colton to hold his breath?
Like all animals, people exhale carbon dioxide. So Aidan Colton’s breath would make the concentration appear higher than it actually is if he does not hold his breath.
Why is Aidan Colton the only one allowed to take flask samples? Controlling variables—keeping everything the same except for the test variable—is very important in an experiment. If the same person collects the data, it is more likely that the samples will all be alike. The only thing different will be the date on which the sample is collected. That will make it possible to infer from the data how carbon dioxide concentration is increasing over time, and rule out the possibility that there is some change in the collection in the data.
It may seem odd that the text describes three methods for collecting and measuring carbon dioxide—the single flask method, the new flask method, and the continuous monitoring system on top of Mauna Loa. The whole story is included for several reasons. First, it shows how techniques in science often progress, from very simple methods to more complex techniques designed to improve the quality of the data. Second, it shows how two different techniques are used to check the accuracy of the result. And third, the three methods introduce ideas important to the monitoring of carbon dioxide one step at a time; from simple collection of a sample in a chamber (the single flask method), to improved sampling of uncontaminated air from a tall tower (methods two and three), to the purification of the sample and actual measuring techniques (continuous sampling on Mauna Loa.)
The diagram at the end of 2 – II. To the Top of Mauna Loa provides an overview of the carbon dioxide monitoring process at the observing station on top of Mauna Loa.
You might want to ask the student:
Why is the air collected at the top of a tower? Does this remind you of anything else we saw in this chapter? (This is an improvement over the telescoping tube first used. The idea is to sample the air as far away from contaminants, such as human breath and breezes from lower altitudes, so that the air sample represents the average atmosphere of the Earth.)
Why is it necessary to extract the water vapor from the air? (This foreshadows Chapter 7 in which we find that water vapor is also a greenhouse gas. If it is permitted into the test chamber, the result will give an incorrect reading of the amount of carbon dioxide. For now, let the students express their opinions; then remind them of this when they read about water vapor as a greenhouse gas in Chapter 7, so they can figure it out for themselves if they have not already done so.)
What is happening to the carbon dioxide gas at a molecular level inside of the test chamber? (The molecules resonate and absorb energy from the infrared photons. They vibrate and move around faster. The movement of molecules is measured as an increase in temperature of the test sample.)
How does measuring temperature help the researchers measure the amount of carbon dioxide in the air? (A higher temperature means that more carbon dioxide must be in the air. The test gases, which have a measured amount of carbon dioxide, allow them to relate a certain temperature to a certain concentration of carbon dioxide.)
Understanding the experiment, by following the steps on the continuous CO2 monitoring process, will help the students understand what they are seeing in the pictures in the ‘Overview of the Carbon Dioxide Monitoring Process at Mauna Loa Observatory’. Otherwise, it’s nothing but a jumble of machines and wires. For each picture, ask the students to identify which number in the process, where that piece of equipment would be placed, and what its function is supposed to be.
Ask the students what the gas concentrations on the tanks in the photos are. They can guess from the drawing they would be 340ppm and 370 ppm. The other gases are combined in the amounts in which they actually occur in the atmosphere.
2 – III. Living and Working on Top of a Mountain
The purpose of this section is to give a better overview of the work that goes on at the Mauna Loa observatory. In the picture we see two full-time employees and learn a little about what it’s like to work in science at a remote observing site. The two individuals from NOAA headquarters illustrate that although Mauna Loa is in an isolated location, it is tied into a network of scientists and technicians spread throughout the globe.
A good activity to end the unit might be to ask the students to write about whether they would or would not like to work at a place like Mauna Loa. An alternative topic would be how the work that these people are doing at Mauna Loa today may affect the lives of their children and grandchildren in the future.
Investigation 5.2 Sampling Carbon Dioxide
The method of measuring the concentration of carbon dioxide in the air used at Mauna Loa requires sophisticated equipment not normally available in the classroom. However, it is possible for your students to measure the relative amounts of carbon dioxide in different samples of air using a chemical method.
Four Teacher Guide Videos by Kate Meredith:
Although the method used by your students is different from the method used on Mauna Loa, the idea that they can measure the concentration of an invisible gas in the air is very clearly communicated in this activity. Additionally, students have opportunities to practice lab skills such as sampling, use of acid/base indicators, measurement, qualitative and quantitative observation, titration, and use of a laboratory control.
Furthermore, nearly all students enjoy the colorful chemistry in this experiment, and are able to obtain results that are very satisfying, so it is really worth the effort to gather the materials and have student teams do the experiment. It is much more exciting for them to do it, than to see it done as a demonstration!
The step-by-step procedure is not difficult for most students to follow; but some may require assistance. It is best for you to do the experiment on your own before presenting it to the class, so that you will be prepared to answer their questions. Following are a couple of tips:
- Reaction bottles. Vinegar and baking soda are mixed in the reaction bottle to produce pure carbon dioxide. We have found tall wine bottles to be excellent for this purpose. In smaller bottles, the mixture bubbles to the top and into the balloon, while in 2-liter plastic soda bottles, the thread at the top causes air to leak. If you have other bottles, experiment with them to see if you can get a good sample of carbon dioxide.
- Avoid contamination. Caution the students to take care to get the reactants inside the bottle without leaving any on the lip of the bottle where the balloon will be placed. If vinegar or baking soda are in the balloon, rather than just the carbon dioxide gas sample, the results will be changed.
- Preparing the BTB solution. Prepare the solution in a large gallon jug, and then pour it into small dropper bottles for the student teams. Mixing the solution all at once will ensure that all of the students’ dropper bottles will contain the same concentration of BTB. Mix enough BTB with the water—usually 75-100 drops of concentrate per gallon of water—so the solution is a deep translucent blue. Test the solution by putting some in a vial and blowing bubbles in it with a straw. In a few breaths it should turn green and then yellow. Once the solution is prepared, pour it into dropper bottles for the students.
- Preparing the ammonia solution. Again, prepare a dilute solution of 1 part household ammonia and 25 parts water. We have found that different brands of ammonia come in different concentrations. The 1:25 ratio works well for Parson’s Ammonia. Prepare a solution and test it with a sample of pure carbon dioxide. Bubble the carbon dioxide through the BTB. If the BTB is the right concentration, the solution will turn yellow. Then titrate it with ammonia. If it requires 50-100 drops of ammonia to turn the solution blue again, the concentration is about right. (If it takes just a few drops, the solution needs to be more dilute. If it takes more than 100 drops, the solution should be more concentrated.) When you are sure the concentration is right, pour the solution into dropper bottles for each team.
- It will save time to distribute the materials on a tray to each team. Use the list of materials listed. Keep the bottles of ammonia in reserve until they are needed, so students do not use them accidentally.
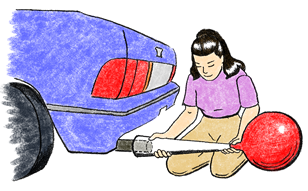
- The greatest danger from this experiment is that a student might be struck by a car when the class goes outdoors to collect an auto gas sample. Collecting the sample for the students is not nearly as effective as having them collect the samples. So, we recommend that you position the car in a safe place, possibly a parking lot, near the school, where the class can stand around and watch as a representative from each team collects the sample in a balloon.
Good luck!
TG-CC5-2. Investigation: The Balance of Carbon Dioxide in the Atmosphere
by Jim Ingram, San Andreas High School, El Paso, Texas
and Rich White, Cholla High School, Tucson, Arizona
The solutions and equipment used for “Sampling Carbon Dioxide” can be used for these two additional activities. However, for each lab team you will also need a beaker and stirrer, two test tubes, three culture tubes with stoppers, yeast, two more balloons, and aquarium plants (such as elodea or anarchis.)
Activity A. “How Much Sugar?” (Investigating Respiration)
Tell the students that they will be experimenting with yeast—the substance that bakers use to make the holes in bread. Ask them to imagine that they lost their favorite recipe, which produced a very fluffy bread with lots of holes. The objective of the experiment is to see how much sugar should be added to the bread.
Show the students how to mix 50 ml of warm water, one package of dry yeast, and a measured amount of sugar in a beaker and stir until the yeast is dissolved. (Use water that is slightly warmer than body temperature. Hot water will kill the yeast, and cold water will not allow the yeast to reactivate.) They should then pour the mixture into a test tube so it is half full, and slip a balloon over the top of the test tube.
Suggest that teams compare two test tubes: one with no sugar and one with a selected amount of sugar. Each team might select a different amount of sugar to add, so that the pooled data will reveal how much sugar is optimal. Students should begin to see balloons fill after five minutes. Each team can measure the circumference of its balloon with a tape measure or a string and ruler.
Have students pool their data and draw conclusions about how much sugar to add to the bread (per packet of yeast.) Have the students discuss what they think the gas is. They can then test the gas by bubbling it through BTB. (Surprise—it’s carbon dioxide!)
After the experiment, you can tell the students that yeast is a living organism (a fungus) which uses sugar as food. Respiration of yeast produces alcohol and carbon dioxide. This is the same process of respiration that occurs in virtually all plants and animals (including humans!)
Activity B. “The Role of Plants” (Investigating Photosynthesis)
Using a beaker of BTB solution and a straw, have students slowly blow bubbles until the solution turns bright yellow. (This will probably take a few breaths.) Invite them to discuss why it turns yellow. (Respiration generates carbon dioxide gas, which turns to carbonic acid in the water. BTB is an indicator. The carbonic acid causes the indicator solution to turn yellow.)
Have the students divide the yellow solution into three culture tubes with airtight stoppers. One tube should be left as a control. Into each of the other tubes, place a leaf of an aquarium plant such as elodea or anarchis. Put one of the tubes with the plant into a dark place and the other into the light. Ask the students what they think will happen and leave the culture tubes overnight. The next day, it is probable that the tube with the plant in the light will turn blue, while the solution in the other two will remain yellow.
Ask your students if they can explain the result. (The plant in the light absorbs the carbon dioxide from the water through the process of photosynthesis. The plant in the dark does not photosynthesize because of the absence of light, so it cannot absorb carbon dioxide.)
Ask the students to relate the results of their experiments to carbon dioxide in the atmosphere. What are some natural processes that add carbon dioxide to the air?
What are some processes that remove carbon dioxide from the air?
Overview [] Planning [] Objectives [] Assessment [] Resources
Guides for each Chapter: 1 – 2 – 3– 4 – 5 – 6 – 7 – 8 – 9 – 10
Index of Investigations
Guide for Chapter 6:
Is the Atmosphere Really Changing?
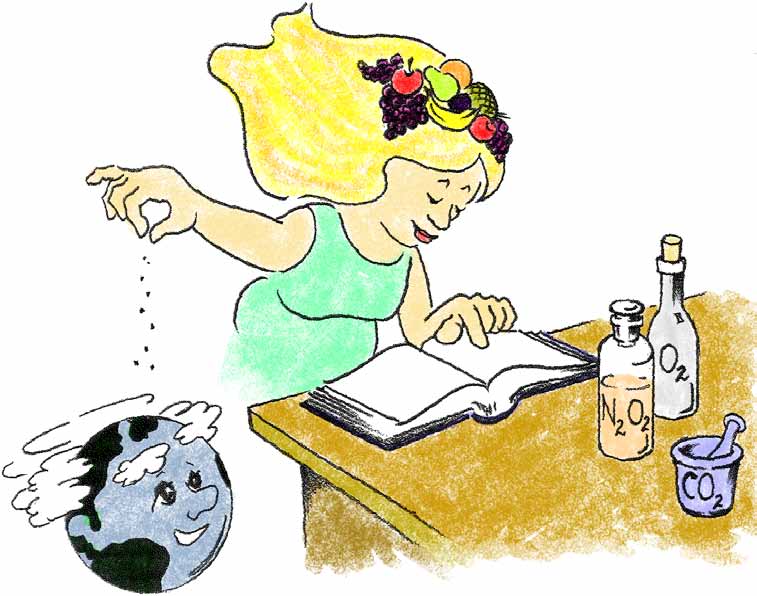
The cartoon in the introduction is meant to capture one aspect of science—data analysis. Even on the beautiful island of Hawaii, pouring through piles of data and plotting points on a graph can be tedious. But when you look at your results, something wonderful might happen—a pattern that tells you something about the world!
Ask the students what they think the cartoon has to say, both before and after they have completed the activities in this chapter. If their thinking seems limited to the idea that “science is boring,” ask them to imagine what might occur when the person in the cartoon wakes up and sees the patterns in the data. What might she have discovered? What might she say? What might be the value of her discoveries to other scientists? To people who live along the coasts or on islands? To her children or grandchildren?

Investigation 6.1 – The Findings from Mauna Loa
Part A. Students who have experience with graphing will just need a sheet of blank graph paper. They can figure out that the vertical scale should be titled “Concentration of Carbon Dioxide in ppm,” and should run from 350 or 352 ppm to 360 ppm. The horizontal scale should be titled “Time,” and should be divided into 24 equal segments, labeled by month from 1/91 to 12/92. If your students are not prepared to do this on their own, you may want to label a sheet of graph paper, copy it, and give it to the students to plot the information.
(As mentioned earlier in this Teacher’s Guide, all graphs do not have to start at 0. The horizontal and vertical scales should range from the lowest value to the highest in the data, and proportions should reveal details and trends. By convention, time is on the horizontal axis.)
Possible answers to the questions in the investigation are as follows:
- 6.1. The most obvious pattern in carbon dioxide concentration is seasonal. It increases until May, 91, then decreases to a minimum in September and October, 91, then increases again to a maximum in May and June, 92, decreasing again to a minimum in September, 92. The students may also notice that the concentration of carbon dioxide is a little greater in 1992 than in 1991, but that observation is not as obvious as the seasonal difference.
- 6.2. The amount of carbon dioxide in the air increases during the months of November-May. Students may have different theories.
- 6.3. The amount of carbon dioxide in the air decreases during the months of May-September. Listen to students’ ideas about this.
- 6.4. In early Spring, plants begin to grow, while the last season’s growth is still decaying. By mid-Summer, plants are growing most rapidly, absorbing carbon dioxide, and incorporating the carbon into their tissues.
- 6.5. In Fall, plants die, and by September and October, they start to decay, releasing carbon back into the atmosphere. This process continues through the Winter.
- 6.6. The evidence does appear to support a connection between plant growth cycles and the concentration of carbon dioxide in the atmosphere; at least in the Northern Hemisphere.
Part B. Allow time for the students to work in pairs to discuss their predictions in response to the questions section. Write the different predictions on the chalkboard, asking students to vote on what they think will occur. If students are confused about why seasons are reversed in the two hemispheres, don’t address this just yet. Wait until after they have completed the activity. Then have them plot the data.
The students will find that the seasonal pattern of carbon dioxide concentration in the Southern Hemisphere is just opposite to that in the Northern Hemisphere, but the amplitude—the difference between the highest and lowest values—is less. Invite the students to explain why they think that is the case.
Responses to the questions 6.14-6.16 are as follows:
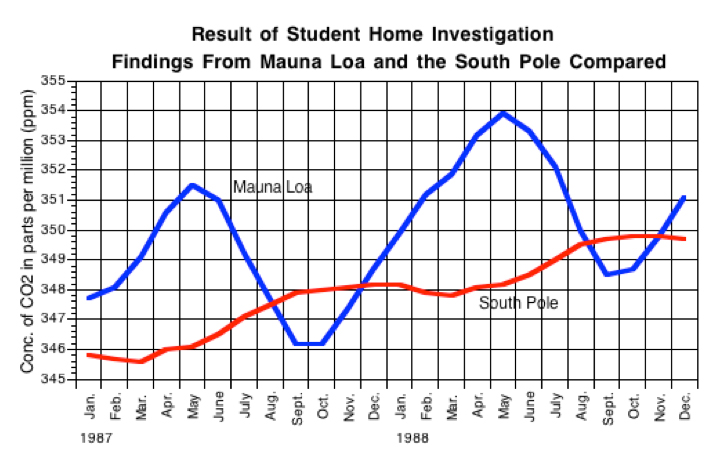
- 6.14. About 315 ppm.
- 6.15. About 356 ppm (midway between 352.8 and 359.3).
- 6.16. (356-315)/315 = .13 = 13%
2 – I. Seasonal Changes
The discussion of seasonal changes gives an explanation for the seasonal changes in carbon dioxide concentration. Students who figured it out from their own analyses will probably be gratified to see their theories confirmed. Those that did not, have an opportunity to learn about it here.
The seasons are frequently misunderstood by both students and adults. The Earth is not warmer in summer because we are closer to the sun. (In fact, the Earth is slightly further from the Sun during the Northern Hemisphere winter.) Instead, the Earth’s axis is not pointed at right angles from the plane of its orbit around the Sun; but rather at a tilt of 23-1/2°. The axis keeps this orientation (pointing at the North Star) as it orbits the Sun, during one year. This causes the more light and heat from the Sun to fall on one hemisphere more during one half of the year, and on the other hemisphere during the other half-year.
You may want to demonstrate this with a globe and a single lamp in a dark room. First show how the Earth spins on its axis (once a day) and orbits the Sun (once a year.) Demonstrate that if the axis were pointed straight “up” (perpendicular to its orbit around the Sun), both hemispheres would receive equal light and heat throughout the year. It would still be colder at the poles and hotter on the equator, but the weather would not change during the year.
Tilt the Earth as you carry the globe around the Sun again, showing how the entire North Polar region is bathed in sunlight during the Northern Hemisphere summer, and how it is in total darkness during the Southern Hemisphere summer. Allow students to take turns demonstrating this so they can see it several times.
2 – II. Are Humans Changing the Atmosphere?
This is a good activity for small teams of 3-4 students. Have them read the section, study the graphs, and answer the questions in Q6.18. Different interpretations are possible. One is that the increase in carbon dioxide has caused global warming—the increased temperature of about .3°C to .6°C in the past 130 years. Another is that the increase in the Earth’s temperature is part of a natural trend, and the increase in carbon dioxide is not yet enough to cause the increase of temperature. In previous chapters the IPCC said the relationship between carbon dioxide increase and global temperature was likely, but they were careful not to say that these conclusions are definite. (Unfortunately, certainty is rarely possible in science.)
Investigation 6.2. – What Are Human-Caused Sources of Carbon Dioxide?
With investigation 6.2, students students can compare photo of San Francisco at the beginning and end of the 20th century.
If it is possible to locate photographs of your community 100 years ago, it is likely that students will see evidence of changes that have increased the addition of carbon dioxide to the air from the burning of fossil fuels. Means of transportation have changed, the population increased so that even more fuel is burned, vegetation may have been cut back so that less carbon dioxide is absorbed, and so on.
Teachers have had great success by having students interview parents and grandparents for evidence of change in life-style, and then writing about what they found out. It is okay if these discussions and papers reflect general changes in the environment and ways of living, rather than narrowly focusing the students’ attention on activities which increase greenhouse gases.
Overview [] Planning [] Objectives [] Assessment [] Resources
Guides for each Chapter: 1 – 2 – 3– 4 – 5 – 6 – 7 – 8 – 9 – 10
Index of Investigations
Guide for Chapter 7:
What Is the Controversy About?
7 – Introduction
The cartoon is a good place to begin discussion. Who is the patient? What does the chart at the end of the bed show? What is the patient’s diet? How is it related to the issues discussed in Chapter 1? What perspectives on global warming and the greenhouse effect are expressed in the opinions of the two doctors?
The discussion on these two pages is aimed at showing why the controversy is important. You might ask the students if they know anyone whose job might be affected if the U.S. Government decides to significantly reduce the amount of fossil fuels used in this country. (Just about all jobs will be affected if the cost of energy goes up.)
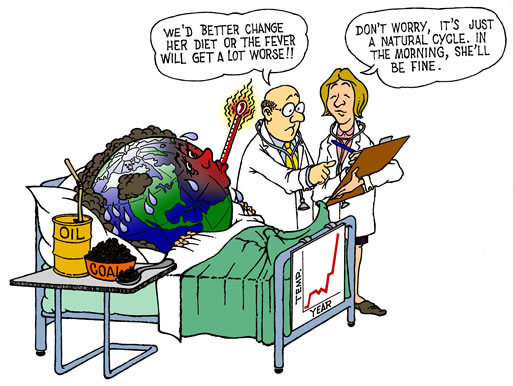
The discussion in paragraph 2 introduces an important set of ideas. Scientists advance by skeptical inquiry. They are always testing the prevailing theories. It is common for people who misunderstand this process and dismiss theories or experimental results if other scientists challenge them. The misunderstanding is that the process does not end with controversy. Equally important for the advancement of knowledge is consensus—the gradual agreement by the scientific community that a particular theory or line of investigation has something to say about the real world.
The great value of studying the topic of global warming, in contrast to well-established theories such as Newton’s Laws, is that students can see the interplay of controversy and emerging consensus. Allow some time for the students to talk about what the agreement of the IPCC panel means, as contrasted with the disagreement of individual scientists reported in the articles in Chapter 4, Investigation 4.1.
2 – I and 2 – II give an overview of what is known and issues still to be resolved concerning global warming. It is a road map for the rest of the chapter. Invite students to ask questions about what is known. They may be surprised that there is virtually complete agreement on these important issues. You might remind them of the concluding statement in Chapter 4, when the controversy about global warming was much hotter than it is today, “We may not agree that we can already see the warming, but most of us believe in the general idea of the greenhouse effect.”
In order to encourage the students to think about the issues before reading the rest of the chapter you can ask them for their opinions about each of the questions listed in 7-II before reading more.
7-III: The second graph in section 7-III (Temperature Change for the Past 160,000 Years) surprises many people. It illustrates that the “ice age” was not a brief period in prehistory, but was actually the usual climate during the past 160,000 years. Today we live in a relatively “short” interglacial period. Ask the students to describe how our lives might be different today if we happen to have been born 30,000 or 40,000 years ago, when Stone Age hunters painted pictures of mammoths and bison on the walls of caves.
It is also a good idea for the students to look back at the graph on page 18 to see what the climate was like when agriculture was invented, and the first large civilizations began in Northern Africa and Mesopotamia. Ask the students if they think there might be a connection between the warming climate and the invention of agriculture. (Yes, crops cannot grow in the snow! Generally warmer climates increase the regions of fertile soil and more carbon dioxide in the atmosphere at that time also increased plant growth.)
Part of section 7-III is meant to convey the immense amount of careful work involved in generating data points in the graphs of average global temperatures for time periods before temperatures were actually recorded. Research teams who have compiled the data continue to refine each data point so the results are as accurate as humanly possible. A key concept here is the concept of proxy data—measurements of things that can be indicators of temperatures, without the need for thermometers, since we do not have any time machines that allow us to take thermometers into the distant past.
The box with the example of proxy data to estimate the number of mice living in an area using mice droppings concludes with the question, “Can you think of other examples in which proxy data could be useful?” It is worth taking some time for the class to discuss that. Class discussion is even more valuable if answering the question is given either as homework or a writing assignment in class.
Investigation 7.1 may be used as an exercise for students to practice critical reading. They are expected to analyze the material in section 7-III and identify evidence or findings (observations and facts) that support claims and qualifiersthat are limitations on the claims, with claims being
- “The observed warming is part of a long-term natural cycle.”
- “Changes in the solar cycle are responsible for the warming observed in the last 100 years”
Following strong recommendations from high school science teachers, we have tried to be consistent in using the Celsius scale. But articles in newspapers often use Fahrenheit. You might want to ask your students to check the graphs to see if they agree with the data in the article. The data for 1995 can be read from the graphs and converted to Fahrenheit using the conversion equation in Chapter 10 section VII.
°F = ((9/5) x °C) + 32° or °C = (5/9)(°F – 32°)
Teacher Guide Video by Kate Meredith:
7-V: You may want to pose this question to your students: How do the temperature graphs in section 7-III relate to the finding that current levels of carbon dioxide are higher now than at any time in the past 420,000 years?
7-VI: concerns predictions of how much the Earth’s global climate will warm when the concentration of greenhouse gases double. Before the industrial revolution the concentration was about 280 ppm. Today it’s about 360 ppm. The IPCC report predicts that it will reach about 560 ppm by the end of the next century.
The doubling time is arbitrarily selected as a reference point. Here is where climate models come into play in a serious way. You may go more in depth concerning climate models by have students explore the reference at the end of this section that points to Climate Modeling 101 at National Academy of Sciences (http://nas-sites.org/climatemodeling/).
Observable changes in the climate can occur well before the doubling time is reached. Nonetheless, the biggest changes are not expected to occur for a very long time. Some students may take the point of view that “Why should I care? I’ll be dead then! Others may be more concerned for the future of the children and grandchildren that they expect to have some day. Ask the students to share their ideas about this. One technique is to put both viewpoints on the board and ask the students where their own opinions fall between these two extremes.
“Why should I care?”………..“I care about the future!”
1 2 3 4 5
7-VII: The space given to the interview with Dr. Lynn Talley provides an opportunity for students to glimpse behind the scenes, and see the deeper reasoning behind the predictions of greenhouse warming. In Dr. Tally’s vision of the link between the oceans and atmosphere spans vastly different time scales, from hours to centuries. The interview and photograph also introduce students to a scientist. You may want to ask the students what they think of the interview. What did Dr. Talley say about the role of the ocean in climate change? What is she doing to find answers to questions about climate change? Could you imagine being in her shoes?
Since the oceans are separately named, your students may not be aware that they are interconnected. In essence, the world has one vast ocean, with currents that run from one to the other. The distances traveled by the water are so long that a complete circuit for a drop of water takes 500 to 1,000 years. A way to help the students visualize this is to ask them to make up a short story telling of the journey of one drop of water as it travels through the entire “World Ocean.”
Good questions for review of Chapter 7 are:
- What do we know about global warming?
- What questions require further research?
- Why is it important to answer these questions?
Below are 3 additional investigations that may be used in conjunction with chapter 7.
TG-CC7-1. Investigation:
What Drives the Global Conveyor Belt?
by Carl Katsu, Fairfield Area School, Fairfield, PA and Arnold Beckerman, Jamaica High School, Jamaica NY
This activity was inspired by a related activity developed by the authors at Project ESTEEM (Earth Science Teachers Examining Exemplary Material) at the Harvard Center for Astrophysics, during the summer of 1990.
Overview
The diagram of the Global Conveyor Belt, on page 24, shows worldwide ocean currents. The text says that “ salty water (which is already more dense than fresh water) cools and becomes even denser.” These ideas become much more meaningful to students if they have an opportunity to explore how the properties of saltiness and temperature each affect the way water flows.
In this laboratory activity the students observe what happens when a fluid of one density is placed in a fluid of a different density. The fluids are salt water and fresh water, cold water and warm water. They generalize their results to describe what occurs in the world’s oceans to drive the global conveyor belt pattern of ocean currents.
With some groups of students you may wish to make this into a quantitative laboratory activity in which they create their own salt solutions and heat water samples to different temperatures, and use a stop watch to measure differential rates of flow.
Background
The global “conveyor belt” shown on page 24 plays a very important role in maintaining regional climates around the world. Like all convection currents, global ocean currents are driven by differences in density. Colder water is denser than warmer water and saltier water is denser than water that has less salt in it.
Aided by prevailing winds, warm waters from the Caribbean flow northwards towards the North Atlantic. Air blowing over the warm waters carries a moderate climate to Northwestern Europe, which would otherwise be much colder. Arriving in the vicinity of Greenland and Iceland, the relatively warm waters evaporate, so the water becomes saltier and denser, and begins to sink. As these waters sink, they bring some heat with them, cooling the Earth. Additional cooling is due the removal of to carbon dioxide which is dissolved in surface waters, and then sinks when the water becomes saltier and denser.
The cold waters from the North Atlantic continue flowing southward along the entire floor of the Atlantic Ocean until they reach the waters off Antarctica which are even colder and denser. The water wells upward, is cooled to the freezing point, and sinks again. The extremely cold and dense bottom waters flow from the Antarctic around the tip of Africa into the Indian, Atlantic, and Pacific Oceans where they eventually well upwards to repeat the cycle.
At present the global conveyor belt pattern of ocean currents is a negative feedback process. It resists climate change by redistributing heat and removing carbon dioxide from the atmosphere. But if global warming increases substantially, this process may stop functioning. Melt from mountain glaciers and the North Polar Ice will dilute the salt concentration of the North Atlantic, and reduce the driving force of the entire ocean circulation system. Average temperatures in Europe could drop by as much as 5°C in as little as a decade, and it may take hundreds or thousands of years before the global conveyor belt system could be reestablished.
Hot Tip!
It’s best to present this activity just before the students read about the Global Conveyor Belt theory. After doing the activity, focus discussion on the results that the students found, and changes in density that occur with changes in water temperature and salinity. Then, when the students have read about the Global Conveyor Belt, have them discuss how what they learned from the activity helps them explain what makes the ocean currents dive to the bottom in some areas and upwell in other areas.
Materials
For each lab group:
1 large open-mouth clear container (e.g. a 1000 ml beaker)
1 small narrow-neck bottle (such as a Barnes bottle)
1 container of tap water (approximately 500 mL)
1 container of saturated salt water solution (approx. 500 mL)
1 container of warm water (approximately 500 mL)
1 container of ice water (approximately 500 mL)
1 small container of food coloring
1 set of safety goggles and lab apron (optional)
Optional (for quantitative measurements)
1 stop watch
1 immersible thermometer
1 graduated cylinder
1 medicine dropper
1 glass stirring rod
5 ice cubes
1 cup of salt
1 pan balance, triple-beam balance, or digital balance 5
1 ring stand with ring and wire screen
1 heat source, e.g. Bunsen burner, hot plate, alcohol lamp
1 igniter for Bunsen burner or matches for alcohol lamp
Salt solutions. A saturated salt water solution can be prepared for the whole class by dissolving as much salt as possible in tap water at room temperature. Alternatively students can prepare their own salt solutions and compare the rate of flow of different concentrations of salt.
Cold water. Ice water can be prepared in a large bucket , with ladles or cups for the students to help themselves.
Warm water. The warm water should be cool enough so that students can comfortably put their hands into it. However, keep in mind that the greater the temperature difference between the ice water and the warm water, the more dramatic the convection effects. Warm tap water should be fine for this experiment. Insulated cups should be available for teams to keep the water warm during the activity.
On the following page is a sheet to hand out to the students describing the activity. The next page gives suggestions for leading discussions and extending the activity so it is quantitative.
What Drives the Global Conveyor Belt?
In this experiment you will observe what happens when two masses of water meet—with different temperatures and different salt concentrations. The results of your experiment will reveal the causes of ocean currents.
Part 1. Experimenting with warm and cold water
- Predict: What will happen when warm water is released at the bottom of a container of cold water? What will happen when cold water is released at the bottom of a container of warm water?
- Fill the large jar or beaker with cold water.
- Put a drop of food coloring into the narrow-neck bottle, then fill the bottle with warm water.
- Holding your finger over the end of the bottle, carefully lower the bottle into the jar or beaker of water, not letting any of the colored water escape. Position the bottle on its side with its mouth facing the center of the beaker. Remove your hand slowly, being careful not to disturb the water.
- Observe from the side, and draw what happens.
- Empty the containers and fill the large container with warm water and the small container with colored ice water.
- Release the cold water at the bottom of the container of warm water and draw what happens.
- Draw conclusions. What happens when masses of water of two different temperatures meet? Why does that occur? How can the results of your experiment explain what causes ocean currents?
Part 2. Experimenting with salty and fresh water
- Predict: What will happen when salty water is released at the bottom of a container of fresh water? What will happen when fresh water is released at the bottom of a container of salty water?
- Follow steps 2-8 in Part 1, but using salty and fresh water rather than warm and cold water.
- As before, see if you can explain why masses of salty and fresh water behave as they do, then use the results of your experiment to further explain the causes of ocean currents.
Suggestions for conducting the activity
- It’s best to demonstrate how to properly place the bottle in the bottom of the large jar or beaker, and how to remove your hand with minimal disturbance to the water. Use water of the same temperature or salinity so you don’t give away the final result.
- To increase interest and motivation, ask the students to share their predictions before handing out the equipment.
- Be sure the students rinse the bottles and beakers between experiments.
- Avoid getting ice in the bottles and beakers.
- When observing the hot water convection in cold water, students may need to wipe condensation off of the large beaker.
- The darker food colorings need fewer drops than the lighter ones.
Suggestions for discussing results
- It’s very important to allow time for discussion of results after each portion of the lab activity. If there is not time to discuss it that day, allow time the next day. Discussion should follow these steps:
- a. Have each team discuss what they did and what they observed. Compare with other teams to see if they agree or disagree.
- b. Invite students to explain their discoveries in terms of differences in density of salt vs. clear water, or warm vs. cold water.
- c. Ask students to relate their findings to the causes of ocean currents. Help them recognize that ocean currents are convection currents driven by differences in density.
- d. Use hints and questions to help them figure out what drives the Global Conveyor Belt as described in the “Background” section at the beginning of this activity.
- Discuss the importance of the global conveyor belt ocean current, how it may be changed if the Earth’s climate changes, and how changes in ocean currents may, in turn, further affect the Earth’s climate.
Suggestions for a quantitative activity
- Have the students create solutions with different concentrations of salt and different temperatures, and to compare flow rates.
- Flow rate can be measured by using a stop watch to measure how long it takes the plume of colored water to leave the bottle and reach a certain point in the large jar. Measure this distance in centimeters and calculate the flow rate in centimeters per second.
Further extensions
- Have students conduct library research and prepare a report, comparing the temperatures of different locations in the world oceans and possible reasons for the differences.
- Have students measure the temperature in a swimming pool at 30-cm depth intervals, and graph the data. How do the results compare with ocean temperatures at increasing depths?
- Set up a large aquarium and place a heating lamp over the tank. Measure the temperature at 10-cm depth intervals. How do the results of compare with students’ predictions?
Assessment ideas
- Have students map concepts involved in this activity
- Ask the students to invent a story about what occurs to a drop of water as it flows through the world’s oceans.
- Have students write about effects that humans might have on ocean currents, what that might mean for future generations, and how those effects might be avoided by what we do today.
Extra challenges
Have students research these questions….
- What causes changes in salinity of the ocean?
The rate of evaporation (affected by air temperature, humidity, and wind)?
The amount of rain falling on the ocean?
The amount of freshwater added by streams and rivers?
The amount of salt in solution in rivers and streams emptying into the ocean?
The amount of salt added by underwater volcanoes and vents?
The temperature of the ocean water? - What happens when a large river flows into the ocean, or when it rains?
Fresh water will “float” on the denser salt water, forming a layer of fresh water on top of the ocean water. Eventually turbulence will mix the water, so the ocean becomes less salty. - Use data from your quantitative experiments to calculate how long it will take cold dense water to flow from Iceland to the equator.
From classroom experiments, the flow rate of cold water at 4°C in warm water 20°C is about 0.1 cm/s. This converts to about 1 km/11.57 days. To go 5000 km (the distance from Iceland to the equator) would take 11,570 days or 315 years. This is the right order of magnitude since deep water takes approximately 1000 years to circulate once around the globe.
References
Broecker, Wallace S., “Chaotic Climate,” Scientific American, pages 62-68, November, 1995.
Bernstein, Leonard, et. al., Environmental Science, New York: Addison Wesley, 1995.
TG-CC7-2. Investigation: How Does Ocean Temperature Affect Absorption of CO2?
by Donna Morey, Fair High School, Little Rock, AK
Glenda Pepin, Dorsey High School, Los Angeles, CA
and Eloise Farmer, Torrington High School, Torrington, CT
Absorption in plants is one way that carbon dioxide is removed from the atmosphere. Another is the ocean. Like a bottle of sparkling soda pop, the ocean contains dissolved carbon dioxide. If it were not for the ocean, the Earth would be a much warmer place! However, as your students will discover in this activity, the ocean’s capacity to dissolve carbon dioxide depends on its temperature. This has important implications for the future of our planet.
Before class, prepare a gallon of BTB solution by adding concentrated BTB to a gallon of water until it is a rich but transparent blue. Put about a third of it into a refrigerator overnight so it cools, and put about a third of it into a microwave oven, or on a hot plate just before class so it is at the temperature of hot tap water. Keep about a third at room temperature. Have these available with pitchers or labels so students can fill their beakers.
Materials for each team
2 Alka Seltzer™ tablets
3 containers (250 ml beakers)
1 dropper bottle of dilute (1:25) household ammonia
3 large test tubes (25 mm x 100 mm)
1 ice cube
1 hot plate
Procedure
Demonstrate the following steps:
- Label the three 250 ml beakers: A, B, C. Mark the three test tubes in the same way.
- Demonstrate how to pour 200 ml BTB solution into each beaker. The hot BTB goes in beaker A, the cold BTB goes in beaker B, and the room temperature BTB goes into beaker C.
- Ask the students to predict what will occur if you drop an Alka Seltzer™ tablet into beakers A and B.
- Have the students set up their beakers, and go ahead and drop the tablets into the two beakers, observe what happens, and record their observations.
- Now ask the students if they think there will be a difference in acidity between containers A and B? If so, which will be more acidic? Which more basic ?
- Have the students test their predictions by pouring 10 ml solution from each of the beakers into the test tubes with the same letters. They should add household ammonia, drop by drop, to test-tubes A and B only, and to keep a record of the number of drops needed to change the liquids to the same color as that in the control tube C. Tell them to swirl the tubes gently between drops to mix the ammonia into solution, and to record your observations of the number of drops ammonia added to each tube.
Discussion questions
- Why was it necessary to use the same amount of Alka Seltzer for each test beaker ?
- What can you conclude about the relationship between the water temperature difference and the solubility of carbon dioxide in water?
- On the basis of what you have observed during this experiment, if the Earth’s climate warms because of additional carbon dioxide in the atmosphere, what will happen to the ability of the oceans to absorb carbon dioxide?
- How do you think the warming of ocean water will affect the global climate?
- Is this a feedback effect? If so, is it positive or negative feedback?
TG-CC7-3. Investigation:
The Next Great Super Hero
by John Stegmaier, Gunnison High School, Gunnison, CO
Overview
One of the positive scenarios for a warmer world is that plants will grow better. If that is so, will carbon dioxide be the next great superhero and feed our growing population? Possibly; and possibly not. In this activity, students grow plants in atmospheres with different concentrations of Carbon Dioxide, and then test the plants for evidence of photosynthesis. With this experiential background, they learn about the more complex findings of professional scientists concerning plant growth in atmospheres enriched in carbon dioxide.
Background
We suggest that you present the following information to your students after they have completed their experiments.
Plants use carbon dioxide molecules for photosynthesis. They extract carbon atoms for building plant tissues, and release the oxygen into the air. If the atmosphere grows richer in carbon dioxide, it makes sense to predict that plants would grow faster than they do now. A great many studies have supported this prediction, and suggest that if farmers choose their crops carefully, they could increase yields. This has become known as “carbon dioxide fertilization.” Another interesting finding of this research is that some plants also become more drought-resistant under carbon dioxide fertilization since they do not need to keep their stomata (pores) open as much to draw in carbon dioxide, so they lose less water.
However, the implications of the studies are not all positive. Plants respond differently to increased levels of carbon dioxide, and scientists have classified them into two groups based on the number of carbon atoms in the compound that is synthesized during the early steps of photosynthesis. The groups are called C3 (including wheat, barley, oats, soybeans, sunflowers, rice, and alfalfa) and C4 (including corn, sugar cane, sorghum, and millet.) Most trees are C3, but many tropical plants are C4 Recent studies suggest that C3 plants might respond better to carbon dioxide fertilization than C4 plants. That is why forested areas are expected to undergo change with increasing carbon dioxide, as some trees and shrubs thrive at the expense of others.
Growing the Plants
Professional scientists generally produce carbon dioxide rich atmospheres by enclosing plants in perforated plastic envelopes, and allowing carbon dioxide to leak into the enclosure slowly from gas tanks. Such tanks with pressure regulators are available for rent in most communities from companies that produce compressed air for commercial applications. You might be able to obtain the assistance of a large company in your community that uses such equipment by borrowing one of their tanks for a couple of weeks, and possibly get help setting it up and using it in your classroom.
An alternative approach was developed by John Stegmeir in the GSS Summer Institute. It consists of a large tub of water with several styrofoam “rafts” cut to fit a plant pot. (One raft is made for the class, and student teams are assigned to test leaves from the various plants.) Into each raft is placed a small potted plant (coleus or geranium are recommended, but it is important that all plants are identical in variety and color). Some vegetable oil is poured into the water to create a film which will prevent carbon dioxide from being absorbed by the water.
Over each raft is placed a “bell jar” made from the top half of a 2-liter soda bottle. The open top of each bell jar (where the cap was screwed on) can be sealed off with a plastic bag and twist tie, which can later be used to sample the gas in the jar. Each bell jar is pushed down over the raft and into the water to seal in the atmosphere.
The rafts need to be larger than the plants. In the simplest case, you will need three rafts and four plants. One plant will have a candle placed on the raft next to it, inside the bell jar. The candle will be lit before placing the jar over it, and allowed to burn out. The atmosphere should then have less oxygen in it and more carbon dioxide. A second raft will have a shallow hole dug into it with a solid chunk of KOH, which absorbs carbon dioxide. This should provide an atmosphere poor in carbon dioxide. One raft will just have a plant in a normal atmosphere. Place the tub in a window that receives direct sunlight. A cardboard frame can be placed over the tub, with circular cut-outs to hold the domes in place, and expose all plants equally to sunlight. A fourth plant will be placed in a closet with adequate water, but no light.
Testing for Starch
The presence of starch is an indication that photosynthesis is taking place. After two or three days, some differences might be noticed in the starch content of the various plants. Ask the students for their predictions. If they understand that photosynthesis produces starch (among other substances) and that plants need both sunlight and carbon dioxide for photosynthesis to occur, they will probably predict that:
- The plant in the dark will probably produce no starch because it has no light.
- The plant with KOH and a carbon dioxide poor atmosphere will produce little or no starch.
- The plant in room air and full sunlight will produce starch.
- The plant with the candle and a carbon dioxide rich atmosphere will produce the most starch.
Conduct starch tests as follows:
- Pull leaves off of top (growing) portions of the plants
- Boil the leaves in a beaker for one minute
- Heat (not boil) leaves in alcohol 2 minutes
- Lay in a 25% solution of Iodine for 1 minute
- Lay flat on a paper towel and look for black lines which indicate starch production
Student groups can be assigned to test leaves of different plants and then compare with the results of the other teams to test their hypotheses. It is also possible to test the atmospheres inside the bell jars for carbon dioxide using BTB as indicated in the steps on pages 35 of this Teacher’s Guide.
Discussion
Have each lab group report their results. Focus the discussion to draw general conclusions from the combined data, with questions such as:
- Did the plant in the dark produce no starch? How do you know? If not, why not? (Probably not. No light, no photosynthesis, no starch.)
- Did the plant with KOH and a carbon dioxide poor atmosphere produce starch? (Probably very little, because without carbon dioxide it cannot photosynthesize.)
- Did the plant in room air and full sunlight produce starch? (It probably did because it photosynthesized normally.)
- Did the plant with the candle and a carbon dioxide rich atmosphere produce the most starch? (It is possible that it did produce more starch because photosynthesis was able to proceed more rapidly. However, it had to have enough oxygen for respiration. Production is starch is difficult to predict, which is all the more reason to do the experiment and find out!)
References
Ennis, Christine A. and Marcus, Nancy H., Biological Consequences of Global Climate Change, Global Change Instruction Program, University Corporation for Atmospheric Research, 1994.
Morholt, E., Brandwein, P., and Joseph, A., A Sourcebook for the Biological Sciences, 2nd Edition, Harcourt, Brace and World, 1966.
Idso, Sherwood B., and Kimball, Bruce A., “Doubling CO2 Triples Growth Rate of Sour Orange Trees,” DOE Research Summary, Carbon Dioxide Information Analysis Center, Oak Ridge National Laboratory, Oak Ridge, TN, December, 1991.
Policy Implications Of Greenhouse Warming: Mitigation, Adaptation, and Science Base, Washington, D.C., National Academy Press, 1993.
Overview [] Planning [] Objectives [] Assessment [] Resources
Guides for each Chapter: 1 – 2 – 3– 4 – 5 – 6 – 7 – 8 – 9 – 10
Index of Investigations
Guide for Chapter 8:
What Are the Consequences of Global Warming?
“Evidence” of effects from global warming is often described in unscientific ways. Encourage students to think critically about statements that such-and-such is evidence of global warming. There is also a distinction between saying that some phenomenon is evidence and saying that it is caused by global warming. Causation is a much stronger statement and harder to prove.
8-I: These pages describe the predictions of the IPCC regarding changes that are likely to occur when the carbon dioxide concentration doubles. These predictions answer the question, “What’s the fuss all about?”
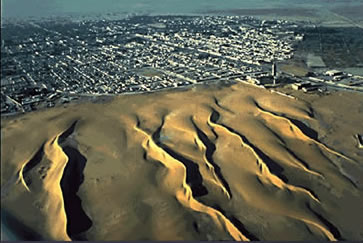
We urge you to emphasize to your students that 1) These predictions are not absolutely certain to occur; but are the best guess of a large number of scientists working together; and 2) If the predictions come true, many of the most serious changes will not occur this week, or this year—but by the end of this century. By then your students will be very old or no longer alive; but their children and grandchildren will live through this period.
You may want to have individuals or small groups create stories about “A day in the life of….” in which the subject of the story is a person who will live near the end of this century. The stories could illustrate two alternative futures: one in which fossil fuel use continues and these predictions come true; the other showing how the world might be different if conservation and alternate sources of energy are developed which will reduce the buildup of greenhouse gases in the atmosphere.
The idea that global warming will not directly cause the changes listed on these pages but will make them more likely to occur is a subtle point. Stephen Schneider’s analogy of traffic jams (in the Animal Behavior section) is intended to communicate this idea. In his analogy, more cars on the road do not directly cause accidents, but they make accidents more likely.
You might want to spark some lively discussion that turns on this issue of indirect causation. Either as a small group task, or in a large group, ask your students to imagine that someone lost a loved one—a child, spouse, or parent—due to an auto accident that occurred during rush hour. The drivers of both cars were killed. In her anguish, she decided to sue the Department of Motor Vehicles. At the trial, her lawyer argued that if the Department of Motor Vehicles had not allowed so many cars to travel on the road, the accident would never have occurred.
After the students’ discussion, ask them to apply their insights to the issue of global warming. Suppose the Earth warms up by 3°C, and an entire island is inundated by storm surge. From the viewpoint of the survivors, what caused the loss? Was it the storm? Global warming? The actions of people from the previous century who contributed carbon dioxide to the atmosphere?
At the end of this chapter is the question “What would you do?” Emphasize that knowledge about indirect causation can help to prevent problems before they occur. For example, many large cities have constructed subways and trains so commuters can park their cars outside of the city and still make it to the office on time. That reduces the chances of auto accidents and reduces air pollution. However, such systems are very expensive to build, and require buildings to be torn down to make way for the rails. Cities have agonized for years before deciding to build such systems.
In a similar way, world leaders are currently deciding what actions to take to slow the buildup of greenhouse gases in the atmosphere. Because many questions about global warming are still unanswered, they do not know whether to take strong actions, moderate actions, or no actions at all. Tell the students that you will return to these questions later on, after exploring the science behind the theory of global warming.
Overview [] Planning [] Objectives [] Assessment [] Resources
Guides for each Chapter: 1 – 2 – 3– 4 – 5 – 6 – 7 – 8 – 9 – 10
Index of Investigations
Guide for Chapter 9:
What Are Governments Doing About Global Warming?
9-I introduces the questions about the role of governments and remind students of the context of the formation of the IPCC as an international group formed to helped address the problem of climate change which affects everyone.
9-II has Investigation 9.1 as a key part which includes excerpts from a Congressional hearing on President Clinton’s plan to reduce the U.S. Contribution to global warming. The dialogue lends itself to a dramatic presentation rather than just having the students read the material on their own. Assign roles and have the students read the various parts with feeling. If you like, they can dress up for the presentations, and the room can be arranged as in a committee hearing, with an elevated table for the members of Congress, and a lower table facing them for the witnesses.
The excerpts were selected for several reasons. In addition to providing information on the President’s Action Plan, they also deal with common misconceptions. For example, the question asked by Congressman Minge provides a wonderful opportunity for Dr. Mahlman to clarify the theory that we are headed for another ice age. (As he says, we are headed for another ice age, but that is thousands of years in the future. Global cooling due to the Earth’s slowly changing orbit will not help us in the next couple of centuries.)
Question 9.1.1 is designed to help the students think further about the hearing. Alternatively—or in addition—you may want to have a class discussion so students can express their reactions to the Investigation . Alternatively, or in addition, a good focus for discussion is the information provided in 9 – VI. Back to the United States, which shows that all of our nation’s best efforts to reduce the emission of greenhouse gases undertaken so far are being swamped because of the changing tastes of American auto consumers. Most of these people are probably unaware of how their choice of a new car, or their decision to take a summer camping trip may affect the future climate of the Earth. What do the students think about this? Should anything be done? If so, what?
For more advanced groups, you may want to get recent transcripts of hearings relevant to climate change, for students to analyze or even to dramatize. Recent hearings may be found on congressional websites, e.g. https://science.house.gov/hearings which has filters for selecting an issue (climate change) as well as month and year.
In addition to the dialogue are prepared papers by all of the witnesses. Groups of students could be assigned to read these and report to the class.
9-III and 9-IV move the international realm with Earth Summits, and Kyoto Protocol, and international meetings since 2000. This is an area where “Staying Up To Date” is a good idea. Check the GSS “Staying Up To Date” area of the website for latest news.
9-V and 9-VI brings the circle back around to national and local issues, to drive home the point that global problems may need to be addressed with help from all levels of government, from local to international.
Overview [] Planning [] Objectives [] Assessment [] Resources
Guides for each Chapter: 1 – 2 – 3– 4 – 5 – 6 – 7 – 8 – 9 – 10
Index of Investigations
Guide for Chapter 10:
What Do YOU Think About Global Climate Change?
You might want to break the class into groups of 3-4 students to read over the next few sections, answer questions in 10.1-10.2 and come to consensus about the level of action they think is necessary, on a scale of 1 to 5. You may also want to make the assignment more involved, asking each group to propose a set of actions that they think should be taken that is consistent with their position about the possibility of global warming.
If possible, permit the entire class to discuss questions such as the following:
- Are one or more of the plans presented acceptable to everyone?
- If not, could different parts of the plans be put together so it could be enacted by the entire “Congress?”
The Final Essay (Personal Opinion) recognizes that individual thoughts and ideas may not have been expressed during the group discussions. The essay asks students to provide an informed personal opinion about the possibility of global warming. This might be considered a final project, and included in the students’ portfolios as part of their assessment; and as data in evaluating the effectiveness of the module on Climate Change.
In this book we have adopted the Celsius scale, because it is the one preferred by scientists. The Celsius and Fahrenheit Temperature Scale in 10 – VII shows students how to convert from one scale to the other.
Note: the Bibliography under the Resources section of this site provides some of the books and articles that we found helpful in creating this Student Guide. However, they are very dated, mostly from the 1990s. The most recent materials and resources may be found in the Staying Up To Date area of the GSS website.
Optional Video: Ending the Silence on Climate Change
January 4. Bill Moyers interviews scientist Anthony Leiserowitz, director of the Yale Project on Climate Change Communication, who specializes in the psychology of risk perception, and if/how people are willing to change their behavior to make a difference. “[A] pervasive sense up to now has been that climate change is distant — distant in time, and distant in space,” Leiserowitz tells Bill. “And what we’re now beginning to see is that it’s not so distant. It’s not just future generations. It’s us and it’s our own children. I have a nine-year-old son — he’s going to be my age in the year 2050. I don’t want him to live in the world that we’re currently hurtling towards.”
Source: http://billmoyers.com/segment/anthony-leiserowitz-on-making-people-care-about-climate-change/ or on vimeo.
Overview [] Planning [] Objectives [] Assessment [] Resources
Guides for each Chapter: 1 – 2 – 3– 4 – 5 – 6 – 7 – 8 – 9 – 10
Index of Investigations
Index: Climate Change Teacher Guide Investigations:
- TG-CC2-1. Investigation: Observing Carbon Dioxide Gas
- TG-CC2-2. Resonance Activity Modifications
- TG-CC3-1. Calculation: How Much CO2 from a Gallon of Gas?
- TG-CC3-2. A Comparative Study of Common Atmospheric Gases
- TG-CC3-3. Measuring the Heat Capacity of Greenhouse Gases
- TG-CC3-4. A Teacher Challenge; Heat Absorption by Greenhouse
- TG-CC3-5. Will Melting Ice Caps Increase Global Warming?
- TG-CC5-1. Observing Carbon Dioxide Gas
- TG-CC5-2. The Balance of Carbon Dioxide in the Atmosphere
- TG-CC7-1. What Drives the Global Conveyor Belt?
- TG-CC7-2. How Does Ocean Temperature Affect CO2 Absorption?
- TG-CC7-3. The Next Great Super Hero
Overview [] Planning [] Objectives [] Assessment [] Resources
Guides for each Chapter: 1 – 2 – 3– 4 – 5 – 6 – 7 – 8 – 9 – 10
Index of Investigations
Resources
Activities Related to Climate Change
[from 1990s initial work on GSS; for more recent references,
see Staying Current of Climate Change]
by Linda Baker, Davis Senior High School, Davis, CA
Sue Green, Miami Beach Senior High School, Miami Beach, FL
Marjorie Knights, Miami Douglas Macarthur High School, Hialeah, FL
Robbie Robinette, North Caroline High School, Ridgly, MD
The following activities were selected from a large number of published resources for teachers concerning global environmental change. Criteria for selection were that they promote student inquiry, and that they help to illuminate one or more of the concepts presented in Climate Change. They are listed below according to the chapter in Climate Change to which they are most closely related.
Activities Related to Chapter 1 What Is Global Warming?
“Volcanic Eruptions and Global Climate Change,” is an activity from the Global Change Education Resource Guide by Lynn l. Martensen. In this activity, students locate major volcanoes and predict how a major volcanic eruption might change the global climate. They investigate the effect of acid precipitation from volcanoes on different types of rocks, and examine the influence of wind currents on aerosol distribution.
The Global Change Education Resource Guide is organized by topic: Natural Climate Variability, Greenhouse Effect, Sea-Level Rise, Ozone Depletion, Ecosystem Response, and Decision-Making Under Scientific Uncertainty. Each topic includes fact sheets, articles, learning activities, color overhead transparencies and duplicate slides. Global Change Education Resource Guide by Lynn L. Martensen, Office of Global Programs, NOAA, 1100 Wayne Ave. Suite 1225, Silver Spring, MD 20910.
“Air Pollution Discovery: A Scavenger Hunt” is a gold mine activity. It must be done as a team activity and is easily adapted for all ability levels. This is a typical Zephyr Press lab activity encouraging students to approach problems from many angles. It is creative and lists 30 items to collect and/or create to learn about the sources of air pollution in our environment. There is also an easy-to-follow evaluation sheet.
Our Troubled Skies , Zephyr Press, Tucson, Arizona.
Activities Related to Chapter 2 What Is the Controversy About?
In the fun activity “Worldwide Effects of Climate Change” students construct an “effects wheel” to help them consider a wide range of impacts that might result from global warming. By filling out their wheel, students begin to see the “chain reaction” that result as one environmental change begins to affect many others. Global Warming, and the Greenhouse Effect, 1990, a GEMS guide from the Lawrence Hall of Science, U.C. Berkeley, CA 94720-5200.
Activities Related to Chapter 3 What’s So Special About CO2?
In the activity “Modeling the Greenhouse Effect” students perform an experiment to learn about the greenhouse effect. By constructing a physical model of the atmosphere using familiar materials, students learn that air trapped in a container will heat up more than air in a open container, when both are exposed to the same amount of energy from a light bulb. In addition to building and testing their own model, students practice collecting and recording data, graphing and interpreting results. In the subsequent activity, “The Global Warming Game,” students find out how the greenhouse effect works at a molecular level.
Global Warming, and the Greenhouse Effect, 1990, a GEMS guide from the Lawrence Hall of Science, U.C. Berkeley, CA 94720-5200.
Activities Related to Chapter 5 Is the Atmosphere Really Changing?
“Using Statistics to Analyze Climate Data,” is an activity described in the Environmental Research Laboratories/Forecast Systems Laboratory Publication, NOAA. The students plot temperature data from Denver, Colorado that were collected during the months of July, 1991 and January, 1992, the warmest and coldest months of the year. They use the data to answer a series of questions that help them understand the relationship between weather and climate. The activity can be made much more relevant and exciting for your students if you can obtain weather data for your locale from the local weather bureau, or set up a weather station at your own school. Environmental Research Laboratories/Forecast Systems Laboratory Publication, Office of Global Programs, National Oceanic and Atmospheric Administration, 1100 Wayne Ave., Suite 1225, Silver Spring, MD 20910.
Activities for the Changing Earth System (ACES) provides a variety of excellent activities for teaching about global environmental change. In one set of activities, students plot the average temperature of certain regions of the United States over the last few decades, drawing data from Trends ‘90, a compendium of data on global climate change available free from government sources and on the World Wide Web. The compare their findings with the predictions of the theory of global warming and the greenhouse effect. They go on to graph the concentration of carbon dioxide in the atmosphere from ice cores and other sources of data, and compare their plots with climate change data. Activities for the Changing Earth System, 1993, by Rosanne W. Fortner and Victor J. Mayer, Project Directors, Earth Systems Education Program, Ohio State University, 59 West Woodruff Ave., Columbus, OH 43210.
Trends ‘90 and Trends ‘93, A Compendium of Data on Global Change, available from the Carbon Dioxide Information Analysis Center (CDIAC), Oak Ridge National Laboratory, Oak Ridge, Tennessee 37831.
Activities Related to Chapter 8 What Is the U.S. Government Doing?
“Environmental Heroes and Heroines: An Instructional Unit in Earth Values and Ethics,” by Clifford E. Knapp is a three-lesson unit designed to encourage teachers to involve their students in the study of the values and actions of environmental heroes and heroines in order to help them develop their own Earth ethic. It was selected for inclusion in the section entitled “Decision-Making Under Scientific Uncertainty,” in the Global Change Education Resource Guide.
Global Change Education Resource Guide
by Lynn L. Martensen, Office of Global Programs, NOAA, 1100 Wayne Ave. Suite 1225, Silver Spring, MD 20910.
Global Systems Science Climate Change Teacher’s Guide
“Additional Resources for teaching Climate Change” are listed at the end of this resource guide, followed by a complete listing of all of the books, articles, and other resource
Bibliography
- Adler, Jerry, with Hager, Mary, “Inside the Greenhouse: Heat Waves,” Newsweek, pp. 16-24, July 11, 1988.
- Aubrecht, Gordon J., “Trace Gases, CO2, Climate and the Greenhouse Effect,” The Physics Teacher, March, 1988.
- Beiswenger, Jane M., and Brewer, Carol A., “Predicting Biological Response to Global Warming: A Laboratory Activity to Promote Discussion,” The American Biology Teacher, Volume 55, No. 4, April, 1993.
- Berner, R.A. and Lasaga, A.C., “Modeling the Geochemical Carbon Cycle,” Scientific American, March, 1989.
- Boden, Thomas A, Sepanski, Robert J., and Stoss, Frederick W., Trends ‘91: A Compendium of Data on Global Change, Carbon Dioxide Information Analysis Center, Environmental Sciences Division, Oak Ridge National Laboratory, Oak Ridge, Tennessee, 1992.
- Boden, Thomas A.,. Kanciruk, Paul, and Farrell, Michael P., Trends ‘90: A Compendium of Data on Global Change, Carbon Dioxide Information Analysis Center, Environmental Sciences Division, Oak Ridge National Laboratory, Oak Ridge, Tennessee, 1991.
- Brewer, Carol A., and Briswenger, Jane M., “Carbon Dioxide and the Greenhouse Effect: A Problem Evaluation Activity, The American Biology Teacher, Volume 55, No. 4, April, 1993.
- Brown, Lester R., Building a Sustainable Society, W.W. Norton & Co.: New York,
- London, 1981.
- Brown, Lester R., State of the World, 1994, W.W. Norton & Co.: New York, London, 1994.
- Carr, Kate, Managing Editor, Science Activities Special Issue on “Understanding Global Atmosphere in the Classroom,” Vol. 29, No. 1, Spring, 1992.
- Clark, William C., Editor, Carbon Dioxide Review: 1982, Clarenden Press: Oxford, Oxford University Press: Oxford, New York, 1982.
- Climate Institute, Climate Alert, Newsletter, Washington, D.C., 1991.
- Climate Protection Institute, Greenhouse Gassette, Quarterly Newsletter, Oakland, CA, 1988-1994.
- Committee on the Atmosphere and Biosphere, Board on Agriculture and Renewable Resources, Commission on Natural Resources, National Research Council, Atmosphere-Biosphere Interactions: Toward a Better Understanding of the Ecological Consequences of Fossil Fuel Combustion, National Academy Press: Washington, D.C., 1981.
- Copnservation Council of Victoria, “State Gives Up on the Greenhouse Challenge,” Environment Victoria, Issue 73, October, 1989.
- Davis, Gil, Greenhouse California, Golden State Report, ppl. 24-31, March, 1987.
- Earth Observing System, Program Office, EOS: A Mission to Planet Earth, National Aeronautics and Space Administration, Washington, D.C., 1990.
- Earth System Science Committee, NASA Advisory Council, Earth System Science: Overview, National Aeronautics and Space Administration, Washington, D.C., 1986.
- Ember, Lois R., Layman, Patricia, Lepkowski, Wil, Zurer, Pamela S., Tending the Global Commons, Chemical and Engineering News, pp. 14-64, November, 1986.
- GISP2 Science Management Office, Greenland Ice Sheet Project Two, GISP2 Contribution Series, lists research articles, University of New Hampshire, Durham, NY, Spring, 1993.
- Golden, Richard, and Sneider, Cary, “The Greenhouse Effect in a Vial,” The Science Teacher, May, 1989.
- Gribbin, John, “The Oceanic Key to Climatic Change,” New Scientist, May 19, 1988.
- Gribbin, John, Future Weather and the Greenhouse Effect, Delta, Dell Publishing, Co., New York, 1982.
- Gross, M. Grant, Oceanography: A View of the Earth, 5th Edition, Prentice-Hall: Englewood Cliffs, New Jersey, 1990.
- Hammond, Allen L., Editor in Chief, World Resources: 1990-91, The World Resources Institute, in collaboration with The United Nationsl Environment Programme and The United Nations Development Programme, Oxford University Press: Oxford, NY, 1990.
- Hammond, Allen L., Editor in Chief, World Resources: 1992-93, The World Resources Institute, in collaboration with The United Nationsl Environment Programme and The United Nations Development Programme, Oxford University Press: Oxford, New York, 1990.
- Hansen, James and Lebedeff, Sergej, “Global Surface Air Temperatures: Update Through 1987, Geophysical Research Letters, Vol. 15, no. 4, pages 323-326, April, 1988.
- Hicks, Craig, “Global Problems Demand a National Commitment, National Research Council, News Report, Vol. XLIII, No. 3, page 13.
- Houghton, R.A., and Woodwell, G.M., “Global Climate Change,” Scientific American, April, 1989.
- Jager, Jill, Climatic Change: Floating New Evidence in the CO2 Debate,” Environment, Vol. 28, No. 7, pp. 6-41, September, 1986.
- Jones, Philip D., and Wigley, M.L.,“Global Warming Trends,” Scientific American, August, 1990.
- Kasting, James F., Toon, Owen B., and Pollack, James, “How Climate Evolved on the Terrestrial Planets,” Scientific American Vol. 258, No. 2, pp. 90-97, February, 1988.
- Kerr, R., “How to Fix the Clouds in Greenhouse Models,” Science, January 6, 1989.
- Kerr, Richard A., “Linking Earth, Ocean, and Air at the AGU,” Research News, pg. 259-260, January 15, 1988.
- Kerr, Richard, “Is the Greenhouse Here?” Research News, pp. 559-561, February 5, 1988.
- Knox, Joseph, Chair, Research Needs and Recommendations: Global Climate Change and Its Effects on California, National Institute for Global Environmental Change, University of California at Davis, 1989.
- Kornberg, Warren, Editor, Global Change, a Mosaic Double Issue, Vol. 19, No. 3/4, National Science Foundation, Washington, D.C., Fall/Winter, 1988.
- LaMacchia, Diane, “A Climate of Uncertainty,” LBL Research Review, Summer, 1992.
- Lean, Geoffrey, Hinrichsen, Don, and Markham, Adam, World Wildlife Fund, Atlas of the Environment, Prentice Hall Press: New York, London, Toronto, Sydney, Tokyo, Singapore, 1990.
- Leggett, Jeremy, Editor, Global Warming: The Greenpeace Report, Oxford University Press: Oxford, New York.
- Lemonick, Michael D., and Nash, Madeleine J., “The Heat Is On,” Time, October 19, 1987.
- Leutwyler, Kristin, “No Global Warming?” Scientific American, page 24, February, 1994.
- Ludlum, David M., The Climythology of America, Weatherwise, pp. 255-259, October, 1987.
- Lyman, Francesca, with Mintzer, Irving, Courrier, Kathleen, and Mackenzie, James, The Greenhouse Trap: What We’re Doing to the Atmosphere and How We Can Slow Global Warming, Beacon Press: Boston, 1990.
- Maranto, Gina, “Are We Close to the Road’s End?” Discover, pp. 28-50, January, 1986.
- Monastersky, R., “Climate Still Reeling from Pinatubo Blast,” Science News, Vol. 145, page 70, January 29, 1994.
- Monastersky, Richard, “The $1.5 Billion Question: Can the U.S. Global Change Research Program Deliver on its Promises?” Science News, Vol. 144, September 4, 1993, page 158.
- Monastersky, Richard, “Global Change: The Scientific Challenge, Science News, April 15, 1989.
- Monastersky, Richard, “Looking for Mr. Greenhouse,” Science News, April 8, 1989.
- Monastersky, Richard, “Has the Greenhouse Taken Effect? Science News, Vol. 133, page 282, April 30, 1988.
- Myers, Norman, “The Heat Is On,” Greenpeace, Vol. 14, No. 3, pp. 8-13, May/June, 1989.
- National Institute for Global Environmental Change, Annual Report to the U.S. Department of Energy, 1990, University of California, Davis, CA, 1991.
- National Institute for Global Environmental Change, Annual Report to the U.S. Department of Energy, 1991, University of California, Davis, CA, 1992.
- National Center for Atmospheric Research, Annual Report, 1990, Boulder, CO, June 1991.
- National Geographic, “Is Our World Warming?” National Geographic Society: Washington, D.C., October, 1990.
- Nelson, Burton D., Aron, Robert H., and Francek, Mark A., “Clarification of Selected Misconceptions in Physical Geography,” Journal of Geography, March/April, 1992.
- New Scientist, “Warm Oceans Dissolve the Greenhouse Effect,” June 25, 19
87. - Office for Interdisciplinary Earth Studies, Earthquest, Quarterly Newsletter, University Corporation for Atmospheric Research (UCAR), Boulder, CO, 1991, 1992.
- Office of Energy Research, United States Department of Energy, Atmospheric Carbon Dioxide and The Greenhouse Effect, Available from the National Technical Information Service, U.S. Department of Commerce, Springfield, VA 22161, May, 1989.
- Paden, Mary E., Managing Editor, World Resources: 1988-89, The World Resources Institute, in collaboration with The United Nationsl Environment Programme and The United Nations Development Programme, Basic Books, Inc.: New York.
- Panel on Policy Implications of Greenhouse Warming, Committee on Science, Engineering, and Public Policy, National Academy of Sciences, Policy Implications of Greenhouse Warming: Mitigation, Adaptation, and the Science Base, National Academy Press: Washington, D.C., 1992.
- Penner, J.E., et. al., “Quantifying and Minimizing Uncertainty of Climate Forcing by Anthropogenic Aerosols,” U.S. Department of Energy, Office of Energy Research, Environmental Sciences Division, Washington, D.C., 1993.
- Perry, John S., “Climatic Change: Setting Serious About Climatic Change,” Environment, Vol. 27, No. 10, pp. 2-3, December, 1985.
- Pitt, David E., “Computer Vision of Global Warming: Hardest on Have-Nots,” New York Times, pg. B5, January 18, 1994.
- Postel, Sandra, Worldwatch Paper 71, Alterning the Earth’s Chemistry: Assessing the Risks, Worldwatch Institute, 1986.
- Ramanathan, et. al., “Cloud-Radiative Forcing and Climate, Science, January 6, 1989.
- Sagan, Carl, “The Warming of the World,” Parade, February 3, 1985.
- Samz, Jane, “Keeping the Chill Off,” Science World, March 25, 1988.
- Schneider, Stephen H., and Londer, Randi, Coevolution of Climate and Life, Sierra Club Books: San Francisco, 1984.
- Schneider, Stephen H., “The Global Warming Debate Heats Up: An Analysis and Perspective.
- Schneider, Stephen H., Global Warming: Are We Entering the Greenhouse Century? Sierra Club Books: San Francisco, 1989.
- Schneider, Stephen H., The Genesis Strategy: Climate and Global Survival, New York: Plenum Press, 1976.
- Science News, “Global Warming: Checking Out the Sun,” Science News, Vol. 140, December 7, 1991.
- Silver, Cheryl Simon, and DeFries, Ruth S., One Earth, One Future, National Academy Press: Washington, D.C., 1990.
- Smith, Emily T., and Bluestone, Mimi, “The Global Greenhouse Finally has Leaders Sweating,” Business Week, pp. 74-76, August 1, 1988.
- Stevens, William K., “Threat of Encroaching Deserts May be More Myth Than Fact,” New York Times, pg. B5, January 18, 1994.
- Stowe, Keith, Essentials of Ocean Science, John Wiley and Sons: New York, Chichester, Brisbane, Toronto, Singapore, 1987.
- Sundquist, Eric T., “The Global Carbon Dioxide Budget,” Science, Vol. 259, February 12, 1993.
- The Open University, Ocean Circulation, Pergamon Press: Oxford, New York, Beijing, Frankfurt, Sao Paolo, Sydney, Tokyo, Toronto, 1989.
- Titus, James G., “Greenhouse Effect, Sea Level Rise, and Barrier Islands: Case Study of Long Beach Island, New Jersey, Coastal Management, Vol. 18, pp. 65-90, 1990.
- Titus, James G., “Strategies for Adapting to the Greenhouse Effect,” APA Journal, pp. 311-323, Summer, 1990.
- Udall, James R., “Turning Down the Heat,” Sierra, pp. 26-40, July/August, 1989.
- Warrick, Bolin and Jager, Doos, Scope 29, The Greenhouse Effect, Climatic Change, and Ecosystems, John Wiley & Sons, Chichester, New York, Brisbane, Toronto, Singapore, 1986.
- White, Richard M., “The Great Climate Debate,” Scientific American, July, 1990.
- Williamson, Phillip, and Gribbin, John, “How Plankton Change the Climate,” New Scientist, March 16, 1991.
- Wright, W. Redwood, “Currents of the Sea,” Natural History, pages 31-37, August-September, 1976.
- Williams, A., “Control of Nitrogen Oxides,” Nature, Vol. 324, December 25, 1986.
Magazines and Newsletters
- Climate and Global Change Education Resource Guide, Office of Global Change, Graduate School of Oceanography, University of Rhode Island. Selected Annotated Bibliography put out by the University of Rhode Island.
- Earth Pulse, 100 East Francis, Aspen, Colorado 81611-1424, (303)925-7376. K-12 Newsletter with educational articles and lab activities on global climate. Interdisciplinary activities based on current happenings.
- In Context, A Journal of Hope, Sustainability, and Change, PO Box 11470, Bainbridge Island, WA 98110. This quarterly magazine is the best optimistic view of the future I’ve seen. It has many articles by leaders in science politics, futures studies, history, economics, psychology and history. Each issue has statistics that lend themselves to debate and encourages creative/alternative thinking. This is a journal you will not want to lose. I constantly use it in ALL my classes grades 9-12.
- PLESE Note…, Ohio State Univ., College of Education and Natural Resources, 29 W. Woodruff Ave., Columbus, OH 43210, 614-292-7888. A newsletter for the Program for Leadership in Earth Systems Education, a project of Ohio State University’s College of Education and Natural Resources. A newsletter for a group that is trying to increase the teaching of Earth Systems Science.
- The Greenhouse Gassette, Climate Protection Institute, 5833 Balmoral Dr., Oakland, CA 94619. Newsletter which contains information and activities for high school teachers interested in teaching about global environmental change. Published and edited by former staff members of the GSS project, Richard Golden and Chris Harper.
- OMNI magazine (June, 1993 “Air Repair”). Nice article the wild ideas proposed to mitigate global warming and ozone depletion through technical, geoengineering methods. Some of them are crazy, others feasible.
- Network Newsletter, NCAR, Environmental and Societal Impacts Group (ESIG), PO Box 3000, Boulder, CO 80307. An information clearing house newsletter on climate-related impacts to earth system and earth’s inhabitants.
Bibliographies
- Global Warming and the Greenhouse Effect, United States Department of Agriculture, National Agricultural Library, Beltsville, MD 20705. Select bibliography put out by the Department of Agriculture.
Educational Programs and Sets of Activities
- Activities for the Changing Earth System, 1993, by Rosanne W. Fortner and Victor J. Mayer, Project Directors, Earth Systems Education Program, Ohio State University, 59 West Woodruff Ave., Columbus, OH 43210. Contains a variety of activities concerning Earth systems and global environmental change.
- Global Change, from the U.S. Geological Survey, Department of the Interior. Call (800) USA-MAPS. This packet contains a large poster with several activities and a short teacher’s guide.
- Global Change Education Resource Guide, 1994, Lynn Mortensen, Editor, Office of Global Programs, National Oceanic and Atmospheric Administration, 1100 Wayne Avenue, Suite 1225, Silver Spring, Maryland 20910. This is a compilation of activities from many different sources, related to: Natural Climate Variability, the Greenhouse Effect, Sea Level Rise, and other topics.
- The Greenhouse Effect: Global Climate Change Curriculum Materials, Summer, 1990, Science Education Center, Lawrence Livermore National Laboratory, P.O. Box 808, Livermore, CA 94550, (415) 422-1100. This resources provides a variety of activities for students in grades 7-10 about global warming and the greenhouse effect. It is recommended that the program be presented over a period of 17 days.
- Project ATMOSPHERE, from AMS-Project ATMOSPHERE, 1701 K St., NW, Suite 300, Washington, DC 20006-1509. This program deals with cloud formation, and the meaning and motion involved in cloud shapes. Gives a “hands-on” use by students investigating temperature, pressure, and cloud formation relationships. Activities involving water vapor and its formation and importance in cloud formation.
- Project LEARN, from Project LEARN Office, NCAR, P.O. Box 3000, Boulder, CO 80307, (303) 497-8107
- This program seeks to improve understanding of the atmospheric sciences and related mathematics and to improve science teaching methodology through experiential training.
- Science for Understanding Tomorrow’s World: Global Change, 1994, from the International Council of Scientific Unions, 51 Boulevard de Montmorency, 75016 Paris, France. This looseleaf guide for teachers contains activities for students in the age range 16-20 years old. Six units are included: The Changing Atmosphere; Clues from Our Past, The Global Carbon Cycle, Population and Land Use, Oceans, and Remote Sensing.
- Solar Physics and Terrestrial Effects: A Curriculum Guide for Teachers Grades 7-12, Space Environment Laboratory, National Oceanic and Atmospheric Administration, U.S. Government Printing Office 1993—574-133. This looseleaf notebook provides a variety of activities related to the Sun and its relationship to the Earth. Chapters include: 1. How the Sun Came to Be, 2. The Structure of the Sun, 3. Studying the Sun, and 4. Solar-Terrestrial Interactions.
Print Material
- Biological Consequences of Global Climate Change, by Christine A. Ennis and Nancy H. Marcus, Global Change Instruction Program, NCAR Information and Outreach Program, P.O. Box 3000, Boulder, CO 80307-3000. This well-written monograph, suitable reading for teachers and high school students, shows how various life forms may be affected by changes in various aspects of climate, including global warming and ozone depletion.
- Climate System (The), National Center for Atmospheric Research (NCAR), Office for Interdisciplinary Earth Studies, PO Box 3000 Boulder, CO 80307-3000, 303-497-1682. Written for high school students. Great graphics and clear writing.Climate Change: The IPCC Scientific Assessment, Cambridge University Press, New York. This is THE “scientific consensus” about global warming and the greenhouse effect. It is full of all the details and figures you’ll ever want to know about climate change processes, effects, uncertainties, modelling, etc. Put together by a team of several hundred renowned scientists from around the world. A “Policymakers’ Summary” for this nicely summarizes the guts of the main volume extremely well. A new edition will be available in 1996.Environmental Data Report (United Nations Environment Programme, 1989), from Blackwell, Inc., Cambridge, MA. Graphs and data tables by continent and country for numerous trends in pollution, resources, population, health, energy, waste, transportation, and natural disasters.
- Global Change Education Technology Fact Sheets, School of Natural Resources, Ohio State University, 2021 Coffey Rd., Columbus, OH 43210, Attn: Dr. Rosanne W. Fortner, 614-292-2265; FAX: 614-292-7162. Produced jointly by the School of Natural Resources and the Department of Educational Studies at OSU. These sheets were used to find other resources in this guide. How to Build a Habitable Planet, by Wallace Broecker, Eldigio Press, LDGO Box 2, Palisades, NY 10964. An excellent book on the physical evolution of the solar system and the Earth. Much about the chemical evolution of the Earth, including the carbon cycle. A few chapters on Earth’s temperature controls, water systems, resources for civilization, and the future of the Earth at the hands of humans. Broecker, from Columbia University, is one of the premier so-called Earth System scientists. He is a chemical oceanographer who works a lot with biologist, geologists, and climatologists. State of the World, 1995 (World Resources Institute), from World Resources Institute, Washington, DC. Annual summary of global trends in specific environmental issues. Some graphs, but mostly experts’ analyses of a wide body of research on the topics. Probably the most widely quoted source of information on environmental trends.
- Volcanism and Climate Change, American Geophysical Union, 2000 Florida Ave., NW, Washington, DC 20009. A nice, short volume that explains how volcanoes can control climate, with much of the focus on the recent Mt. Pinatubo eruptions in the Philippines. Cheap! Useful for discussion of energy, suspensions, and reactions in the atmosphere. World Resources. Copyright by World Resources Institute, Washington, D.C., published by Oxford University Press, New York.
- A report by the World Resources Institute in collaboration with the United Nations Environment Pragramme and United Nations Development Programme. A thorough look at conditions and trends in the world environment, health, economies, population, climate, and so on. Neatly summarizes issues and problems and provides copious amounts of data. Updated every two years, each edition with analysis of trends in certain issues as well as data tables to support the text. The 1990-1991 version had special section on Climate Change. A teachers guide is available. Not all environmental issues in every edition.
Video
Infinite Voyage (Crisis in the Atmosphere). Watch for a rebroadcast of this PBS program which deals with connections between many GSS phenomena but focuses mainly on global warming. It shows evidence for the phenomena, current research, and offers solutions. One 15 minute segment deals with DR. Rosenfeld of the University of California at Berkeley and his research on ways of conserving energy. It’s an excellent video.
TG-CC2-. Investigation: Title
TEMPLATE