PG3. Population Reproduction, Growth, and Change Over Time
Chapter 3
Unfortunately, neither the Spanish nor the English sailors were terribly interested in taking a census of the number of goats or dogs on the island during any of their visits, and they did not do a mark-recapture that we know of. We can only guess at the number of animals on Goat Island and how they grew and declined. We do generally know, however, that populations grow and reproduce exponentially unless limiting factors intervene.
I. Reproduction in Populations
All populations grow exponentially when they do not have too many limiting factors operating upon them, but their methods of reproduction are different. There are two main types of reproduction: asexual (for example bacteria and yeast) and sexual (for example armadillos). There are evolutionary advantages and disadvantages to each. Asexual reproduction is usually a lot faster—yeast and bacteria population increases are counted in days or weeks, while armadillo population increases are counted in years.
Asexual reproduction can be accomplished in a number of ways. A bacteria cell does not have a nucleus and reproduces in a process called binary fission, in which DNA replicates and cellular material merely splits into two equal parts, each containing half of the original cellular substance. This is just about the simplest and fastest means of reproducing.
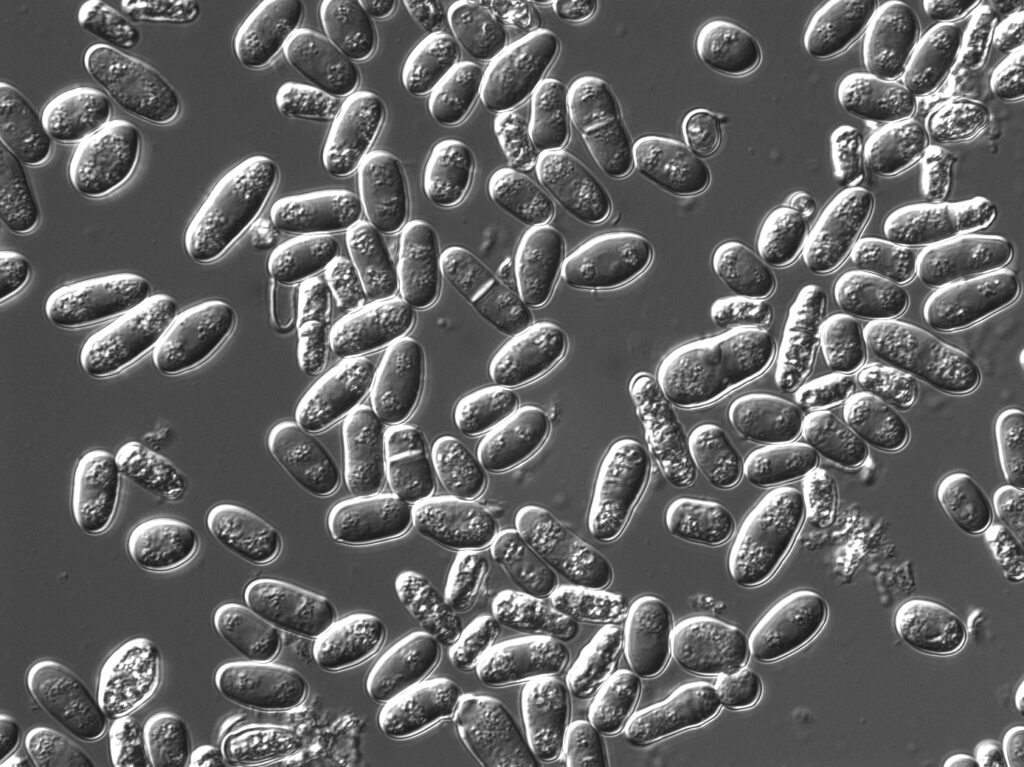
In yeast, a cell will form part of its material into a small bud, which is a replica of the parent sell. The bud breaks off and grows into a new yeast cell which in turn grows buds. Sponges can reproduce by fragmenting.
Sexual reproduction always involves two parent organisms, though in some cases it is difficult to tell which is which! For example, Rhizopus nigricans, the common black bread mold, has hyphae or strands which are called plus and minus because no one can tell the difference by looking. However, the mold can tell, since when these two strands meet, the mold forms a big black sexual spore called a zygospore.
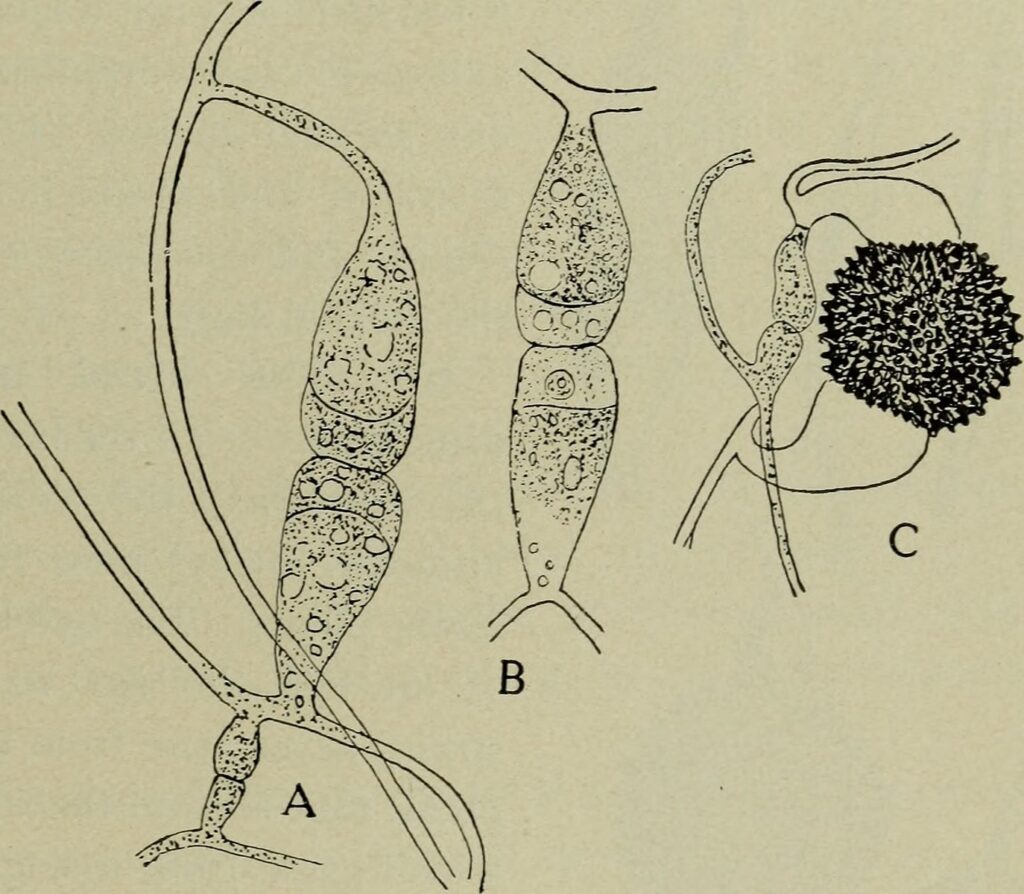
By George Francis Atkinson, from Wikimedia Commons.
There are many interesting ways in which organisms have adapted for sexual reproduction. Some fish change sex when necessary. In some cases, the male has the babies and in some cases, he alone raises them. One fish even keeps the babies in his mouth to protect them from predators until they are big enough to escape on their own. The many strategies organisms have evolved to keep and attract a mate and protect their young make very interesting reading. The end result of all this effort, however, is successful propagation of the species.
There are even some organisms, certain sponges, algae, and bread mold, that can use either asexual or sexual reproduction, depending on environmental conditions.

PG3.1. Investigation: Moldy Bread
Next time you get a piece of moldy bread, don’t throw it away right away. Get a magnifying glass and see if you can see the zygospores. They look like miniature peppercorns. Better still, look at it through a microscope.
II. Geometric Growth
Belgian mathematician, Pierre Verhulst (1804–1849), while working on the theory of numbers, became interested in social statistics. In 1845, he took up the challenge of creating an equation which simulated population growth and to mathematically describe the forces which tend to prevent population growth from increasing without limit. He was able to predict that an upper limit of the Belgium population would be 9,400,000.
Belgium population in 1994, over 150 years after Verhulst’s prediction, was 10,118,000, so his prediction looks pretty good. It may be worth it to have a look at his math. [Source: http://www-gap.dcs.st-and.ac.uk/~history/Mathematicians/Verhulst.html ]
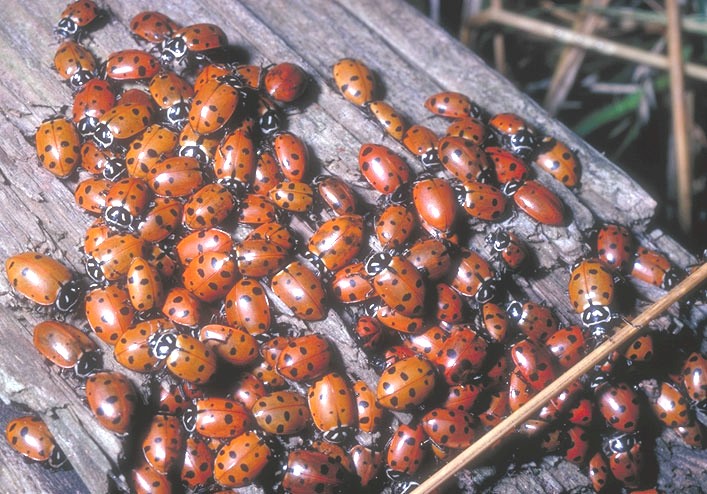
To start Verhulst knew he would have to greatly simplify the patterns of growth. His most rudimentary population equation is a great deal like the armadillo activity you did in Chapter 2. As an illustration of Verhulst’s principles, imagine a population of ladybugs, which are sexually reproducing organisms. We will use the following symbols:
P = Population (number of ladybugs)
n = year, starting with year 1.
For example, if we start with year 1 as 2003 (n = 1), then
for year 2004, n = 2, for year 2005, n = 3, and so forth.
Pn (pronounced “P” sub “n”) is the population (of ladybugs) in year n.
Verhulst reasoned as follows:
- The size of next year’s population depends on the number of parents this year. Using our symbols as shorthand, we could express this as
Pn+1 depends on Pn. - Populations increase by a certain factor every year. For example, suppose that our imaginary ladybugs double their number each year. 100 insects in year one means 200 insects in year two. In shorthand this is:
P(next year) = 2 times P(this year) and in the shortest shorthand (mathematically)
Pn+1 = 2 Pn
(In real life, of course, insects lay thousands or millions of eggs. Most of the eggs are eaten by birds or spiders, or destroyed by other natural causes. The assumption that the population doubles every year is despite all of these complex events.)

PG3.2. Investigation:
Verhulst’s Population Equation
The easiest way to visualize how populations vary in time is to make a graph. The horizontal axis represents time, and the vertical axis represents the number of individuals in the population. If we start with 100 insects (P1 = 100) , in year two, there will be 200 insects (P2 = 200).
| n | Pn | Pn+1 = | 2 Pn |
|---|---|---|---|
| 1 | P1 = 100 | P2 = | 2 (100) = 200 |
| 2 | P2 = 200 | P3 = | 2 (200) = 400 |
| 3 | P3 = 400 | P4 = | 2 (400) = 800 |
| 4 | P4 =800 | P5 = | 2 (800) = 1600 |
| 5 | P5 = 1600 | P6 = | 2 (1600) = 3200 |
| 6 | P6 = 3200 | P7 = | 2 (3200) = 6400 |
Make a graph of the equation Pn+1 = 2 Pn using the graph points tabulated in the table at right.
The factor 2 was put into the equation because we imagined that each year our insect population would be double the year before. But, said Verhulst, if we want to think about all kinds of increases we must recognize that they all don’t double each year. Some grow faster, some slower. Instead of the number 2 let’s put in a letter which will stand for the number, or factor, that we multiply by the previous year’s population to get this year’s population. Let’s call G the population growth factor. Our equation now looks like this:
Pn+1 = G * Pn
Now make a table and graph showing how the population would change over six years if G= 3. On the same graph show how the population would grow if G=1, and if G= 0.5.
Question 3.1.
How do these different growth factors affect the population?
Question 3.2.
What would the population be after ten or fifteen years for these different growth factors?
The method of calculating the population for each year based on the previous year is called iteration. The invention of calculators and computer spreadsheets has made the process of iteration a very popular and easy way to calculate population growth. If you have access to these tools, you may want to calculate the population for a wide variety of growth factors and lengths of time.
The result of our calculation is called a geometric progression. Geometric population growth can occur in special situations where the food supply is plentiful and there is space for organisms to grow. An example is the growth of bacteria in a petri dish. They can double their population in an hour. The population explosion of rabbits in Australia is another example. But no population can grow geometrically forever. Limitations always exist. The petri dish has just so much space. There are limits to the rabbit food supply. The first years on Goat Island were those of geometric growth for the population of goats because the small population of goats had not yet discovered the limits to their growth.
III. Carrying Capacity
Carrying capacity of an ecosystem is the size of the population that can be supported indefinitely with the available resources in that ecosystem. By now, you may realize that limits to population growth include scarcity of food, disease, and predators. In order to reflect the idea of carrying capacity in a population equation, we need to use a different way of representing a population. One way of doing that is using the idea of normalized population. This concept is a bit like when you say to your friend, “On a scale of one to ten, how would you rate the quality of that spaghetti sauce.” Except that a normalized spaghetti sauce scale is not one to ten, but zero to one (as a decimal number), with one being the best sauce and zero being the most awful imaginable sauce.
Until now the population in a given year, Pn, represented the total number of individuals in a population. We now define the normalized population ρn as a decimal number between 0 and 1 that represents the size of the population in relation to the carrying capacity of the environment.
If ρn= 1, the population is at its maximum size; it has reached its carrying capacity. If ρn= 0, there are no individuals left at all.
ρn= 0.5 means that the number in the population is just half of the maximum that can be supported in that area.
ρn = 0.25 means that the population has reached one quarter of its maximum size.
IV. A More Realistic Population Equation
Verhulst noticed that when a population was small it grew very rapidly. But when the population neared its carrying capacity, it grew slower and slower. The first few generations of goats on Goat Island had lots of food and no predators. But when their numbers grew, they competed with each other for food and many starved. A large population of goats could support a large population of predators, so many goats were killed each year. And if disease struck when the population was high, many would die. To reflect this idea, Verhulst realized that he would have to include a factor which would slow the population growth as the population came closer and closer to the carrying capacity. He found success with the term as a “population limiting” term:
(1 – ρn)
Remember that ρn varies between zero and one, where 1 is the population that has reached carrying capacity. The table at right shows how this population limiting term changes as the normalized population changes.
The term gets smaller when the population gets bigger. Verhulst inserted the term into the population equation as follows:
ρn+1 = G ρn (1 – ρn)
In words, the equation says that the normalized population next year, ρn+1, is equal to the growth rate, G, times the normalized population this year, ρn, times the population limiting term (1 – ρn).
The population equation does not exactly predict what the population will be in real life. Its purpose is to simulate the general patterns of population growth, and then to see what insights this can give us. In this next activity you will see if the equation can produce the various population patterns that we observed on Goat Island.

PG3.3. Investigation:
Playing With the Population Equation
This is a perfect job for a computer or a scientific calculator which doesn’t mind doing simple calculations over and over again. If you have a computer available or a TI82 or above that has a spreadsheet program, you can write an equation which will automatically produce graphs for different growth rates and different starting populations.
We’ve worked out two examples in this chart. In both examples we start with a normalized population of .1 (10% of the carrying capacity), and calculate the normalized population each year for a total of twenty years. Example 1 assumes a population growth factor of 2.0. Example 2 assumes a population growth rate of 3.0. Since these numbers represent the normalized population, they might represent hundreds, thousands, or even millions of individual goats, rabbits, or insects. Graph the two examples.
Compare the graphs. Describe how the populations which grow at these two different rates change over time. How do they apply to the population of goats on Goat Island?
| Year | Population 1 | Population 2 |
|---|---|---|
| n | 2.0 pn (1-pn) | 3.0 pn (1-pn) |
| 1 | 0.100 | 0.100 |
| 2 | 0.180 | 0.270 |
| 3 | 0.295 | 0.591 |
| 4 | 0.416 | 0.715 |
| 5 | 0.486 | 0.598 |
| 6 | 0.496 | 0.721 |
| 7 | 0.499 | 0.603 |
| 8 | 0.500 | 0.718 |
| 9 | 0.500 | 0.607 |
| 10 | 0.500 | 0.715 |
| 11 | 0.500 | 0.611 |
| 12 | 0.500 | 0.713 |
| 13 | 0.500 | 0.614 |
| 14 | 0.500 | 0.711 |
| 15 | 0.500 | 0.616 |
| 16 | 0.500 | 0.709 |
| 17 | 0.500 | 0.618 |
| 18 | 0.500 | 0.708 |
| 19 | 0.500 | 0.620 |
| 20 | 0.500 | 0.707 |
V. Mathematical Models and Real Systems
Let’s now go back and apply what we have learned to what occurred on Goat Island and what happened with the lynx and the hare. Before the dogs were introduced to Goat Island the population of goats fluctuated up and down as the goats periodically ate their food supplies, suffered famine, then recovered as their food grew back. Each oscillation would have taken several years. This pattern can be modeled by the population equation if n is taken to be certain number of years rather than one year, and if the growth rate is taken to be about 3.0, or a little larger.
The addition of the dogs presented a new variable to the goat population. The goat population grew at a slower rate because some were killed by dogs, and because the goats were not free to forage for food wherever they wanted. The number of dogs controlled the goat population and the number of goats controlled the dog population. In a few years their populations settled down to certain population sizes—the carrying capacity of the island for goats and for dogs. The goat population would be better modeled by the population equation with a growth factor around 2.0, or a little larger. Would the lynx and hare follow the same pattern as well?
All species, however, do not mindlessly propagate in large numbers. Many have strategies which limit the amount of competition for the resources needed by the organism to survive.

PG3.4. Investigation:
Optimum Number of Offspring
Using books on animal behavior, or the internet, find a strategy used by an organism in the wild to preserve its resources so it can raise the optimum number of offspring. Speculate on what might happen to this organism if it stopped using this strategy.
The Story of Lonesome George
Why Is “Lonesome George” Lonesome?
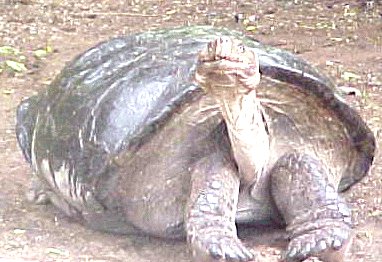
Lonesome George (~1910–2012) was a giant tortoise from the island of Pinta in the Galapagos Islands. Many years ago, there were thousands of tortoises on the island, but some people put some goats on the island and those goats ate all of the food that the tortoises were using for their food.
Now, there are no more tortoises on that island. George was the last tortoise from that island and was over 100 years old when he died. His species of tortoise will become extinct. He was called “lonesome” because he was the last one of his species. All of his friends were gone. That’s sad, isn’t it?
After Lonesome George died, researchers reported identifying 17 tortoises partially descended from the same species, leading them to speculate that related purebred individuals of that species may still be alive. Also, another species, Chelonoidis donfaustoi, was found to have a 90% DNA match to that of the Pinta Island tortoise raising the hope that the species could be resurrected.
Question 3.3. After reading the story of Lonesome George, can you name one possible advantage that asexually reproducing organisms would have over those that reproduce sexually? Why, then, has sexual reproduction even evolved?
Many people would answer that it is pleasurable to the organism. That certainly is often the case with humans, but with other organism such as sponges or jellyfish, that is probably not the answer.

PG3.5. Investigation: Advantages and Disadvantages of Sexual Reproduction
Brainstorm with classmates some ideas about the advantages of sexual reproduction—other than pleasure—and report back to the class. (Hint: check into Darwin’s tenets, below.)
If you came up with the idea that variation in offspring is an advantage, then take it a step farther and explain why variation in offspring could lead to better survival.
Can you come up with some disadvantages of sexual reproduction? (Hint: think of the cheetah or the blue whale, or Lonesome George, the tortoise).
Now how about advantages and disadvantages of asexual reproduction? Here you need to consider a scenario where every single organism is an exact copy of another, and there is a sudden environmental disaster. What then?
Make a table like the one below in preparing a report to the class:
Sexual Reproduction | Asexual Reproduction |
|---|---|
| Advantages | |
| 1. | |
| 2. | |
| 3. | |
| Disadvantages | |
| 1. | |
| 2. | |
| 3. |
VI. Populations and Change Over Time
Charles Darwin read “An Essay on the Principle of Population” written by Thomas Malthus, an English clergyman back in 1798. Although the essay was about human populations, Darwin applied it to populations of all living organisms when writing his tenets on natural selection.
Darwin’s Tenets:
“It is interesting to contemplate an entangled bank, clothed with many plants of many kinds, with birds singing on the bushes, with various insects flitting about, and with worms crawling through the damp earth, and to reflect that these elaborately constructed forms, so different from each other, and dependent on each other in so complex a manner, have all been produced by laws acting around us. These laws, taken in the largest sense, being Growth and Reproduction; Inheritance which is almost implied by reproduction; Variability from the indirect and direct action of the external conditions of life and from use and disuse; a Ratio of Increase so high as to lead to a Struggle for Life, and as a consequence to Natural Selection, entailing Divergence of Character and the Extinction of less-improved forms.
“Thus, from the war of nature, from famine and death, the most exalted object which we are capable of conceiving, namely, the production of the higher animals, directly follows. There is grandeur in this view of life, with its several powers, having been originally breathed into a few forms or into one; and that, whilst this planet has gone cycling on according to the fixed law of gravity, and from so simple a beginning endless forms most beautiful and most wonderful have been, and are being, evolved.”
(Charles Darwin, 1859, On the Origin of Species, p. 489-490*)
To paraphrase, Darwin’s theory consisted of four (4) basic tenets*:
Inherent Variability: Individual members of any population vary in their outward appearance or phenotype. Variation is an essential characteristic of populations.
Overpopulation and Limited Resources: Populations produce more offspring than can be supported by the resources in a given area.
Competition and Survival of the Fittest: Those individuals that are more efficient at competing for the limited resources will survive. These individuals possess the best adapted characteristics
Differential Reproduction: The more efficient (adapted) individuals will have more efficient (adapted) offspring and in greater numbers.
Question 3.4.
In which of Darwin’s tenets are limiting factors listed? Write the limiting factors stated by Darwin.
Question 3.5.
How did Darwin use the exponential growth of populations to develop his ideas?
Question 3.6.
Do you agree with Darwin’s ideas about populations? Explain your reasoning.
VII. Density Dependent and Density Independent Factors
What we have been discussing up to now in this book is what is called “density-dependent” factors. These are factors which depend upon the numbers of individuals competing for the same resources. They can be between different species needing the same resources (interspecific), such as the tortoises and the goats, or between members of the same species competing for space or food (intraspecific) such as two finches needing the same nesting territory. Many organisms regulate their reproductive activity based on whether there is enough food, enough space, or enough mates. Competition and predation are two key factors in keeping most populations of organisms well below their carrying capacity.
Competition among species for survival takes many forms. Over fifty per cent of lion cubs will starve to death during their first year. Each weaned cub must compete with the adults for the meat of the kill. Only the most aggressive and strongest cubs will survive. How does this fit in with Darwin’s tenets?
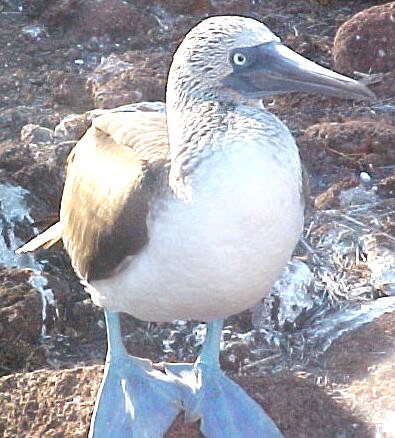
In the case of the blue-footed booby, only one chick of the two in the nest will survive, since one chick will kill the other as soon as it is able.
Albatross babies must actually starve for a while to lose weight so they can fly, and some are starved so long that they die. Many animals guarantee a dependable food supply by defending space. They will use behavioral rituals like head-bobbing, or brilliant color, or even pick up stones as a threat.
Other animals, like gibbons or birds, sing in defense of their territory. In some animal groups, such as wolves, only the dominant male and female mate. If others in the pack want to mate they must leave the pack and start their own. Some species divide up the territory, so that some finches will feed on the ground, while others feed in bushes or trees. The famous study of “Darwin’s finches” has shown us that different species can evolve from common ancestry by using this strategy of dividing up the territory as well as the types of food utilized.
Plants also use strategies to maintain their territory and compete with other species. Some plants, like the black walnut, put out chemicals that prevent other plants and even their own offspring from growing near enough to crowd them.
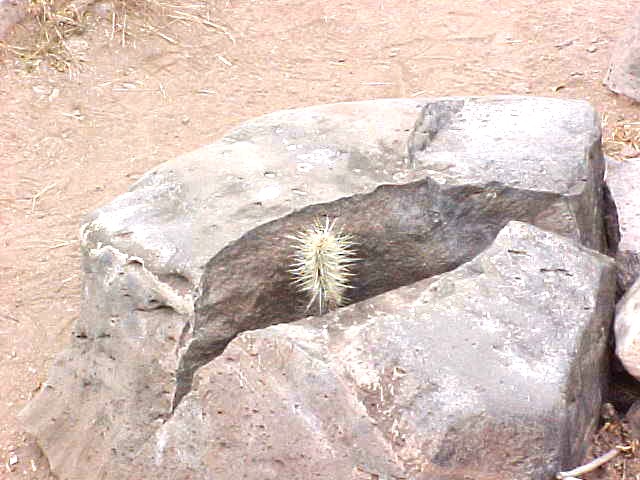
Other plants grow thorns or hairs which aid in survival, while still others enlist animals to defend them in return for food, as the acacia tree enlists ferocious ants in its defense.
Other plants cooperate with fungi growing in the soil to help them get more nutrients.
Density-independent limits on growth are not influenced by the number of individuals in the population. Fires, floods, and other weather-related variations are all density-independent limiting factors. Again, those organisms most able to survive catastrophes will be successful. Some organisms even depend on an occasional catastrophe for their reproduction. Black locust seeds and bristle pine seeds must be exposed to high temperatures before they can germinate. Therefore, forest fires are necessary for the reproduction of these species.

PG3.6. Investigation: Density Dependency
Search the internet for examples of density dependency and density independent factors.
Before you begin, list at least 4 density dependent factors for which you will search. Give specific examples for each which you have found in searching the Internet and tell how each affects population growth.
Then list at least 4 density independent factors. Give specific examples for each which you have found by searching on the Internet and explain how each has affected population growth.
Putting together some things we have learned:
- Populations can grow very quickly if there is nothing to slow their growth.
- Exponential growth causes awesome increases in populations.
- Populations may grow very quickly, but with normal checks and balances their growth will level off as carrying capacity is reached. Populations can decline and even reach extinction if they have no defense against an alien species.
Now it is time to find out how all of these factors can determine the evolution of life on Earth. Upon reviewing Darwin’s tenets, you can see that if only some individuals survive, these individuals will be the founders of future populations. What determines which individuals are most fit to survive?
VIII. Genes, Populations, and Evolutions
If a population survives, traits which are optimum for survival are more likely to prevail in a population. Over long periods of time, populations will change, or evolve, as more and more members of the group retain these desirable survival traits. In fact, recent studies by field ecologists have shown us that these changes occur more rapidly in some populations than previously thought. Some animal groups must adapt rapidly to environmental stress or completely disappear. The organisms with the traits most useful for survival and reproduction will prevail.
“Evolutionary biologists continue to test the theory of evolution by natural selection and, though refined, no one has put forth compelling evidence to reject natural selection. It was not until the rise of modem genetics that this process was understood as the cause for certain traits remaining in the population while others disappeared.”
(J. B. Losos and K. deQueiroz, 1997, Darwin’s Lizards, Natural History 106 (11):38.
One can determine whether or not evolution is occurring in populations by studying the genes in a population. If a population is in equilibrium, or not evolving, its genetic composition will show no change over time. However, if a population is evolving, the frequency of the genes in a population will change.
A population that is in equilibrium has the following characteristics:
- a population must be large
- there must be no immigration or emigration
- there must be no natural selection occurring
- mating is random
Under such conditions, evolution will not occur. Obviously, in nature, unless a population is isolated and unable to move about, these conditions do not occur. Population ecologists use sampling techniques which can tell them how much a population is changing or evolving. The study of population genetics can alert an ecologist to the impact of various limiting factors on a population. The activity Mark-recapture (end of Chapter 2) is one method of finding out what is happening to populations. Another would be one which counted lynx and hare pelts.

PG3.7. Investigation
Earlobes: A Study of Gene Frequencies
Survey your classmates or schoolmates to learn about how traits such a free/attached earlobes are inherited by individuals in a population.
IX. The BIG Question
Now, the big question. Do humans follow the same population rules that govern other organisms?
Obviously, we do not easily go out and mark and recapture humans for study.
We can, however, see if the gene frequencies of human populations are changing. Here is an example of a recent study.
The data below, collected during the 1940s and 1950s, showed the relationship between the percentage of the population found to have a sickling gene (i.e., individuals with one sickle cell gene and one normal gene) and the frequency of individuals with sickle cell disease, meaning they have two genes for the disease):
| Location | % Sickle-cell Trait | % Sickel-cell disease |
| Africa | 20 | 2 |
| United States* | 6 | 4 |
Question 3.7.
Why has the sickle cell frequency declined in the United States? (Hint: how much malaria do we have occurring in the US?) Look up the relationship between the sickle cell gene and malaria. Discuss this with your teacher.
Dunkers of Pennsylvania: The Dunkers are a small religious sect which was established in the middle of the 18th century by 27 families who emigrated from Germany. After arriving in the United States, they were essentially genetically isolated because they generally did not reproduce with people in nearby populations.
A number of traits are either more or less frequent in the Dunkers than they are in Germany or other populations in Pennsylvania. Blood type A (IAIA or IAIO) has been observed in 60% of the Dunkers, but occurs in 40-45% of Germans. Similarly, the blood-type allele M occurs in 65% of the Dunkers and 54% of Germans. In contrast to these data, the blood-type trait IB has nearly been lost, occurring in only 2.5% of the Dunker population.
http://www.tulane.edu/~eeob/Courses/Heins/Evolution/lecture12.html

PG3.8. Investigation: Dunkers Blood Types
Make a table for the Dunkers’ blood type frequency similar to the one on sickle cell trait. Why have the Dunker gene frequencies stayed the same? Search on the internet to find out more about the Dunkers and come up with a hypothesis.
From these studies, can you hypothesize whether or not the human population is evolving? What does it take for populations to change their gene frequencies? Which population may do better over the long run, the sickle-cell group, or the Dunkers? Give reasons for your answers.
Much discussion is now occurring regarding whether or not genes should be manipulated to better serve human needs. What impact do better health care and the cure of disease have on human populations?

PG3.9. Investigation:
Health Care and Population Growth
Search the Internet to find a correlation between health care and population growth in humans. Has it made a difference?

