PG3.7. Earlobes: A Study of Human Gene Frequencies
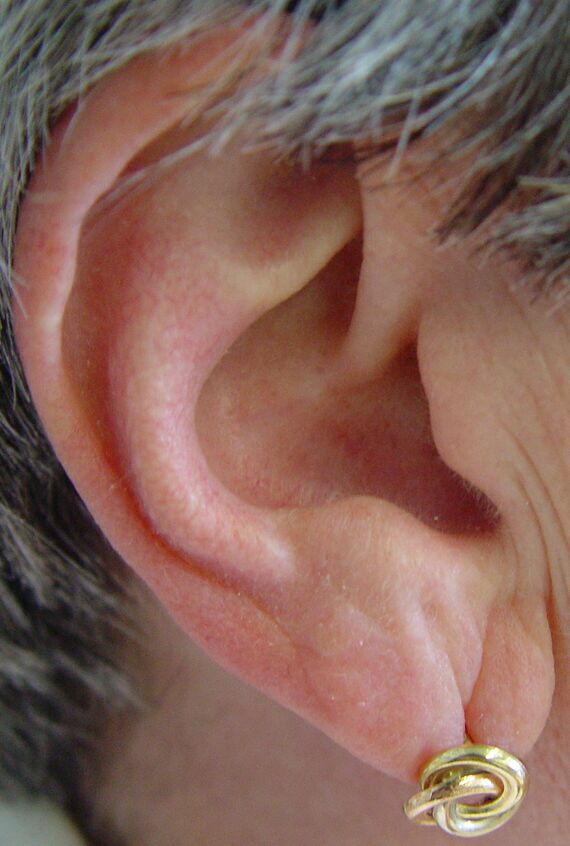
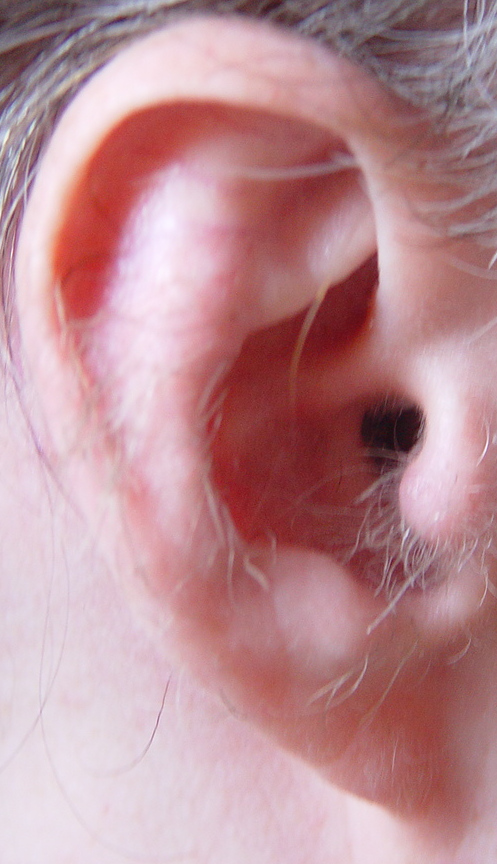
All of us have genes in pairs. We received one gene of each pair from each of our parents. For example, whether or not you have lots of room for earrings is determined by the pair of genes you received from your parents. In the case of earlobes, you can see below that you may inherit either attached or unattached earlobes.
Free ear lobes (dominant trait) vs. Attached Earlobes (recessive trait)


Free earlobes
are those that hang below
the point of attachment to the head.
Pair up with another student and look at each other’s earlobes. Once that is done, count all the students in your class who have the dominant gene (free earlobes, and all of those with the recessive attached earlobes. If a student has attached earlobes, then they have two recessive genes, often represented by two small letters. Let us use “aa” for attached earlobes, and a “A” for unattached earlobes. Why can’t we just write two big A’s for a person with attached earlobes? (Remember, everyone has two parents!) Is it possible for someone to have one big A and one little a? How could that happen?
In a large population, if you have two possible genes for earlobes, either attached or unattached, and if the attached only shows when there are two of them, what are the chances of a person having attached earlobes? Here are the possible combinations: AA, Aa, aA, or aa. In the first case, the gene given by each parent to the child is a “A”. In the second case, the mother gives the child a “A” and the father gives the child a “a”. In the third case, the father gives the child a “A”, while the mother provides a “a”. In the fourth case, both parents provide a “a”. Therefore, the chances of getting a “AA” , a “Aa”, or a “aA” are .75 or 75%, while the chances of getting a “aa” are only 25%.
Count as many students in your school as you can.
Once you are done, you should make a data table like the one below:
| Column I | Column II | Column III | Column IV |
| Name of Trait | Number with Trait | Frequency of Trait (Column II divided by total) | Expected Frequency (3 to 1) |
| aa (Attached earlobes) | .25 | ||
| AA or Aa (unattached earlobes) | .75 | ||
| Total Number counted | 1.00 |
Now you have the gene frequency of a population. If the numbers counted were large, if no one moves in or out of the school, if no genes are mutated or none of the group is selected out by disease or disaster, and mating is random in the community, then the population frequencies should stay the same year after year. How likely do you think this is? Any frequency change means that evolution, or change over time, is occurring.


