OZ6. The Loss of ’84 and the Surprise of ’85
He had checked and rechecked the instrument, a spectrophotometer, which can accurately and precisely measure the intensity of a particular wavelength or color of light. Last year, back in England, the instrument had been completely rebuilt. It was now October, 1983, and he was standing at the shores of Halley Bay, Antarctica, practically at the “bottom” of the world, with the temperature somewhere at -20°C, and the instrument still gave him impossibly low readings.
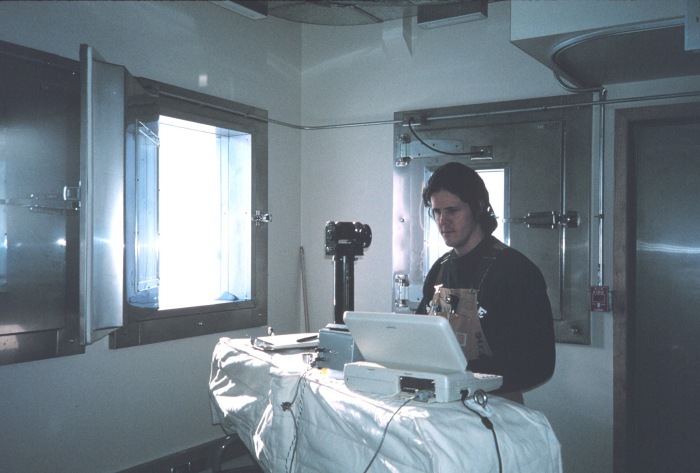
Photo by Lt. Mark Boland, NOAA Corps. Courtesy of the NOAA Photo Library.
Joe was a member of the British Antarctic Survey team. Since 1957 they had come to this place to study the Antarctic.
Beginning in 1982, it was Joe’s job to make a record of the amount of ozone gas in the atmosphere high overhead. The ozone concentrations that Joe was measuring were in the stratosphere 23 km above him. They are difficult measurements to make and the equipment he was working with was not the newest.
Although the equipment was consistent in showing him low readings, he was not very confident that it was working correctly because no other atmospheric scientists were reporting the same low readings he was getting. After all, he reasoned, if the new sophisticated equipment on the American satellite which was making the same measurements of ozone concentrations from above did not get the results he was getting from the surface, how could he expect his measurements to be correct? He pulled off his mitten and quickly wrote the reading of his equipment down anyway. Later he would average the readings for the month and put them into the record book of the survey.
Question 6.1.
What would you have done? If you were a professional scientist would you go ahead and announce to the world that something was going wrong with the Earth’s ozone layer? What if there were something wrong with your instrument or with your procedure? What if you were making some systematic error in your calculations? Was there something else that you had overlooked that was giving you incorrect results?
Reading the reports of completed scientific investigations sounds like everything is straightforward and precise. However, such readings are about the successful investigations with all the mistakes and frustrations eliminated. In reality, scientific investigation is like searching in the dark for a light switch in an unfamiliar room. There are many stumbles and wrong turnings.
By 1984 Joe Farman had a brand new set of instruments for measuring the ozone concentration over the Antarctic. The readings were in the same low range as they were the year before. The research team were convinced that something dramatic was happening to the ozone layer even though the Americans who reported satellite measurements had not reported anything unusual.
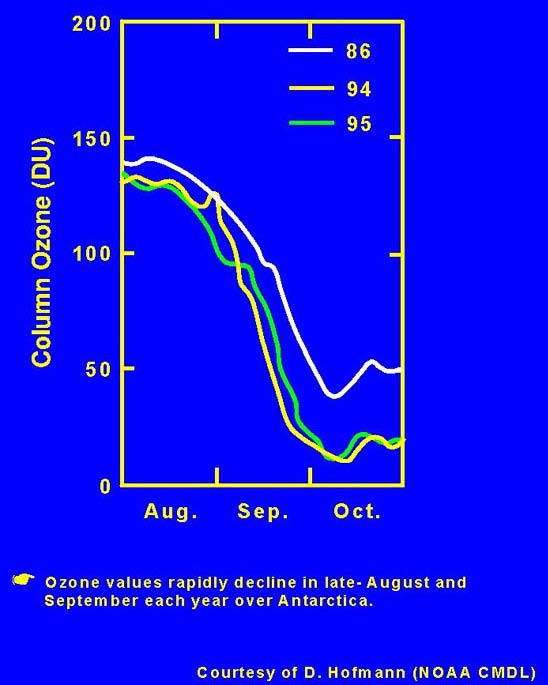
The results of Farman and his colleagues showed that in spring in the Antarctic, which extends from September 21 to December 21 (the Northern Hemisphere’s fall season), the amount of ozone overhead decreased. They checked their records and discovered that there was a decrease every spring for the past 20 years but that in recent years more and more of the ozone was missing. They published their results by the middle of 1985. The implications of their data was dramatic. Over the continent of Antarctica the thinning of the ozone layer was letting greater amounts of energetic ultraviolet energy pass through.
I. An “Almost Missed” Clue
Imagine you are a NASA atmospheric scientist. It is May 1985. You open this week’s issue of Nature, one of the world’s leading scientific journals. In a paper written by the British Antarctic Survey team, which has been measuring ozone concentrations in the atmosphere over the Halley Bay base station in Antarctica, you discover the unexpected graph above.
The British report puzzled NASA scientists. How could the observations be true? The United States instruments circling the Earth aboard satellites didn’t tell the same story. The people at NASA looked more carefully into their own stored information. As soon as they carefully examined the operation of their own procedures they were able to resolve the difference in the reports of the two teams.
The sophisticated sensing equipment on board the satellite could collect so much data that it threatened to overwhelm the researchers and their computers. To keep the data processing ahead of the accumulation of data, it was necessary to set limits on which data were to be analyzed. So, they instructed the analyzing computer to ignore readings that were outside the expected range. Probing into the full record of observations by the satellite equipment, the NASA scientists found the same low readings for ozone concentration that Joe Farman had found. The low readings had not been detected because they were outside the limits of what was expected.
Question 6.2.
What lesson do you think the NASA scientists might have learned from this?
What advice would you give them?
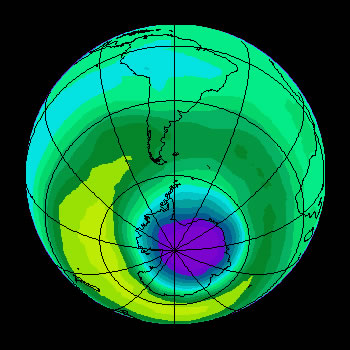
Nimbus-7 was the NASA satellite mentioned above. It circled high above the Earth from 1978 through 1993. The name of the scientific instrument it carried on board was TOMS, which stands for Total Ozone Mapping Spectrometer. TOMS works by analyzing light scattered by the atmosphere or reflected from the Earth’s surface and measuring the intensity at various wavelengths. In other words, the instrument measures the spectrum of the light reflected back to space from Earth. That’s why it’s called a “spectrometer”.
The theory behind the instrument is based on the following idea: if, in a darkened room, you shine a spotlight on the far wall the light spot will be reflected back to you. You can analyze this reflected light with a spectrometer. If the wall were a perfect mirror and the atmosphere did not affect the light you were analyzing, you would find that the reflected spot has the same spectrum as the spotlight.
Now, if a layer of smoke is introduced in the space between the wall and your spectrometer the reflected light coming to your spectrometer will be different. A portion of the light is absorbed as it approaches the wall, and an additional amount of light will be absorbed as the light is reflected by the wall and travels back through the smoke to the observer. The amount of absorption depends on the density of the smoke layer. Thus, by comparing the intensity of the specific wavelengths from the light source and the light coming back from the wall, the density of the smoke layer can be determined.
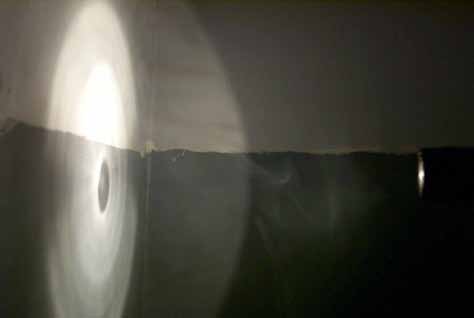
Smoke blocks a portion of the flashlight from hitting the wall. It will also block a portion of the light reflected from the wall from reaching the person holding the flashlight.
(Photo by John Pickle.)
In a similar way, TOMS is able to measure the density of the ozone layer. As the Sun’s energy passes through the Earth’s atmosphere some of its ultraviolet energy is absorbed by ozone present in the atmosphere. The rest will reach the surface and a portion will be reflected back.
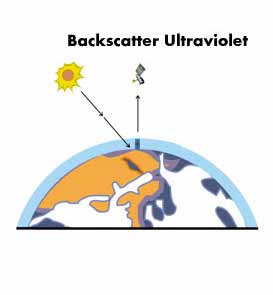
The energy reaching TOMS on board Nimbus-7 is compared to the intensity of these same frequencies coming directly from the Sun. The total amount of ozone is measured by comparing the two sets of intensities.
If, as occurs over the Antarctic in spring, there is less ozone in the atmosphere, more ultraviolet energy will reach the surface, and consequently more will be reflected back up to the satellite. Similarly, an increase in the density of ozone in the atmosphere results in less UV being detected by the satellite sensor.

OZ6.1. Investigation: Ozone Monitoring
(Adapted from Monitoring Ozone from Your Classroom, National Air and Space Museum, Washington, D.C., 1990.)
The data on this page were taken by the Total Ozone Mapping Spectrometer (TOMS) on the Nimbus-7 satellite. The ozone concentration values refer to a column of the atmosphere above a particular region of Antarctica. The actual TOMS data, consisting of measurements for each day of the year, were averaged to obtain the more manageable number of three readings per month.
Dobson Units (DU) are used to describe ozone concentrations. They were named after the scientist, G. M. B. Dobson, who invented one of the first instruments for measuring the concentration of ozone.
Graph the TOMS data:
| Day | Month | Ozone (DU) |
|---|---|---|
| 7 | March | 229 |
| 8 | 212 | |
| 9 | 201 | |
| 10 | April | 208 |
| 11 | 227 | |
| 12 | 221 | |
| 13 | May | 220 |
| 14 | 222 | |
| 15 | 223 | |
| 16 | June | 219 |
| 17 | 225 | |
| 18 | 226 | |
| 19 | July | 228 |
| 20 | 225 | |
| 21 | 211 | |
| 22 | August | 210 |
| 23 | 206 | |
| 24 | 208 | |
| 25 | September | 185 |
| 26 | 162 | |
| 27 | 138 | |
| 28 | October | 118 |
| 29 | 124 | |
| 30 | 130 | |
| 31 | November | 143 |
| 32 | 155 | |
| 33 | 176 | |
| 34 | December | 219 |
| 35 | 247 | |
| 36 | 241 |
Graph Interpretation
- For which month was the ozone concentration value highest?
- For which month was the ozone concentration lowest?
- Remember that the seasons in the Southern Hemisphere are opposite those in the Northern Hemisphere. During which Antarctic seasons were ozone values highest and lowest?
- Do ozone levels seem related to the time of year? How?
- How could you verify if there is a seasonal variation of ozone levels over Antarctica?
- What could be a possible cause of the ozone fluctuations throughout the year?
II. What is a Dobson Unit?
Between 1920 and 1960 G.M.B. Dobson pioneered research on atmospheric ozone. In 1924 he invented the instrument that was, until the mid-1970s, the primary way in which scientists measured the concentration of ozone in the atmosphere.
Dobson’s equipment didn’t directly measure the number of ozone molecules, rather it measured the amount of UV radiation absorbed by this thin layer of gas. By comparing the measured intensity of a frequency in the UV spectrum that was strongly absorbed by ozone to the intensity of a frequency not strongly absorbed by ozone or affected by other atmospheric components, measurements of the total ozone overhead were obtained. He was faced with the problem of how to quantify the amount of ozone overhead. Trying to compare the number of ozone molecules to the number of molecules of air didn’t work because the ratio of the numbers changed as the height changed as did the number of molecules per unit volume of air. Remember the ozone layer is approximately 12 km thick and the density of the atmospheric gases changes significantly over this distance. He decided to develop a new unit.
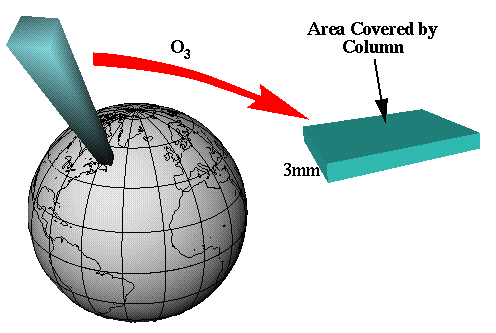
He calculated that if all the ozone in a typical column of air over the United States stretching from the Earth’s surface to space were at 0°C and compressed to 1 atmosphere of pressure (which is surface pressure), it would be about 3 mm thick.
He thought it would be a good idea to have units that were in the hundreds so he defined the 3 mm thick layer as 300 units. Later they were named Dobson units. In other words, a layer of ozone 0.01 mm thick, condensed under a pressure of one atmosphere and cooled to a temperature of 0°C, is equivalent to one Dobson unit of ozone.
Dobson Units
- Bring all ozone above a certain location down to the ground, at 0°C. and 1 atmosphere pressure.
- The thickness of this layer is about 3 mm (≈0.1 in), the thickness of two stacked pennies. This corresponds to 300 Dobson Units, approximately the global average.
- 100 Dobson Units is 1 mm thick (approximately the thickness of ozone in the Antarctic ozone.
The Dobson Unit is a convenient unit of measure for total column ozone.

