
EU6. Energy in Society
Chapter 6
I. The Big Picture
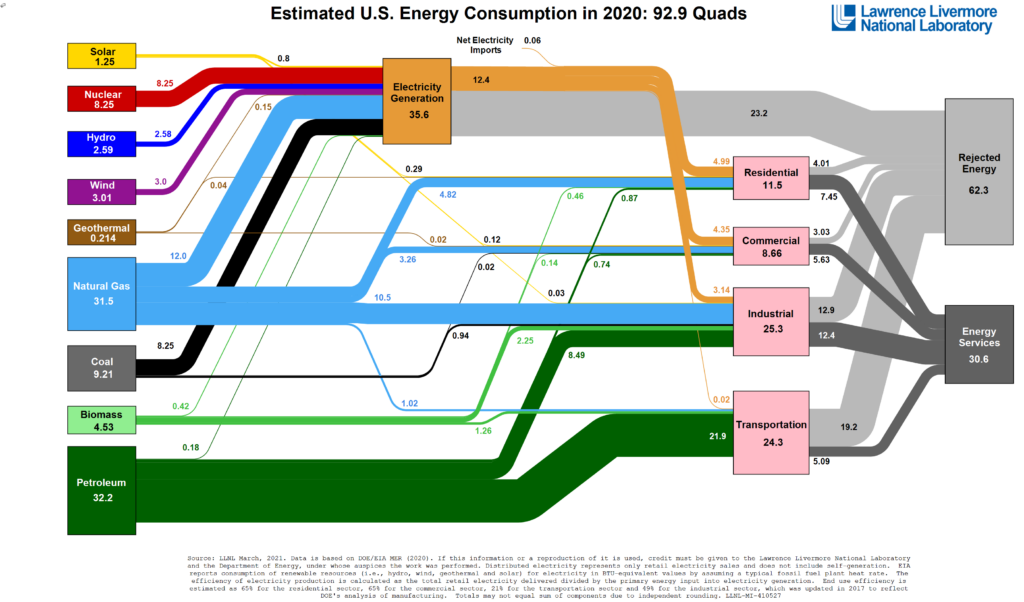
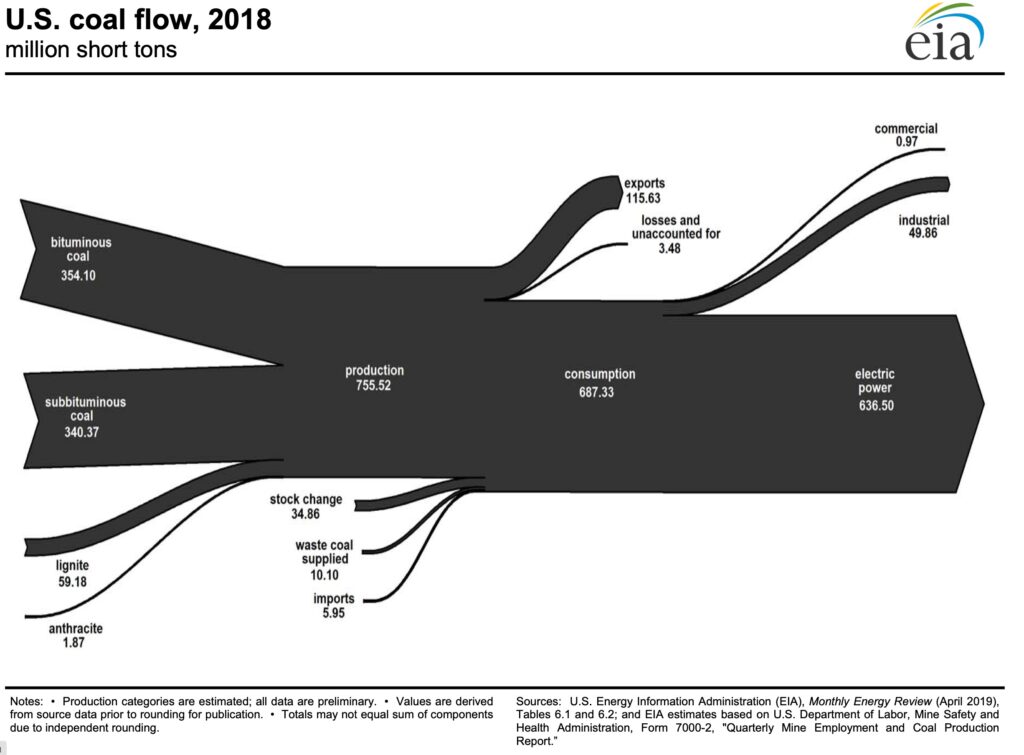
The flow chart above may look complicated, but it’s really not difficult to interpret. It provides THE BIG PICTURE of how the United States uses its energy resources.
The boxes on the left side of the chart show the major primary sources that humans tap for energy. The amounts of energy that the United States used is given in the equivalent energy of quads (1 quad = 1 quadrillion British Thermal Units or BTUs = 170 million barrels of oil). Notice that electricity is not counted as a primary source. That is because it is converted from other sources. The conversion to electricity is shown in the box near the middle of the diagram.
The bottom box shows the sectors of society that are the end users of energy. The transportation sector includes the shipping of cargo, mass transportation, and personal automobiles. The industrial sector includes construction, manufacturing, and agriculture. The commercial and residential sector includes homes, offices, stores, schools, and hospitals.
Let’s start to untangle this chart by following the widest path—the one for petroleum (also known as crude oil). What happens to the amount of oil that are withdrawn from the ground every day? A small amount is used to run equipment in oil refineries or are lost through heat in oil refineries. Another small amount is used in large power plants to produce electricity. Yet another small amount is used for non-energy purposes, such as making asphalt for roofing and street paving, and making plastics. The rest is used directly by end users: burned as fuel in cars, trucks, ships, and airplanes; burned by industries; and burned in residential and commercial buildings, mostly to provide heat.
The chart also indicates “rejected” or wasted energy.
Answer the following questions by following different paths in the flow chart.
Question 6.1
What happens to the energy in coal that is mined every day?
Question 6.2
What happens to the energy in natural gas?
Question 6.3
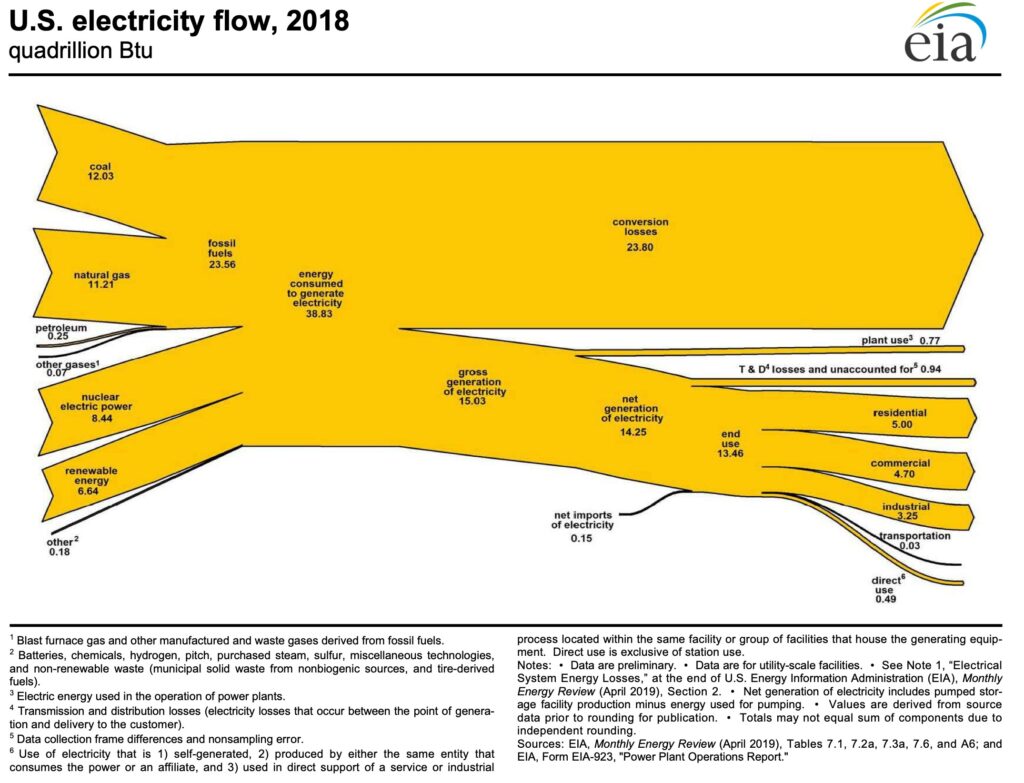
For the electricity that is delivered to end users, what per cent is lost in transmission lines?
Question 6.4
How much energy in the form of electricity is delivered to the end users daily and how much primary source energy is needed to produce that electricity?
Question 6.5
What might be some “non-energy uses for coal and natural gas?”
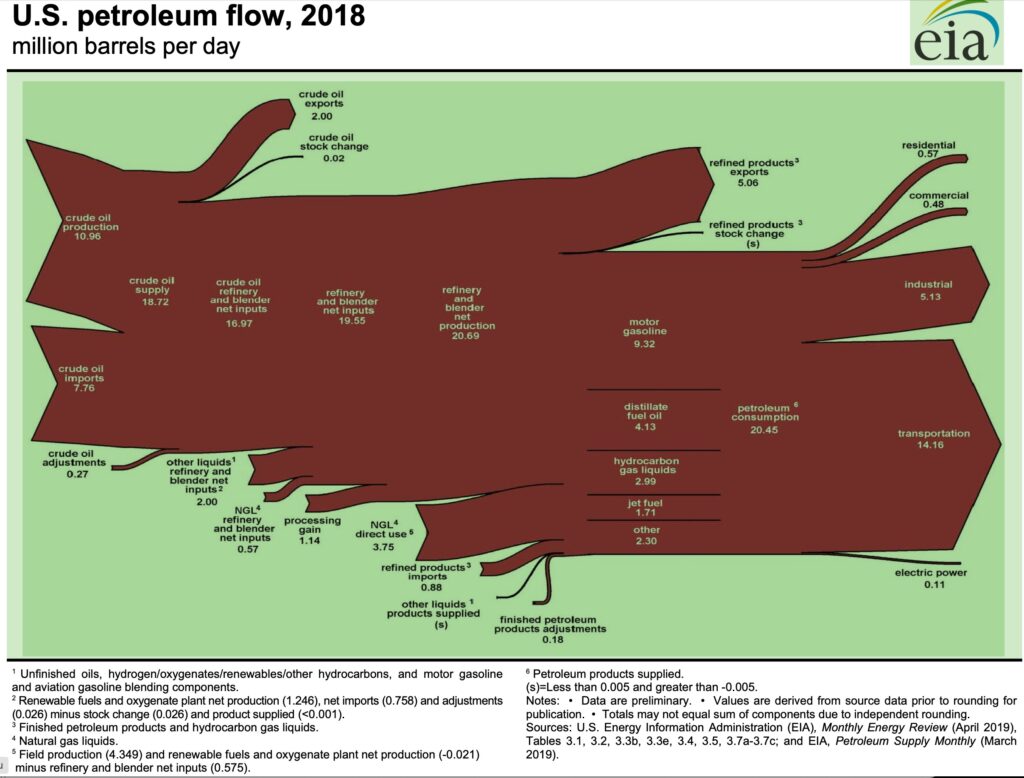
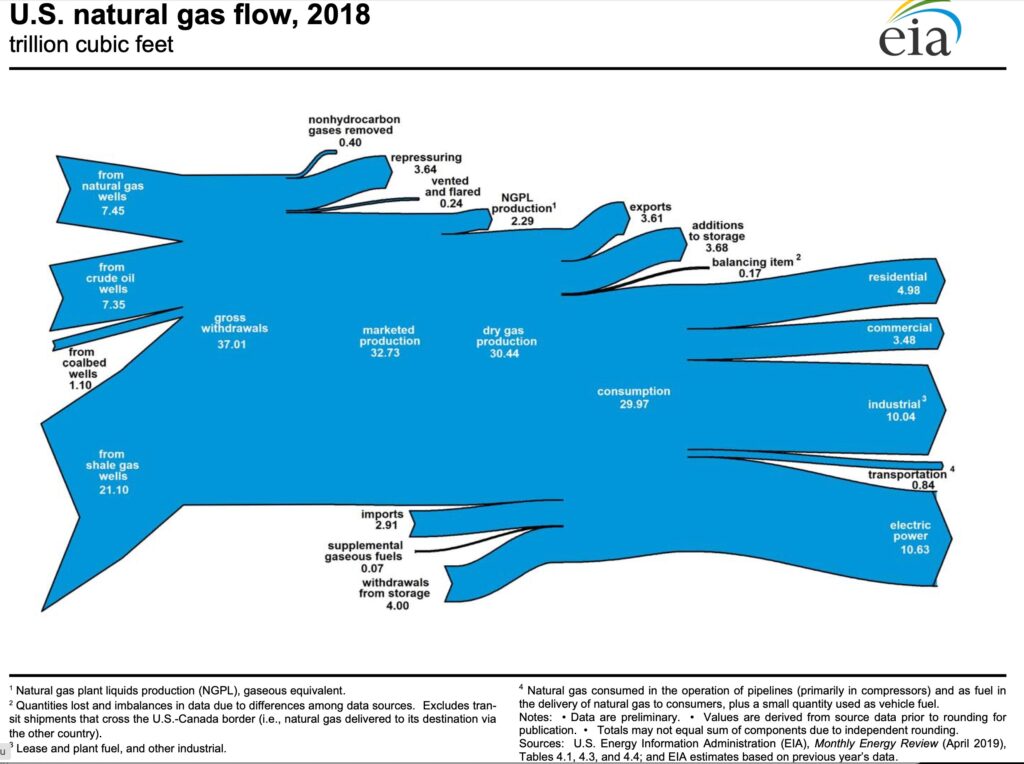
Charts below show more details for the big fossil fuel sources of energy as well as electricity generation. (for latest charts, see http://www.eia.gov/totalenergy/data/annual/)
Question 6.6
What percent of U.S. crude oil was from imports?
Question 6.7
Which sector is the biggest end-user of petroleum: residential, commercial, industrial, transportation, or electric power?
Question 6.8
Which sector is the biggest end-user of natural gas: residential, commercial, industrial, transportation, or electric power?
Question 6.9
Which sector is the biggest end-user of coal: residential, commercial, industrial, transportation, or electric power?
Question 6.10
Energy conversion losses (waste) accounts for what percent of total end-use in the flow chart?
The real waste is hidden in various places on the chart. Energy is often wasted by the ones who use it, more than the ones who find it and deliver it. Finding the waste and curtailing it is a job in itself.
II. State by State
For any state, the percentages of each type of electrical power generation fuel source may be called that state’s “electricity portfolio.” You can access Electricity Portfolios of U.S. States at https://www.eia.gov/electricity/data/state/. See also the U. S. Energy Information Administration website – http://www.eia.gov/state. There you can find a map of each state showing power plants, pipelines, electrical transmission lines, oil and gas wells, refineries, coal mines, and potential for biomass, geothermal, and solar energy.

https://www.epa.gov/egrid/power-profiler#/
Question 6.11
What types of energy sources and infrastructure are near your school or home?
How does that compare with states nearby and in other regions?
Question 6.12
How much are you dependent on fossil fuels?
What is the potential for sustainable energy in your state?
III. Energy Conservation—Becoming Energy Conscious

Meet Mary Ann Piette. She is a staff scientist at Lawrence Berkeley National Laboratory (LBNL). Her job is to analyze the energy performance of buildings. Piette tells us her interest in energy issues was sparked by a utility company speaker who gave a talk at her high school.
Piette became a physical science major at the University of California at Berkeley.
She was cultivating an interest in astrophysics when her path was changed by a course that she took on the physics of energy conservation taught by Arthur Rosenfeld of LBNL. Rosenfeld demonstrated, in a very dramatic way, what was wrong with the “more is better” philosophy of energy use.

Rosenfeld’s class showed that if the world continues on its present course it will use more and more resources at an ever-increasing rate. Not only is the world’s human population growing rapidly—adding the equivalent of the population of Mexico every year—but the industrialization of countries such as China and India means that the number of fuel-burning power plants, factories, cars and trucks, and large public buildings are growing even faster than the world’s population. The problem with this growing demand for energy is its impact on the environment. In Rosenfeld’s view, we cannot continue to extract more and more of the world’s resources, and transport them on tankers, trucks, trains, and through great pipelines without seriously affecting the environment.
Some people suggest that new sources of energy or improved nuclear power plants would solve our problems. But scientists and engineers have worked on these problems for years with only limited success. Others suggest we substantially change our life-styles: not use cars as much, and put on lots of sweaters rather than turn on the heaters. But Rosenfeld suggested a very different and simple solution—conservation. If we could find new ways to meet our needs by using fewer resources, and if everyone on the planet adopted these new ways, we could at least postpone environmental problems until new sources of energy are developed.
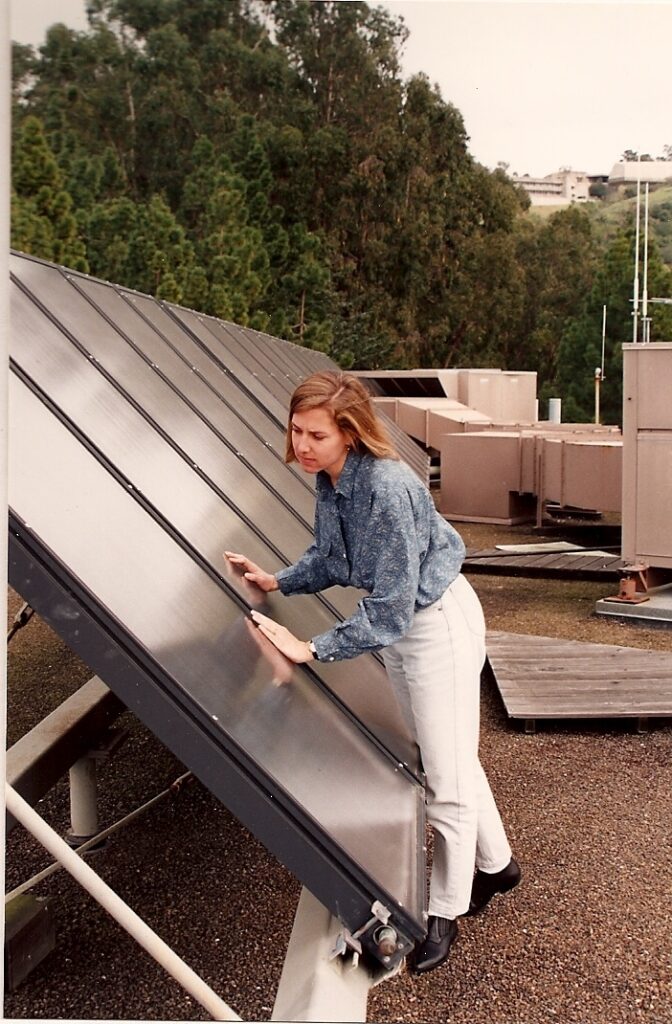
Piette was so inspired that she changed her main career path. She took courses on solar and wind energy systems, and eventually earned a Master’s degree in mechanical engineering. This expertise allows her to design ways to conserve energy, save money, and benefit the environment.
The work of scientists and engineers like Piette allows everyone to participate in energy conservation. Included on the following pages are some of the material in her course work that convinced her energy conservation is a good thing to do.
IV. Energy Use and Benefits to Society
Some things are easy to describe with numbers. Some are not. Consider the following conversation:
“How much gasoline did you use on your trip to the lake?”
“Five gallons exactly. I kept careful track.”
“And exactly how much did you enjoy it?”
“I enjoyed it exactly – Wait! How can I answer that?”
The person who took the trip had no problem describing the amount of energy she used. She just said the number of gallons of gasoline. It is trickier to put a number on enjoyment, happiness, or well-being.
If we are going to look at the impact of energy conservation on a society we need some way to describe the well-being of society. One measure of the economic health of society is called the Gross National Product or GNP. The GNP is the total dollar-value of all the goods and services produced by a society in a year.
Here’s how Rosenfeld compared the use of energy with the GNP. This graph shows the Gross National Product (GNP) of the United States during the years 1949 to 1997.
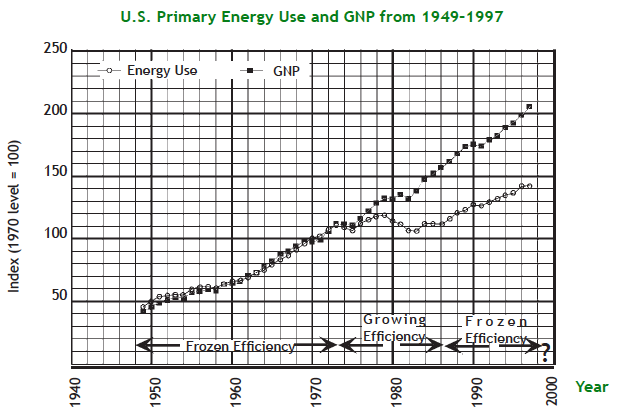
Energy use can never actually equal GNP because one is a measure of energy and the other is a measure of dollar value. Indexing allows us to compare the different quantities as they grow and change.
The steady rise in GNP during most of the time indicates a strong healthy economy. On the same graph is a line showing the growth of primary energy use in the United States. Primary energy use is the total amount of energy resources—fossil fuels, nuclear, and hydroelectric—used in a year. Rosenfeld points to this graph as a powerful piece of evidence in support of his belief in the value of conservation as a way out of the energy-environment dilemma.
A common notion is that a healthy economy depends on the progressive use of larger and larger amounts of energy. Examine the graph during the period from 1949 to 1973. The use of primary energy resources rose fairly steadily. So did the GNP. Economic growth and energy use went hand in hand. The efficiency of energy use, the value of goods and services produced for each unit of energy used, did not change during this period. It was a period of frozen efficiency.
By 1973 the United States had become dependent on cheap sources of oil from the Mideast and South America. That’s when OPEC, the Organization of Petroleum Exporting Countries, decided to raise prices. OPEC included all of the countries we purchased oil to fill the tankers and pipelines needed to fuel power plants and factories in this country.
The result was chaos in the world economy. Increased oil prices meant higher prices at the gas pump. It cost more to transport goods to market, and it cost more to produce electricity to run factories. The prices of just about everything increased, in nations around the world.
Industry leaders responded by cutting down on energy use. They found ways to produce goods with less electrical power. They figured out how to transport goods to market with less fuel. Car manufacturers figured out how to build cars that traveled more miles on a single gallon of gas. Consumers responded by buying the fuel-efficient cars, purchasing refrigerators that used less electrical power, turning off unnecessary lights to reduce their high energy bills, and investing in solar water heaters and other energy-saving devices.
The result can be seen by examining the period between 1973 and 1986. Energy resources used in the United States stayed fairly constant while GNP continued to increase. Efficiency was growing. This critical period in recent history, 1973-1986, challenges the notion that economic growth means a society has to use more energy. The economic health of the country as a whole, including jobs for workers and products for consumers, can be sustained without increasing our use of energy resources.
The growth of energy efficiency continued until the mid 1980s when two things occurred. Without a growing demand for oil, OPEC dropped its prices. With cheaper oil, there was less incentive to conserve energy. The was also a changing philosophy in government. Many energy-saving programs ended. This was symbolized by the removal of the solar water heaters from the White House roof that had been installed during the energy crisis.
The graph shows GNP continued to rise after 1986, but the period of growing efficiency ended. Energy use began to climb again in step with GNP. A new period of frozen efficiency had started. The rising popularity of Sport Utility Vehicles (SUVs) that are relatively inefficient in use of fuel symbolizes the return to frozen efficiency.
V. Conservation and Efficiency in Industry
People who work in industry understand the tremendous value of a few pennies saved. The reason is simple. If a factory produces 100 million widgets, then a savings of even half a cent on each widget adds up to an extra half million dollars in profits.
Turning raw materials into refined materials such as glass and metal takes lots of heat. Shaping these materials into finished products uses more heat. Heat is needed to synthesize the thousands of chemicals that go into plastics, paints, paper, fertilizer, and so on. Factories burn huge amounts of fossil fuels for these purposes. It is not surprising, therefore, that industrial engineers must be knowledgeable about the science of thermodynamics—the study of heat.
A law of thermodynamics states: no machine can be 100% efficient. There will always be some energy that is “wasted.” However, engineers can find ways to use the “wasted” heat, just as they would any raw material that doesn’t find its way into the final product. Imagine, for example, a factory in Northern Minnesota that makes glass bowls and cups, and is in danger of closing because of low profits. A clever engineer might install hot air ducts so that “waste” heat from the furnace can be used to preheat chemicals on their way into the furnace for processing. Or, the offices might be relocated to the second floor so that air heated by the furnace can float upwards to heat the offices by convection, saving thousands of dollars per month on utility bills.
So-called “waste heat” from factories and power plants can benefit the surrounding community. In the practice called cogeneration, heat from industry is distributed in the form of steam or hot air for nearby homes and businesses.
VI. How Everyone Can Help Industry Conserve
One way that industries have reduced their use of energy is by using fewer but better materials in their products. Sheet metal in the body of a car, for example, is engineered to be both strong and light. Besides saving energy costs in producing the car, it increases fuel efficiency. Other industries are finding new ways to package products using smaller amounts of paper and plastic.
Whether or not industry continues to produce such products depends on us—the consumers. Over the past 50 years, Americans have consumed more resources than the rest of the world in all previous history. Consumers can encourage industry to conserve by purchasing fuel-efficient cars, and choosing products that are not packaged with unnecessary amounts of paper and plastic.
Industry can produce fewer new materials in their products, or, with the help of consumers, industry can save even more energy by reusing old materials. Each year Americans throw away enough Styrofoam cups to circle the Earth 436 times. Every hour, 2.5 million plastic bottles are used. Here are some ways to encourage industry to conserve.
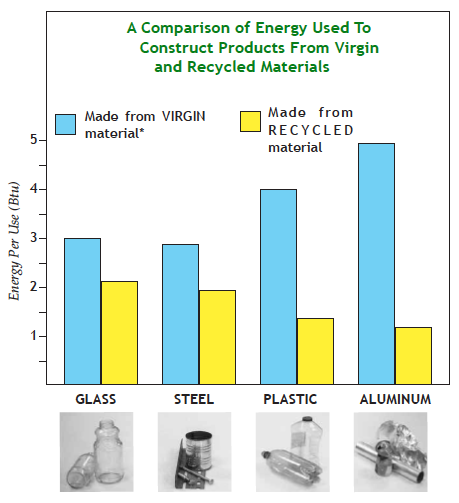
Making enough aluminum for one soda pop can takes about five Btu. Take that soda pop can and throw it in the trash and those five Btu have done all the good that they will ever do. Send that can back to the factory and for a little more than one Btu it can be made into a new can. Used aluminum is an energy source, not because it is a fuel, but because it prevents the need for using fuels to create new aluminum. The same principle applies to other metals as well as glass, plastic, and paper, although, as shown on the graph below, the energy saved by recycling these materials is different.
Recycling
Reuse
Sometimes you don’t need to melt down a glass bottle to get a new glass bottle. Just wash the old one. Dairies and beverage bottling companies have been doing this all along. Is milk delivered in bottles where you live? Sometimes it is available in a reusable bottle in stores. While you are at the store you can save energy by reusing a bag for your groceries.
Question 6.13
When you throw away a soda pop can how many Btus go with it?
Question 6.14
Many people use the terms “recycling” and “reusing” interchangeably, but they are different. What is the difference and which one saves more energy?
VII. Tracking Down Electrical Energy
“We really have to bring our electric bills down! You would save us money if you cooked that hot dog in the microwave instead of the frying pan.”
“How about this. I’ll keep frying my hot dogs and we’ll save by having you stop using the blow dryer every time you wash your hair.”
“I’ll keep using the dryer, and we’ll save by turning the TV off once in a while.”
“I wonder if we could save by not having the stereo playing so loud all the time?”
“How about unscrewing that light bulb that comes on when you open the refrigerator?”
How much energy do different appliances really use? You can track down the answer if you know the power of the appliances and how much they are used. Many of them have the power in watts printed right on them. If the wattage is not listed, there may be other ways to track down the power. But first, you have to know a little more about measuring electricity.
VIII. Measuring Electrical Energy
Somewhere on your house or apartment building there is a meter that keeps track of the electrical energy you use. Schools, public buildings, stores, and other businesses have these meters too.
The most common kind of electric meter, like the one pictured below, has a row of dials with pointers that slowly turn as your household consumes electrical energy. Remember, electrical energy does not disappear when it is consumed. It is transformed into other kinds of energy. A lamp transforms electrical energy into light. A toaster transforms it into heat.
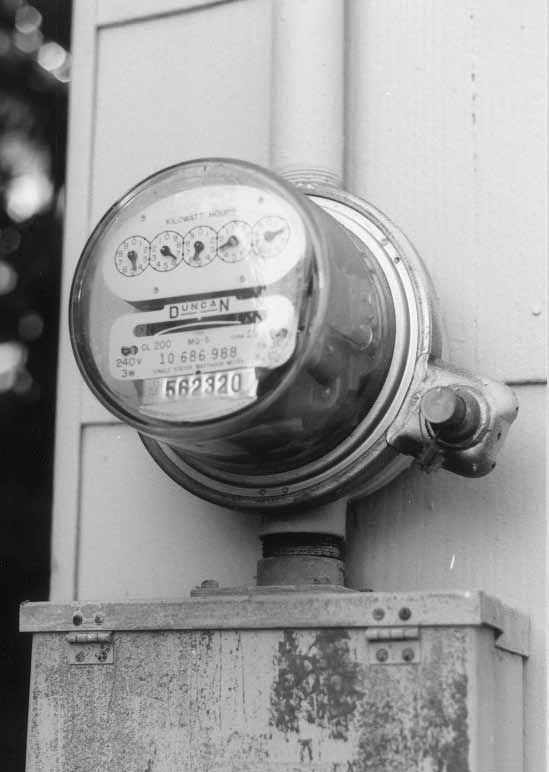
This style of electric meter has been in use by power companies for decades to determine how much electrical energy is used by every house, apartment, and public building in the country. It is made to be checked each month by a meter reader. As computers and automation become more widespread, you can expect changes in the look and operation of electric meters.

EU6.1. Investigation: Electric Metering
The purpose of this investigation is to see how your home electric meter responds to energy use in your home. Find the electric meter at home. The pointers on the dials move very slowly, but most meters have a disk that turns fast enough that you can easily see it spin. If your meter is the kind with a spinning disk, try these simple experiments.
Go through your home and turn off as many of the electrical appliances as you can. It is best to do this during daylight hours. Also, check with the other people at home to make sure you do not turn off the oven while the souffle is cooking or otherwise interfere with their use of electricity. It will probably be okay to unplug the refrigerator for a few minutes. Now check the meter.
- Is the disk turning more slowly?
- Did you make it stop?
If not, can you think of appliances in your house that may still be using electricity? Now you can plug in the refrigerator, reset all the clocks, make sure the pump in the fish tank is working again, and do whatever else is needed to get your household back in order. Another quick experiment may require a helper. Watch the electric meter while someone turns a light.
- Can you see the meter speed up when the light goes on?
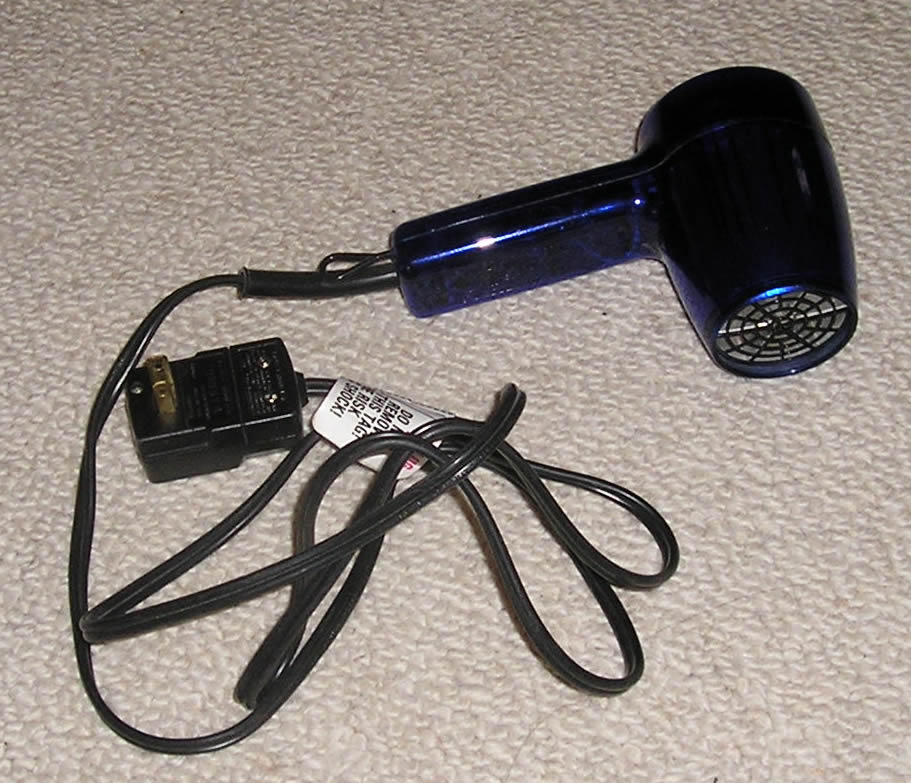
Try it with a higher wattage (more powerful) appliance such as a toaster, hair dryer
Question 6.15
What happens to the energy that runs a computer, a clock, or a vacuum cleaner?
EU6.2. Investigation:
What Are We Paying For?
Determine the costs of various home uses of electricity, learn what your biggest electricity eaters are, and find out where the money goes.
| The energy E (in watt-hours) an appliance uses is its wattage P (in watts) times the amount of time T (in hours) it is on. E = P x T | The power P (in watts) of any electrical device is the product of the voltage V (in Volts) and the current I (in amperes). P = V x I |
Materials
• A household electric bill for the month
Strategies for Investigation
- Prepare a table with five columns like the sample below. In column 1 list all the electrical appliances in your home. Group the appliances in categories such as heating, lighting, food preparation, washing clothes, power tools, entertainment. Make the list as complete as you can.
- In column 2 list the power rating, in watts, of each device. Most of them have a power rating label on the back or bottom. If the rating is given in amperes for a wall-socket appliance, you must multiply the ampere rating by 120 volts to figure out the power rating in watts.
- In column 3 estimate the average number of hours per day the device is on. A clock would be on all the time. Some devices like a heater or refrigerator are plugged in all the time but switch on and off automatically. Three hours a day is about right for most household refrigerators. For items that are not used every day, estimate the use for a week and divide by 7.
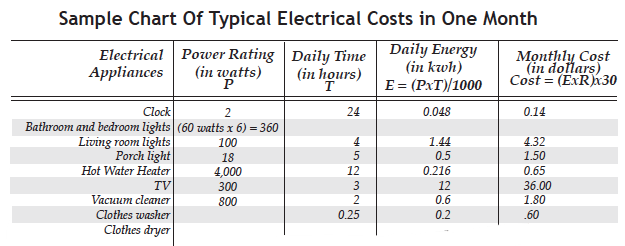
- Column 4 is for the energy used by each device each day. Find the energy by multiplying the power (P) and the time (T) for each appliance. That gives you energy in watt-hours. Divide by 1,000 to get kilowatt-hours.
- Column 5 is for the monthly energy cost. Find out the cost or rate (R) that you pay per kilowatt-hour by looking at an electricity bill. For each appliance, multiply the energy usage by the cost per kilowatt-hour to obtain the actual cost of each item per day. Multiply by 30 to get the monthly cost.
Analysis of Results
- Add up the costs for the appliances you listed to get an idea of your monthly electrical costs. Does it nearly match your electric bill? If not, modify your estimates until you have a reasonable idea of costs for each category of energy use.
- Which items and categories of appliances were the biggest electricity eaters? Display the results as a bar graph or a pie chart. You need not include each small item separately, for instance all light bulbs and lamps can be lumped together.
- Based on your analysis, can you make any recommendations about how to save money on energy costs?
-|-
EU6.3. Investigation: Power Failure
The light goes out unexpectedly. Did the light bulb burn out? A peek out the window shows that all the lights in the neighborhood are out. Earthqvuake? Lightning? Flood? Equipment failure? Human error? All of those factors can lead to electric power outages. Some outages last for moments, some much longer. Imagine a major disaster that leaves your town without electric power for a whole week.
- How would your life be different each day?
- What conveniences would you do without?
- What energy sources would you use in place of electricity?
Write a story about “A week without energy,” possibly in the form of a diary or journal. The story should tell about how your life was disrupted by the loss of electrical power, and how you coped with it.
IX. Conclusion
The energy crisis of the 1970s showed that people can conserve without a decline in the Gross National Product. Some energy-saving strategies require changes in our habits. Recycling, for example, requires you to be conscious of the materials you use and where they go when you are done with them.
The next three chapters discuss how energy is used in lighting, heating, and cooling, and transportation. You will read about several strategies for saving energy in each of these areas. As you come across each energy-saving strategy consider the following questions:
- Am I already doing this? Are other people I know doing this?
- Would a change in life-style be necessary to save energy this way?
- If a change in life-style is necessary, are there other benefits besides saving energy? What are the drawbacks?
Sources of energy data:
- International Energy Agency – Statistics – https://www.iea.org/data-and-statistics
- International Renewable Energy Agency – http://www.irena.org
- United Nations – Energy Statistics – https://unstats.un.org/unsd/energy
- United States Energy Information Administration – https://www.eia.gov
- World Bank – Energy – http://www.worldbank.org/en/topic/energy
- World Energy Council – https://www.worldenergy.org