
EF7C. Stay Current—What Causes Thunderstorms and Tornadoes?
-•-
2025-10-27. Building Better Weather Networks. By Grace van Deelen, Eos/AGU. Excerpt: A lack of weather data often leaves African communities vulnerable. Convergent efforts to improve observational networks throughout the continent are slowly filling the gaps. Lake Victoria, Africa’s largest lake, supports a quarter of East Africa’s population with fish, fresh water, and critical transportation routes. It’s also one of the deadliest bodies of water in the world. Storms, high winds, and waves frequently capsize boats, causing thousands of deaths each year. Despite the hazard, Lake Victoria has historically lacked enough weather observation stations to provide a clear picture of weather patterns in the region. …In 2017, the World Meteorological Organization (WMO), the weather agency of the United Nations, began a multiyear effort to improve weather information for the lake and establish early-warning systems for life-threatening storms. Now, much of the lakeside population uses the program’s tailored forecasts, leading to an estimated 30% reduction in weather-related deaths on the lake. …In 2006, Oregon State University hydrologist John Selker …and his colleague at the Delft University of Technology, Nick van de Giesen, brainstormed a solution: a low-cost weather station that could transmit meteorological and hydrological data over cell networks. They called their new project the Trans-African Hydro-Meteorological Observatory, or TAHMO. … the world should think of improvements in Africa’s observational networks not just as assistance to Africa but as a global public good. The world is dependent on African meteorological agencies for accurate forecasts everywhere…. It’s as much as 20 times more valuable to install a single station in a data-poor area of Africa than to add one to a European network…. Full article at https://eos.org/features/building-better-weather-networks.
2025-04-21. The New Tornado Alley Has Been Hyperactive this Year. By Mark Fischetti, Scientific American. Excerpt: By last Saturday, the National Weather Service reported that 552 tornadoes had occurred in the U.S. this year—well above the average total of 337 for the period of January through April in 1991–2020. Then an outbreak struck Texas and Oklahoma on Saturday night, killing at least three people. Parts of those two states were at the center of the twister-prone “tornado alley” for most of the 1900s, but this well-known corridor has been shifting steadily eastward in the past three and a half decades. This year many of the touchdowns that caused deaths occurred in Mississippi, Alabama and Tennessee, all east of the old alley. Why does the U.S. have so many tornadoes? Far more tornadoes strike the U.S. than any other country, and this is because of its geography. Wet, westerly winds from the Pacific Ocean become dry as they pass over the the Rocky Mountains, then become high and cool as they blow farther east. Meanwhile warm, humid air streams northward from the Gulf of Mexico, moving at a lower elevation. Flat terrain along these paths allows the two streams to run into each other. The angles at which they collide tend to create unstable air and wind shear—two big factors that favor tornado formation. …Why is tornado alley sliding eastward? Most tornadoes are created by a supercell—a strong thunderstorm with a rotating updraft of air. Supercells tend to form when warm, humid, low-level air interacts with cool, dry, higher air. And climate change is now generating more of that warmer, moister air. Tornadoes also are more likely to develop when the local atmosphere is unstable, and warming increases instability. Climate change is warming the Gulf of Mexico as well, and this can send generous amounts of water vapor into the southeastern U.S.—farther east than it tended to travel decades ago. In addition, climate change has moved the rough north-south boundary between dry western U.S. air and moist, eastern U.S. air about 140 miles to the east…. Full article at https://www.scientificamerican.com/article/the-new-tornado-alley-has-been-hyperactive-this-year.
2025-04-10. Tornadoes. By authors of Eos/AGU. A collection of Eos/AGU articles about tornadoes, including The Surprising Factor Making the United States a Tornado Hot Spot (2024 Aug 16), Is It Climate Change? Americans Mostly Say Yes (2024 Jun 18), Tornadoes’ Fastest Winds Howl Close to the Ground (2023 Apr 3), A Hotter Earth Means Stronger Tornadoes (2021 Dec 13), Rise in Tornado Numbers per Outbreak May Not Be Tied to Warming (2016 Dec 7), Understanding How Climate Change Could Affect Tornadoes (2014 Nov 11)….
2024-10-09. What causes the windless doldrums that strand sailors? Find upends previous thinking. By Hannah Richter, Science. Excerpt: Water, water, every where, And all the boards did shrink; Water, water, every where, Nor any drop to drink. …Although Samuel Taylor Coleridge encapsulated the phenomenon [doldrums] in the poem quoted above, 1834’s “The Rime of the Ancient Mariner,” scientifically, doldrums have largely been ignored and the textbook explanation for them taken at face value. …Julia Windmiller, an atmospheric physicist …mapped the tropical wind speeds and rainfall recorded by the buoys and analyzed how doldrum events evolved over hours, days, and weeks. The result, published recently in Geophysical Research Letters, revealed a big flaw in the conventional explanation: Averaged over long timescales of days or weeks, the doldrums appear to coincide with big rainstorms. But in reality, over short, hourlong timescales, the rain and windless episodes occur separately. It turned out a clue had been hiding in Coleridge’s poem all along. Stranded sailors were usually dry, not wet: That means the standing theory for the doldrums is backward, Windmiller says. Although rainfall generally depends on rising parcels of moist air, she explains, the doldrums are better described by sinking masses of air…. Full article at https://www.science.org/content/article/what-causes-windless-doldrums-strand-sailors-find-upends-previous-thinking.
2024-08-07. Warm Air and Warm Oceans Power Storms Like Debby. By Raymond Zhong, The New York Times. Excerpt: Tropical Storm Debby’s time back at sea on Wednesday was helping it recharge somewhat before it was expected to drift back onto the South Carolina shore overnight, according to the National Hurricane Center. The ocean provides storms like Debby with two key ingredients they need to pack a wallop: warm water and moist air. There’s plenty of moisture in the air off the Southeastern coast right now because both the seawater and the air above it have been unusually warm. The warmer the water, the more it evaporates, sending moisture into the air. And the warmer this air is, the more moisture it can take up. Bottom line: Warm seas and warm air help make for stronger storms. …Worldwide, the amount of water vapor in the atmosphere has increased by about 2 percent per decade since the early 1990s, according to a study published in May…. Full article at https://www.nytimes.com/2024/08/07/climate/warm-air-oceans-power-storms.html.
2024-07-24. The Sahara Desert helps keep hurricanes in check—for now. About research by LAIYIN ZHU et al, Science. In the Atlantic, …Warm air from an ordinary thunderstorm has absorbed heat from tepid seawater and begun churning—the birth of a hurricane. But, whether the storm will be a sprinkle or deluge when it makes landfall depends largely on how dusty it is, according to a new study. Wind strips dust from the Sahara Desert, bringing it westward across the Atlantic. These plumes of dirt-laden air provide marine life with nutrients and can affect air quality half a world away. And they’re known to be a wet blanket for growing hurricanes—or, more accurately, a dry one . The lack of moisture, shearing winds, and even the dust itself—by reflecting warming solar rays—can squelch a would-be storm. But it turns out that’s only true if there’s enough dust. When there’s too little, the particles act as nucleation seeds for clouds, boosting the storm’s deluge and the damage it causes when it comes ashore, researchers reported this week in Science Advances. “Surprisingly, the leading factor controlling hurricane precipitation is not, as traditionally thought, sea surface temperature or humidity in the atmosphere. Instead, it’s Sahara dust,” said study co-author Yuan Wang in a statement…. Paper at https://www.science.org/doi/10.1126/sciadv.adn6106.
2023-12-02. 2023 Hurricane Season Ends, Marked by Storms That ‘Really Rapidly Intensified’. [https://www.nytimes.com/interactive/2023/12/02/us/hurricane-season-2023-rapid-intensification.html] By William B. Davis and Judson Jones, The New York Times. Excerpt: The 2023 hurricane seasons in the Atlantic and Eastern Pacific came to an end this week, with both basins experiencing an above average number of storms, fueled by extremely warm ocean temperatures. The two basins had a combined 37 storms, 13 of which rapidly intensified, sometimes jumping multiple hurricane categories in less than a day. A high proportion of rapid-onset storms this year exceeded the standard definition of rapid intensification — an increase of at least 35 miles per hour in sustained winds, over 24 hours. Experts said that this emphasized the way hurricane seasons are changing and the need for more reliable forecast models. When storms intensify abruptly near land, it becomes more difficult to predict how severely places will be affected, and it leaves officials and residents with little time to prepare. Newer and more specific hurricane intensity models, like the Hurricane Analysis and Forecast System (HAFS), helped experts forecast some of this rapid strengthening, but some storms still caught meteorologists by surprise. In one major hurricane, at least 50 people died because conditions worsened precipitously in a matter of hours….
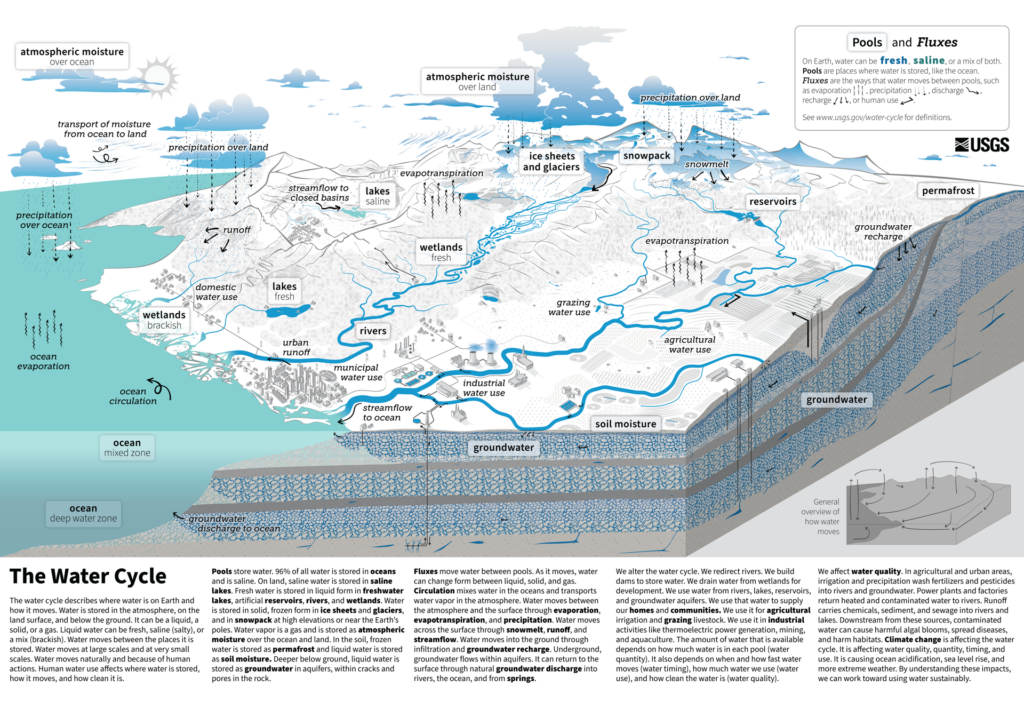
2022-10-13. Not Your Childhood Water Cycle. [https://eos.org/articles/not-your-childhood-water-cycle] By Jenessa Duncombe, Eos/AGU. Excerpt: The USGS just debuted a complete remaking of the water cycle diagram—with humans as headliners. …The U.S. Geological Survey (USGS) water cycle diagram is still used by hundreds of thousands of students in the United States and worldwide. It’s also the basis for many, many spin-off diagrams. Today, the agency released a new diagram for the first time in more than 20 years, this time with humans as showrunners. Although people have long siphoned water from groundwater and diverted rivers into farm fields and industrial plants, the new diagram is the first time humans have been included in what was presented until now as a “natural” cycle. The change reflects the latest 20 years of research uncovering humanity’s central role in the cycle and how to communicate it visually.… For GSS Energy Flow chapter 7.
2022-09-05. The Hunt for Big Hail. [https://www.nytimes.com/2022/09/05/science/hail-weather-climate.html] By Oliver Whang, The New York Times. Excerpt: …the hailstone Mr. Scott collected in 2010, … measured eight inches across and weighed nearly two pounds, …. …scientists from Western University in London, Ontario, collected a giant hailstone …measured five inches across and weighed a little more than half a pound…. …records set in the past couple of years, including Alabama’s in 2018 (5.38 inches long, 0.612 pounds), Colorado’s in 2019 (4.83 inches, 0.53 pounds) and Africa’s in 2020 (around seven inches long, weight unknown). Australia set a national record in 2020, then set it again in 2021. Texas’ record was set in 2021. In 2018, a storm in Argentina produced stones so big that a new class of hail was introduced: gargantuan. Larger than a honeydew melon. …the record-setting has come with increased hail damage. Although the frequency of reported “hail events” in the United States is at its lowest in a decade, according to a recent report by Verisk, a risk assessment firm, insurance claims on cars, houses and crops damaged by hail reached $16.5 billion in 2021 — the highest ever. Hail can strip plants to the stem and effectively total small cars. Ten years after the record-setting storm in Vivian, the tin roofs of some buildings are still dented. On Wednesday, a hailstorm killed a toddler in the Catalonia region of Spain. “It’s one of the few weather hazards that we don’t necessarily build for,” said Ian Giammanco, a meteorologist at the Insurance Institute for Business & Home Safety. “And it’s getting bigger and worse.” Although the changing climate probably plays a role in these trends, weather experts say, a more complete explanation might have something to do with the self-stoking interplay of human behavior and scientific discovery. As neighborhoods sprawl into areas that experience heavy hail and greater hail damage, researchers have sought out large hailstones and documented their dimensions, stirring public interest and inviting further study.…
2022-05-12. Violent storms blast Upper Midwest with hurricane-force winds, dust. By Matthew Cappucci and Jason Samenow, The Washington Post. Excerpt: WATERTOWN, S.D. — A violent complex of storms roared through the Upper Midwest on Thursday evening, unleashing destructive wind gusts over 100 mph while stirring up a towering wall of dust. …The dust cloud swept up by the storm produced scenes reminiscent of the Dust Bowl of the 1930s. Technically called a “haboob,” it swallowed entire communities as the storm complex, racing northeast at breakneck speeds of 65 to 85 mph, turned day into night. …Producing widespread damage along an extensive path, the storm complex met some criteria of a derecho — the meteorological term for an arcing, fast-moving line of violent storms whose damage can be comparable to a hurricane. …As of 11 a.m. Eastern time Friday, the Weather Service’s Storm Prediction Center had received 59 reports of winds gusting over 74 mph. second most on record for a calendar day. The record holder for the most 74-plus mph gusts occurred less than six months ago: Dec. 15, 2021. …As with the violent thunderstorm and tornado outbreaks in December, the intensity of this event raises questions about the possible role of human-caused climate change. The December outbreaks were similarly fueled by record-breaking temperatures, which climate change makes more probable.… [https://www.washingtonpost.com/weather/2022/05/12/derecho-dust-storm-southdakota-minnesota/]
2022-05-06. An Unprecedented View Inside a Hurricane. By Gregory R. Foltz, Chidong Zhang, Christian Meinig, Jun A. Zhang and Dongxiao Zhang, Eos/AGU. Excerpt: To improve future tropical cyclone forecasts, researchers sent a remotely operated saildrone into the extreme winds and towering waves around the eye of a category 4 hurricane.… [https://eos.org/features/an-unprecedented-view-inside-a-hurricane]
2022-01-31. World record 477-mile-long lightning ‘megaflash’ confirmed over U.S.. By Matthew Cappucci, The Washington Post. Excerpt: The World Meteorological Organization also certified a flash over South America that lasted a record 17 seconds… [https://www.washingtonpost.com/weather/2022/01/31/world-record-lightning-megaflash-us/]
2021-05-13. [https://eos.org/articles/forecasters-navigate-a-highway-to-success-around-lake-victoria] – Forecasters Navigate a Highway to Success Around Lake Victoria. Source: By Munyaradzi Makoni, Eos/AGU. Excerpt: …Four years of testing an early-warning system (EWS) to inform fisherfolk in East Africa of approaching high-impact weather events on Lake Victoria recently concluded. The High Impact Weather Lake System (HIGHWAY) project successfully demonstrated how improved weather, water, and climate services can save lives and livelihoods, as well as support socioeconomic development of vulnerable communities. …Lake Victoria’s size (it is the world’s second-largest freshwater lake, behind only Lake Superior in North America) allows it to generate its own weather patterns, sometimes suddenly and with human and economic casualties. According to its website, HIGHWAY aimed to “enhance the resilience of African people and economic development to weather and climate related shocks, with an initial focus on the Lake Victoria Basin.” The project was funded by £4.5 million from the U.K. Department for International Development, under Weather and Climate Information Services for Africa….
2019-10-18. NASA’s Eyes on Extreme Weather. By Ota Lutz, NASA-JPL. Excerpt: An extreme weather event is something that falls outside the realm of normal weather patterns. …NASA uses airborne and space-based platforms, in conjunction with those from the National Oceanic and Atmospheric Administration, or NOAA, to monitor these events and the ways in which our changing climate is contributing to them. …NASA makes this data available to the public, and students can use it to understand extreme weather events happening in their regions, learn more about weather and climate in general, and design plans for resilience and mitigation. …Global climate change…has had observable effects on the environment. Glaciers have shrunk, ice on rivers and lakes is breaking up and melting earlier in the year, precipitation patterns have changed, plant and animal habitat ranges have shifted, and trees are flowering sooner, exposing fruit blossoms to damaging erratic spring hail and deadly late frost. Effects that scientists had predicted in the past are now occurring: loss of sea ice, accelerated sea level rise, shifting storm patterns and longer, more intense heat waves. Some of the most visible and disruptive effects of global climate change are extreme weather and resulting disasters such as wildfires and flooding. …Southwest United States and parts of Central and South America, Asia, Europe, Africa and Australia [are] experiencing more heat, drought and insect outbreaks that contribute to increased wildfires. …coastal areas of the United States and many island nations, are experiencing flooding and salt water intrusion into drinking water wells as a result of sea level rise and storm surges from intense tropical storms. …Midwestern and Southern United States, have been inundated with rain that has resulted in catastrophic flooding. Temperatures, rainfall, droughts, high-intensity hurricanes and severe flooding events all are increasing and projected to continue as the world’s climate warms, according to the National Climate Assessment…. [https://www.jpl.nasa.gov/edu/news/2019/10/18/nasas-eyes-on-extreme-weather/]
2020-09-18. With #Alpha, 2020 Atlantic tropical storm names go Greek. By NOAA. Excerpt: Having reached the end of the alphabetical list of 21 Atlantic tropical storm names for 2020 with Tropical Storm #Wilfred today, the naming protocol for all subsequent storms will now consist of names pulled from the Greek alphabet as decided by the World Meteorological Organization. …This is only the second time the Greek alphabet has been used to name storms. The first was during the 2005 hurricane season, where the last named storm was Zeta…. [https://www.noaa.gov/news/with-alpha-2020-atlantic-tropical-storm-names-go-greek]
2020-02-10. Africa, a Thunder and Lightning Hot Spot, May See Even More Storms. By Shola Lawal, The New York Times. Excerpt: Africa is experiencing bigger and more frequent thunderstorms as global temperatures rise, according to researchers at Tel Aviv University. …meteorologists wondered at the time whether thunderstorms were becoming more common in Africa in the era of climate change. The answer, according to the new research, published in January in the American Meteorological Society’s Journal of Climate [https://journals.ametsoc.org/doi/abs/10.1175/JCLI-D-18-0781.1], is yes. An increase in temperatures in Africa over the past seven decades correlates with bigger and more frequent thunderstorms, the researchers found…. [https://www.nytimes.com/2020/02/10/climate/lightning-africa-climate-change.html]
2019-12-27. What Do You Get When You Cross a Thunderstorm with a Wildfire? By Jenessa Duncombe, Eos/AGU. [https://eos.org/articles/what-do-you-get-when-you-cross-a-thunderstorm-with-a-wildfire] Excerpt: There are few things more ominous than a looming thundercloud. Add a wildfire to the mix, and the result can be a towering tempest of thick smoke, smoldering embers, and superheated air. Fire-fueled thunderstorms are naturally occurring weather systems that sometimes spin up as a result of smoke and heat billowing from intense wildfires. These extreme storms, called pyrocumulonimbus (pyroCb), occur infrequently, but when they do they can lead to tragic results. The Making of a Fire Storm [:] Wildfires give off intense heat, forcing large amounts of smoke and hot air to rise. As the mixture moves higher into the troposphere—the lowest layer of Earth’s atmosphere—it cools and expands as the air pressure drops. Moisture in the air soon condenses, forming big puffy clouds called pyrocumulus clouds. When conditions in the atmosphere are just right—including a hot, dry layer of air near the ground and a cooler, wetter layer above it—the atmosphere can become convectively unstable. Increasingly turbulent air sets water droplets and ice crystals in pyrocumulus clouds on a collision course, building up an electrical charge and turning the system into a towering thunderhead. The soaring pyroCbs, which rarely produce rain on the ground even though they are thunderstorms, can even rise out of the troposphere and extend into the stratosphere tens of kilometers above the surface. …A pyroCb that formed during the Carr Fire near Redding, Calif., in 2018 had such strong winds that it created a tornado-strength fire vortex, and a pyroCb in Canberra, Australia, in 2003 was so extreme that it released a torrent of black hail and turned the daytime sky as dark as night. Fortunately, these events are still relatively rare, although recent research from Australia suggests that climate change may cause conditions there to become more favorable for the formation of pyroCbs in the future….
2019-11-01. In the Blue Holes of the Bahamas, Secrets of Hurricanes Past. By Katherine Kornei, The New York Times. Excerpt: Scientists assembled a 1,500-year history of big storm activity by retrieving sediment from the island country’s submarine caverns. … researchers have assembled a 1,500-year history of hurricanes in the Bahamas, based on sand and shell fragments pulled up from submarine caverns known as blue holes. Their results, published in October in Paleoceanography and Paleoclimatology [https://agupubs.onlinelibrary.wiley.com/doi/abs/10.1029/2019PA003665], show that hurricane activity has varied over time. In fact, recent hurricane activity in the Bahamas has been low compared with historical highs, despite intense activity elsewhere in the Atlantic arena. The fluctuations are likely driven by changes in atmospheric and oceanic circulation and volcanism, the scientists suggest. … Cooler ocean surface temperatures have been linked to reduced hurricane activity…..
2019-10-17. Northeast ‘Bomb Cyclone’: Powerful Winds Knock Out Power to 500,000. By Ellen Barry, The New York Times. [https://www.nytimes.com/2019/10/17/us/northeast-bomb-cyclone.html] Excerpt: BOSTON — Utility poles snapped, cruise ships sought shelter, boats broke from their moorings, trees were uprooted, and more than 500,000 customers in New England were without power at times on Thursday as a storm packing winds gusting to 90 miles an hour swept up the East Coast. Meteorologists described the storm as a “bomb cyclone,” sometimes known as a “winter hurricane,” which occurs when atmospheric pressure drops especially dramatically — by 24 millibars in 24 hours. A bomb cyclone can happen when a mass of warm air meets with a mass of cold air, and the air starts to move, with the rotation of the earth creating a cyclonic effect. …The highest winds, of 90 miles an hour, were recorded early Thursday in Provincetown, Mass., and gusts of 70 and 80 miles an hour buffeted parts of Cape Cod….
2019-05-28. Kansas City-Area Tornadoes Add to 12 Straight Days of Destruction. By Kevin Williams and Alan Blinder, The New York Times. [https://www.nytimes.com/2019/05/28/us/tornadoes-usa.html] Excerpt: …Now the severe weather had come to Celina, a city of about 10,000 people about 60 miles northwest of Dayton, causing the kind of devastation that has left state after state with ruined buildings and grieving families this spring. In the last week alone, the authorities have linked tornadoes to at least seven deaths and scores of injuries. Federal government weather forecasters logged preliminary reports of more than 500 tornadoes in a 30-day period — a rare figure, if the reports are ultimately verified…. The barrage continued Tuesday night, as people across the Midwest took shelter from powerful storms. A particularly destructive storm splintered homes, ripped up trees and downed power lines southwest of Kansas City. One tornado hit the outskirts of Lawrence, Kan., home to the University of Kansas. The worst damage was reported in nearby Linwood. Twelve people were taken to Lawrence Memorial Hospital with injuries, including broken bones and lacerations from glass…. On the East Coast, tornado and severe thunderstorm warnings were issued in parts of northern New Jersey and on Staten Island in New York. …Tuesday was the 12th consecutive day with at least eight tornado reports, breaking the record, according to Dr. Marsh. The storms have drawn their fuel from two sources: a high-pressure area that pulled the Gulf of Mexico’s warm, moist air into the central United States, where it combined with the effects of a trough trapped over the Rockies, which included strong winds. …Climate change is increasingly linked to extreme weather, but limited historical information, especially when compared with temperature data that goes back more than a century, has made it difficult for researchers to determine whether rising temperatures are making tornadoes more common and severe. …researchers have found that tornadoes are increasingly clustered in short periods of time….
2019-02-14. Modern Weather Forecasts Are Stunningly Accurate. By Robinson Meyer, The Atlantic. Excerpt: The polar vortex is just the latest example of how reliable five-day forecasts have become. … It is dangerous, record-breaking, can’t-look-away weather. Yet this cold snap’s arrival was preceded by a marvel so spectacular that we hardly noticed it: It was correctly predicted. As early as a month ago, forecasters knew that colder-than-average weather would likely strike North America this month; a week ago, computer models spit out some of the same figures that appeared on thermometers today. …“A modern five-day forecast is as accurate as a one-day forecast was in 1980,” says a new paper, published last week in the journal Science. “Useful forecasts now reach nine to 10 days into the future.”… See also How far out can we forecast the weather? Scientists have a new answer [https://www.sciencemag.org/news/2019/02/how-far-out-can-we-forecast-weather-scientists-have-new-answer] by Paul Voosen, Science Magazine, 2019-02-14
2019-01-25. Earth’s Devastating Power, Seen by Satellite. By Kimberly M. S. Cartier, Eos/AGU. [https://eos.org/features/earths-devastating-power-seen-by-satellite] Excerpt: Hurricanes, volcanoes, droughts, floods, fires, tsunamis: Satellites capture some of Earth’s most destructive forces. Earth-orbiting satellites can inspire awe of the beauty of our planet and provide breathtaking vantage points from which scientists can study its complicated dynamics. Satellites are cataloging Earth’s changing ice coverage, measuring water content inside leaves, monitoring air pollution, and tracking illegal fishing operations to protect marine ecosystems. These satellites are also a key resource for people who study natural disasters and those who respond to them. Governments and disaster relief agencies use satellite images and data to pinpoint areas that are at risk, track the progress of ongoing disasters, and monitor the impact on affected regions. Scientists use these data to study rare phenomena caused by intense conditions, refine models to predict future events, and inform policies that seek to minimize damage and save lives. These six images of recent natural disasters, all taken by Earth-orbiting satellites, demonstrate our planet’s raw power and show how satellite images and data can detect and monitor catastrophes around the world…. [Images are a “must see”]
2018-06-06. Hurricanes Are Lingering Longer. That Makes Them More Dangerous. By Kendra Pierre-Louis, The New York Times. Excerpt: With wind speeds that can top 180 miles per hour, hurricanes are not usually thought of as slow. Yet tropical cyclones, which include hurricanes, have grown more sluggish since the mid-20th century, researchers say. That may mean bad news for people residing in their path. A study published Wednesday in the journal Nature focuses on what is known as translation speed, which measures how quickly a storm is moving over an area, say, from Miami to the Florida Panhandle. Between 1949 and 2016, tropical cyclone translation speeds declined 10 percent worldwide, the study says. The storms, in effect, are sticking around places for a longer period of time. Lingering hurricanes can be a problem, as Texans learned last year when Hurricane Harvey stalled over the state, causing devastating flooding and billions of dollars of damage. The storm dropped more than 30 inches of rain in two days and nearly 50 inches over four days in some places. A report released this month by Harris County, which includes Houston, found that Harvey’s rainfall exceeded every known flooding event in American history since 1899. The really, really high rainfall totals were because the storm moved so slowly,” said Deanna Hence, a professor of atmospheric sciences at the University of Illinois at Urbana-Champaign…. https://www.nytimes.com/2018/06/06/climate/slow-hurricanes.html
2017-09-01. How an ocean climate cycle favored Harvey. By Julia Rosen, Science. Summary: Hurricane Harvey was the first major hurricane to make landfall in the United States since 2005, but in some ways, it was long overdue. For decades now, tropical storms have been getting a boost from a powerful but still mysterious long-term cycle in North Atlantic sea surface temperatures, which appears to be holding steady in its warm, storm-spawning phase. This cycle, called the Atlantic Multidecadal Oscillation (AMO), swings between warm and cool phases every 20 to 60 years, shifting North Atlantic temperatures by a degree or so and setting the backdrop for hurricane season. Since about 1995, the AMO has been in a warm state, but researchers aren’t sure where it’s headed next. The AMO has traditionally been attributed to natural shifts in ocean currents, and some think it’s on the cusp of shifting back toward a cool, quiescent phase. But others propose that human activities—a combination of declining air pollution and greenhouse warming—might prolong the current warm period, keeping hurricane activity high…. http://science.sciencemag.org/content/357/6354/853
2017-08-28. Hurricane Harvey provides lab for U.S. forecast experiments. By Paul Voosen, Science. Excerpt: For years, U.S. forecasters have envied their colleagues at the European Centre for Medium-Range Weather Forecasts (ECMWF) in Reading, U.K., whose hurricane prediction models remain the gold standard. Infamously, the National Weather Service (NWS) in 2012 failed to predict Hurricane Sandy’s turn into New Jersey, whereas ECMWF was spot on. But two innovations tested during Hurricane Harvey, one from NASA and another from the National Oceanic and Atmospheric Administration (NOAA), could help level the playing field. …Last week, GFDL [NOAA’s Geophysical Fluid Dynamics Laboratory] anxiously watched the developing storm to see how it compared with a test run of the next-generation model. On Thursday, a day prior to landfall, the experiment agreed with the European model that Harvey would plow inland, stall, then head back out over the Gulf of Mexico before making a second landfall near Houston, Texas. That progression, close to what’s happening, helps explain the sustained, catastrophic rainfall that has battered the Texas coast. The GFDL model, called FV3, also correctly forecasted that Harvey would develop a double eyewall—a second circular band of storms around the band enclosing the eye. The model’s zoomed-in view also predicted the extreme rainfall totals seen by Houston some 5 days in advance, says Shian-Jiann Lin, the GFDL scientist who led the development of the code powering FV3…. http://www.sciencemag.org/news/2017/08/hurricane-harvey-provides-lab-us-forecast-experiments
2017-06-27. How Shifting Winds Turn Tropical Storms into Hurricanes.By Emily Underwood, Earth & Space Science News (EoS, AGU). Excerpt: Wind is a fickle force, frequently changing speed and direction. When this variation occurs over a short distance, it is called wind shear. Such sudden reversals are the bane of airline pilots because they can cause planes to lose altitude or change course. They can also disrupt the structure and trajectory of tropical cyclones, rotating complexes of thunderstorms that can strengthen into hurricanes if their path is undisturbed. The more wind shear one of these storms encounters, the more likely it is to be thrown off balance, wobbling like a top as its spin weakens. …a recent study by Onderlinde and Nolan …used a modified version of the Weather Research and Forecasting Model with a high-resolution grid (points separated by 2 kilometers) centered on developing tropical cyclones. Within this model, wind shear could be incrementally adjusted over time while other aspects of the environment, such as temperature, moisture, and wind, remained in balance. First, the team allowed weak cyclones to grow into hurricanes in favorable environments. Then, they slowly turned up the wind shear…. https://eos.org/research-spotlights/how-shifting-winds-turn-tropical-storms-into-hurricanes
2016-03-11. Attribution of Extreme Weather Events in the Context of Climate Change. Authors: Committee on Extreme Weather Events and Climate Change Attribution; Board on Atmospheric Sciences and Climate; Division on Earth and Life Studies; National Academies of Sciences, Engineering, and Medicine.
2014-10-16. U.S. Sees Increase in Days with Multiple Tornadoes. Excerpt: …Since 1954, there has been a decrease in the number of days per year in the U.S. with any tornadoes, but an increase in the number of days with many tornadoes, according to a new study published in the 17 October issue of journal Science. “It was surprising to see,” said the study’s lead author Harold Brooks, senior research scientist at NOAA’s National Severe Storms Laboratory. “I would naively expect these trends to go in the same direction.” …Brooks and colleagues also observed that despite speculation climate change is causing more tornadoes, the overall number of tornadoes each year since 1954 has remained relatively constant. …Although the annual number of EF1 or greater tornadoes remained relatively constant over the period evaluated, the researchers did see that tornadoes have been clustering more since the 1970s. A single day in April 2011, for example, featured 211 tornado events…. Meagan Phelan, AAAS. http://www.aaas.org/news/science-us-sees-increase-days-multiple-tornadoes.
2014-03-27. Two interesting resources have been added to chapter 7 of Energy Flow (http://www.globalsystemsscience.org/studentbooks/ef/ch7): (1) announcement from NASA Release 14-086(http://www.nasa.gov/press/2014/march/first-images-available-from-nasa-jaxa-global-rain-and-snowfall-satellite/#.UzHYa15GLHQ) of first images captured by the newest Earth-observing satellite, the Global Precipitation Measurement (GPM) Core Observatory including 3D representation of the structure of a storm; and (2) an interactive Earth display that allows you to select atmospheric properties – http://earth.nullschool.net/ – See the end of GSS Energy Flow chapter 7 (http://www.globalsystemsscience.org/studentbooks/ef/ch7)
2013-11-18. Midwest Tornadoes: Severe Storms Sweep Across 12 States, Killing 6. Excerpt: …Early Monday, Washington [IL] Mayor Gary Manier estimated that from 250 to 500 homes were either damaged or destroyed in the storm and that it wasn’t clear when residents would be allowed to return. …The unusually powerful late-season wave of thunderstorms brought damaging winds and tornadoes to 12 states: Michigan, Wisconsin, Iowa, Illinois, Missouri, Indiana, Ohio, Kentucky, Tennessee, West Virginia, Pennsylvania and western New York. …Illinois was the hardest struck with at least six people killed and dozens more injured. …Although about 80 reports of tornadoes had come in as of Sunday night, the National Weather Service’s Bunting said the actual number will likely be in the 30 to 40 range…because the same tornado often gets reported multiple times. Weather service meteorologist Matt Friedlein said such weather is rare this late in the year, but that strong winds coupled with temperatures in the 60s and 70s spawned Sunday’s storms…. http://www.huffingtonpost.com/2013/11/18/midwest-tornadoes_n_4294412.html. David Mercer and Don Babwin, Huffington Post.
2013-11-08. Study Finds Climate Link to ‘Atmospheric River’ Storms. Excerpt: new NASA-led study of “atmospheric river” storms from the Pacific Ocean may help scientists better predict major winter snowfalls that hit West Coast mountains and lead to heavy spring runoff and sometimes flooding. Atmospheric rivers — short-lived wind tunnels that carry water vapor from tropical oceans to mid-latitude land areas — are prolific producers of rain and snow on California’s Sierra Nevada mountains. …An atmospheric river is a narrow stream of wind, about a mile high and sometimes of hurricane strength. Crossing the warm tropical Pacific in a few days, it becomes laden with water vapor. A moderate-sized atmospheric river carries as much water as the Mississippi River dumps into the Gulf of Mexico in an average week. When the river comes ashore and stalls over higher terrain, the water falls as snow or rain. “Atmospheric rivers are the bridge between climate and West Coast snow,” said [Bin Guan of the Joint Institute for Regional Earth System Science and Engineerin]. “If scientists can predict these atmospheric patterns with reasonable lead times, we’ll have a better understanding of water availability and flooding in the region.” The benefit of improving flood prediction alone would be significant. A single California atmospheric-river storm in 1999 caused 15 deaths and $570 million in damage. Guan’s team used data from the JPL-developed Atmospheric Infrared Sounder (AIRS) instrument on NASA’s Aqua satellite, …http://airs.jpl.nasa.gov…. http://www.nasa.gov/press/2013/november/study-finds-climate-link-to-atmospheric-river-storms/. NASA RELEASE 13-329.
2013-09-11. NASA Launches Drones from Virginia to Study Storms. Excerpt: ATLANTIC, Va. — NASA scientists are using former military surveillance drones to help them understand more about how tropical storms intensify, which they say could ultimately save lives by improving forecast models that predict a hurricane’s strength. The unmanned Global Hawk aircraft were designed to perform high-altitude, long-endurance reconnaissance and intelligence missions for the Air Force. …”The biggest scientific question we’re trying to attack is why do some hurricanes intensify very rapidly and why do others not intensify at all? …There are two questions on which NASA scientists primarily want the drone research to focus. One is what role thunderstorms within a hurricane play in its intensification. Researchers aren’t sure if the thunderstorms are a driver of storm intensity or a symptom of it. The other is what role the Saharan Air Layer plays in the tropical storm development. The Saharan Air Layer is a dry, hot, dusty layer of air from Africa. Scientists have been at odds with each other over whether it helps hurricanes strengthen or does the opposite…. http://www.weather.com/news/science/space/nasa-launches-drones-study-storms-20130911. Brock Vergakis, The Weather Channel.
2013-06-06. NASA Flights Target How Pollution, Storms and Climate Mix. Excerpt: …NASA aircraft will take to the skies over the southern United States this summer to investigate how air pollution and natural emissions, which are pushed high into the atmosphere by large storms, affect atmospheric composition and climate. …More than 250 scientists, engineers, and flight personnel are participating in the Studies of Emissions, Atmospheric Composition, Clouds and Climate Coupling by Regional Surveys (SEAC4RS) campaign. ….Aircraft and sensors will probe the atmosphere from top to bottom at the critical time of year when weather systems are strong enough and regional air pollution and natural emissions are prolific enough to pump gases and particles high into the atmosphere. The result is potentially global consequences for Earth’s atmosphere and climate. “In summertime across the United States, emissions from large seasonal fires, metropolitan areas, and vegetation are moved upward by thunderstorms and the North American Monsoon,” Toon said. “When these chemicals get into the stratosphere they can affect the whole Earth. They also may influence how thunderstorms behave. With SEAC4RS we hope to better understand how all these things interact.” SEAC4RS will provide new insights into the effects of the gases and tiny aerosol particles in the atmosphere. The mission is targeting two major regional sources of summertime emissions: intense smoke from forest fires in the U.S. West and natural emissions of isoprene, a carbon compound, from forests in the Southeast. Forest fire smoke can change the properties of clouds. The particles in the smoke can reflect and absorb incoming solar energy, potentially producing a net cooling at the ground and a warming of the atmosphere. The addition of large amounts of chemicals, such as isoprene, can alter the chemical balance of the atmosphere. Some of these chemicals can damage Earth’s protective ozone layer. For more information on the mission, visit: http://espo.nasa.gov/missions/seac4rs ….http://www.nasa.gov/home/hqnews/2013/jun/HQ_13-167_SEAC4RS_Campaign.html. NASA Release 13-167.
2012 March. Predicting and managing extreme weather events.
by Jane Lubchenco and Thomas R. Karl. Physics Today, p. 31. Earth’s climate is warming, and destructive weather is growing more prevalent. Coping with the changes will require collaborative science, forward-thinking policy, and an informed public.
2011 April 25. Tornado Season Intensifies, Without Clear Scientific Consensus on Why. By A.G. Sulzberger, The New York Times.
Excerpt: All the warning sirens echoing across the Great Plains, Midwest and Southeast this month leave little doubt that the tornado season — which has plowed a trail of destruction through communities from Oklahoma to Wisconsin to Georgia — is off to an unusually busy start…Now, as the country braces for several more days of potentially violent weather, meteorologists say the number of April tornadoes is on track to top the current record…
It remains unclear, partly because of the lack of historical data and partly because of their unpredictable nature, whether they will increase in number or strength or geographic range.
2008 Apr 15. Measuring a Hurricane by Sound Underwater. By HENRY FOUNTAIN, NY Times. Excerpt: There are a couple of ways to forecast the destructive potential of a hurricane so that people in harm’s way can take adequate precautions. Satellite images of cloud patterns can be analyzed to estimate peak wind speeds, but the estimates are often way off the mark. Specialized aircraft can fly into a storm to measure the winds directly, but the flights are costly. Researchers at the Massachusetts Institute of Technology propose a third way: listening to a storm underwater.
In a paper to be published in Geophysical Research Letters, Nicholas C. Makris and a former graduate student, Joshua D. Wilson, report a strong correlation between the intensity of sound recorded by an undersea microphone in the mid-Atlantic and the wind power of a hurricane that passed over it. They say that such microphones, known as hydrophones, could be a safe and relatively inexpensive means of estimating hurricane force….
2007 November 5. To show how insolation is affected by latitude. From: Stephen J. Edberg
… to show how insolation is affected by latitude: Take a pair of thermometers, each taped to some cardboard, outside on a sunny day. Prop one up so that the cardboard’s plane is normal to the direction of the Sun. Lay the other one on the ground. Give them a chance to equalize: the propped thermometer will be much warmer than the one on the ground.
Caveats: This demonstration is much more effective on cold sunny days than on warm sunny days. It is better done early or late in the day when the Sun is closer to the horizon, not around noon.
You can actually do this indoors on a rainy day if you use a good spotlight or projector, equidistant from the two thermometer bulbs. If you have some small thermometers you can tape them to different latitudes on a globe and try the experiment with a spotlight, projector, or desk lamp. (Make sure you use a tungsten bulb, not fluorescent or LED.)
2007 May 29. Will Warming Lead to a Rise in Hurricanes? By CORNELIA DEAN. NY Times. Excerpt: When people worry about the effects of global warming, they worry more about hurricanes than anything else. In surveys, almost three-quarters of Americans say there will be more and stronger hurricanes in a warming world. By contrast, fewer than one-quarter worry about increased coastal flooding. …Researchers hope to better predict storms like Katrina…. There is no doubt that as the world warms, seas will rise, increasing the flood risk, simply because warmer water occupies more space. (And if the Greenland or Antarctic ice sheets melt, the rise will be far greater.) It seems similarly logical that as the world warms, hurricanes will be more frequent or more powerful or both. After all, they draw their strength from warm ocean waters. But while many scientists hold this view, there is far less consensus, in part because of new findings on other factors that may work against stronger, more frequent storms. “Global warming is as real as it gets,” Richard A. Anthes, president of the University Corporation for Atmospheric Research, …. But as for its link to hurricanes, Mr. Anthes said, “I don’t think it’s been proved conclusively.” …One question meteorologists and climate experts can answer quickly is an obvious one: What happened to the hurricane season of 2006? Viewed from the perspective of the Atlantic and Gulf Coasts, it was a bust (or a boon). Not a single hurricane struck the United States. But last year a persistent Bermuda high, sitting unusually far out in the Atlantic, and air currents from an unexpected and quick-forming El Niño system … diminished the storms’ potential to strike the United States. …even though there were only slightly fewer named storms than average (9 instead of 11), about as many became hurricanes as on average (5 instead of 6) and, as in an ordinary year, 2 hurricanes with winds of more than 111 miles per hour, the standard for Category 3 on the Saffir-Simpson Hurricane Scale.
…53 percent of Americans live within 50 miles of a coast….
2006 December 11. NASA AIRCRAFT CAPTURES WINDY DETAILS IN HURRICANE’S UPS AND DOWNS. NASA Earth Observatory News. – In 2005, scientists using NASA aircraft measured the internal structure of Hurricane Dennis, giving clues about the evolution of a hurricane’s warm inner core and other factors related to their formation.
2006 September 27. NASA LAUNCHES HURRICANE DATA PORTAL FOR SCIENTISTS, EDUCATORS, AND APPLICATION USERS – A new hurricane web portal is designed for viewing and studying hurricanes with a variety of measurements from satellite-based NASA instruments. NASA Earth Observatory.
2006 September 26. NASA TECHNOLOGY CAPTURES MASSIVE HURRICANE WAVES. NASA research is helping to increase knowledge about the behavior of hurricane waves that pose a serious threat to mariners and coastal communities. NASA Earth Observatory.
2006 September 19. Are humans causing stronger hurricanes? Excerpt: a continuing controversy … Are humans causing stronger hurricanes? A study released on September 11, 2006 ruled out “natural causes” as the primary reason why ocean waters have warmed where hurricanes form over the last 100 years. Tom Wigley, a climate scientist and study co-author, told Earth & Sky that “the changes cannot be caused by natural fluctuations, which just leaves human factors as the dominant cause.” Wigley said those human factors include greenhouse gases from burning fossil fuels. [http://www.earthsky.org/shows/show.php?date=20060918]
2006 September. The Gathering Storm. Catalyst Magazine, Union of Concerned Scientists. By Brenda Ekwurzel. Excerpt: By now, everyone has heard of the possible relationship between hurricanes and global warming. What does the science really tell us and what can we do about it? Rapid population growth in coastal regions has placed many more people and structures in the path of storms, increasing the potential for casualties, property damage, and financial hardship when these storms make landfall. And as reported by the media in the wake of hurricanes Katrina and Rita, global warming may be making matters worse. Recent scientific evidence suggests a link between the destructive power (or intensity) of hurricanes and higher ocean temperatures driven in large part by our changing climate.
…Scientists have recently looked at potential correlations between ocean temperatures and storm trends worldwide over the past several decades. One study, which combined each storm’s duration and maximum wind speed, found that the destructive power of storms has increased around 70 percent in both the Atlantic and Pacific Oceans over the last 30 years. Another study revealed that the percentage of hurricanes classified as Category 4 or 5 (the most intense storms) worldwide has increased over the same period, correlating with the concurrent rise in sea surface temperatures in the regions where storms typically originate ….
In a third independent approach, researchers analyzed surface wind and temperature records between 1958 and 2001 and confirmed the marked increase in storm intensity around the world. Still more studies are continuing to test the connection between storm intensity and warmer temperatures even as insurance agencies are revising their risk analysis for coastal regions…. [http://www.ucsusa.org/publications/catalyst/the-gathering-storm.html]
2005
23 June 2005. RELEASE: 05-159 NASA RESEARCHERS STUDYING TROPICAL CYCLONES
NASA hurricane researchers are deploying to Costa Rica next month to investigate the birthplace of eastern Pacific tropical cyclones. They will be searching for clues that could lead to a greater understanding and better predictability of one of the world’s most significant weather events -the hurricane…As scientists and coastal residents brace for another potentially challenging hurricane season, NASA is launching the Tropical Cloud Systems and Processes (TCSP) mission. TCSP is a month-long research effort primarily intended to document “cyclogenesis,” the birth of tropical storms, hurricanes and related phenomena…Researchers will monitor oceanic thunderstorms to study why some systems develop into tropical cyclones and some do not. Researchers feel the data is vital to understanding how such weather systems evolve and travel. The data also could support development of a more accurate and timely warning system to help safeguard property and lives…”This experiment is significant for two reasons,” said Robbie Hood, an atmospheric scientist at the Marshall Space Flight Center, Huntsville, Ala. She is one of three lead scientists for the project in Costa Rica. “We will have an opportunity to take a closer look at the factors contributing to the initiation and intensification of tropical cyclones which are still somewhat mysterious processes for researchers and operational forecasters. We will also be examining what are the best combinations of satellite and aircraft technologies to improve how hurricanes are monitored and predicted,” she said. [http://www.nasa.gov/home/hqnews/2005/jun/HQ_05_159_Costa_Rica_Hurricanes.html]
11 January 2005. NASA RELEASE: 05-015. Saharan Dust Affects Thunderstorm Behavior in Florida. Scientists using NASA satellite data have discovered tiny particles of dust blowing across the Atlantic Ocean from the Sahara Desert can affect Florida thunderstorms. Dust affects the size of the top or “anvil” of a thunderstorm, the strength and number of updrafts of warm winds. It also affects the strength of convective (heat generated) thunderstorms by influencing the amount of rain that builds up and falls. … The researchers found when saharan dust is in the air, the anvils produced by Florida’s convective thunderstorms tend to be a little smaller in area, but better organized and thicker. This affects the amount of incoming sunlight and warmth reaching the ground, potentially affecting long-term climate. If occurring over time, more sunlight and warmer temperatures would mean a warmer climate. The researchers also noticed the updrafts of warm moist air, which build into thunderstorms were stronger, and there were more updrafts produced in the presence of the dust…. Saharan dust can act as cloud condensation nuclei, giant cloud condensation nuclei and ice nuclei. Van den Heever ran two types of computer model simulations, one that included saharan dust and another without the desert dust. She then compared the results and found something unusual. The increased concentrations of cloud condensation nuclei due to the dust decreased the amount of rainfall at the Earth’s surface. [http://www.nasa.gov/home/hqnews/2005/jan/HQ_05015_saharan.html]
2004
14 January 2004. NASA RELEASE : 04-017. A ‘Hot Tower’ Above The Eye Can Make Hurricanes Stronger — They are called hurricanes in the Atlantic, typhoons in the West Pacific, and tropical cyclones worldwide; but wherever these storms roam, the forces that determine their severity now are a little less mysterious. NASA scientists, using data from the Tropical Rainfall Measuring Mission (TRMM) satellite, have found “hot tower” clouds are associated with tropical cyclone intensification. … a “hot tower” [is] a rain cloud that reaches at least to the top of the troposphere, the lowest layer of the atmosphere. It extends approximately nine miles (14.5 km) high in the tropics. These towers are called “hot” because they rise to such altitude due to the large amount of latent heat. … A particularly tall hot tower rose above Hurricane Bonnie in August 1998, as the storm intensified a few days before striking North Carolina… more than $1 billion damage and three deaths…. Kelley said, “The motivation for this new research is that it is not enough to predict the birth of a tropical cyclone. We also want to improve our ability to predict the intensity of the storm and the damage it would cause if it struck the coast.” [http://www.nasa.gov/home/hqnews/2004/jan/HQ_04017_stronger_hurricanes.html]
2003
17 December 2003. NASA STUDIES SHOW GLOBAL WARMING IS LIKELY TO DRIVE BIG CHANGES IN CALIFORNIA’S COASTAL WATERS — Global warming could have profound effects on the intensity and seasonal timing of wind-driven upwelling of deep ocean water along the California coast, impacting many coastal ecosystems, according to recent studies by researchers at the University of California, Santa Cruz.
30 September 2003. Observations of a “weekend effect” in diurnal temperature range, Piers M. de F. Forster and Susan Solomon , National Oceanic and Atmospheric Administration Aeronomy Laboratory, Boulder, CO 80305; and Department of Meteorology, University of Reading, Reading RG6 6AH, United Kingdom. Using surface measurements of maximum and minimum temperatures from the Global Daily Climatological Network data set, we find evidence of a weekly cycle in diurnal temperature range (DTR) for many stations in the United States, Mexico, Japan, and China….We conclude that the weekend effect is a real short time scale and large spatial scale geophysical phenomenon, which is necessarily human in origin. We thus provide strong evidence of an anthropogenic link to DTR, an important climate indicator. Several possible anthropogenic mechanisms are discussed; we speculate that aerosol-cloud interactions are the most likely cause of this weekend effect, but we do not rule out others. PNAS | vol. 100 | no. 20 | 11225-11230.
3 June 2003. Lightning Spies. In late April 2002, a cold front pushed eastward across the midwestern United States. Ahead of the cold front, a powerful thunderstorm formed over Maryland, spawning what was perhaps the state’s worst tornado. With winds estimated at over 260 miles per hour, the tornado touched down and traveled a path of destruction for 24 miles (39 kilometers), claiming several lives and injuring more than 100 people. The thunderstorm associated with this tornado persisted from the Appalachian Mountains to the Atlantic Ocean, causing an estimated $120 million in damages.
1998
August 1998. Hurricane Bonnie [1.2MB PDF NASA Lithograph] Few things in nature can compare to the destructive force of a hurricane. Called the greatest storm on Earth, a hurricane is capable of destroying coastal areas with sustained winds in excess of 155 mph, intense rainfall and a storm surge.
Non-chronological resources
Hurricanes
- NASA’s Earth Observatory page on Hurricanes: The Greatest Storms On Earth
- Public Information Map of Hurricanes and Cyclones – http://www.esri.com/services/disaster-response/hurricanes/latest-news-map
- Top 10 Most Damaging Hurricanes in the US – http://storymaps.esri.com/stories/2012/top-ten-hurricanes/
- Hurricane Tracking chart: Eastern Pacific
Weather
- National Weather Service Forecast Office
- NCAR Forecast Models — http://www.rap.ucar.edu/weather/
- The Weather Underground — Tropical weather and hurricanes.
- Unisys Weather (mapped images of forecast models)
- University of Minnesota/State Climatology Office
- Weather Channel (Cable TV) — http://www.weather.com
- World Meteorological Organization— http://www.wmo.ch
- WSI Corp Intellicast—http://www.intellicast.com
NOAA sites
Archived weather maps, Unisys. Surface, satellite, and upper air maps dating back to 1997. Maps are keyed by number, examples: 0001 = Jan 2001; and 9803 = Mar 1998.
Disaster Preparedness
- A Caregiver’s Natural Disaster Prep List
- 4 Ways to Keep Your Dog Safe When Disaster Strikes
- Hurricane preparedness plan
- Homeowner’s Guide to Lightning Safety
- Lightning Safety Guide
- Preparing for Natural Disasters and Weather Emergencies
- Tornado Safety: How to Stay Safe During the Storm
earth.nullschool.net – an interactive display of Earth atmospheric properties
Extreme Instability — Spectacular weather photos
NOAA National Hurricane Center – current cyclone activity, Hurricane History, Hurricane Awareness, and storm information.
Weather articles in the Science Teacher(NSTA)
USGS Hazards Gateway – about earthquakes, floods, hurricanes, landslides, tsunamis, and volcanoes.