EF2. Why Do Volcanoes Erupt?

That’s Harry Truman from Washington State—not Harry Truman, the former President from Washington D.C. They were unrelated, but they had more in common than their names. Both were men of principle. Both were decisive. And neither one of them would choose to compromise as a way out of a difficult situation.
The Harry Truman of this story was the 83-year-old owner of the Mount St. Helen’s Lodge on lovely Spirit Lake. He had spent the past 53 years here, and he wasn’t about to leave now, just because the mountain—five miles away—occasionally ejected clouds of steam and ash, and shook the ground in a nearly-constant stream of tremors. He ignored the eviction notices and threats from the authorities; and wouldn’t even give in to pleas from friends that he move away from the mountain—just temporarily.
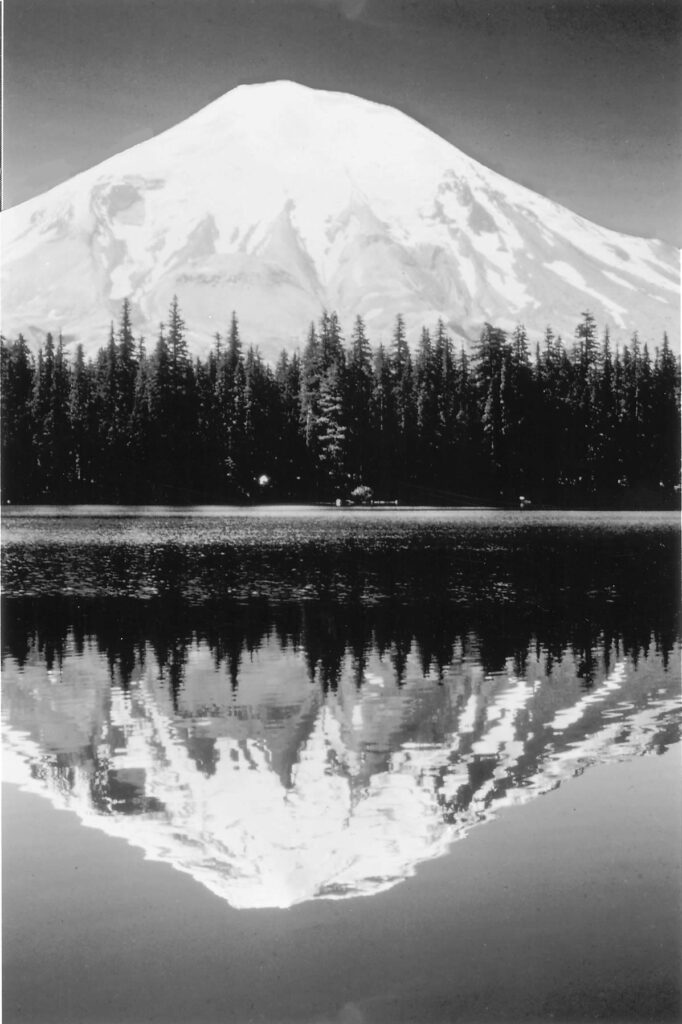
Before the eruption of Mount St. Helens, Spirit Lake was one of the loveliest places on Earth. Every summer kids from the YMCA camp would play in its cool fresh water, or hike through the surrounding forest of old growth trees of Douglas fir, hemlock and spruce. Some of the trees were over 65 meters tall and more than two meters in diameter. People came back summer after summer to stay in tourist lodges that ringed the lake. They enjoyed the serene majesty of the forest, the abundant fish and wildlife, and the lovely white-capped mountain just five miles to the South.
It was in one of these summer tourist havens where Harry Truman lived—and died.
The eruptions had started three months earlier, with a cloud of steam and ash, and earthquakes that grew more and more numerous. Pressure was building in a giant cavern under the north side of the mountain—the side facing Spirit Lake. By May 18th, 1980, signs of the pressure were unmistakable. A bulge 150 meters high and three quarters of a kilometer long marked the location of the underground cavern, like the lid on a pressure cooker.
Geologists were aware of the danger. Roadblocks were set up, and every home and campground within 16 kilometers was evacuated. Bruce Nelson, 22, and Sue Ruff, 21, were there to see the show. They were camping with four friends 21 kilometers from the mountain—well out of the area that experts thought might be dangerous.
The morning of May 18, 1980, dawned bright and clear. Harry was probably up early, feeding his sixteen cats. He was occupied with the normal flows of energy in his surroundings. Perhaps he was cooking breakfast at 8:32 AM, or pumping music from the player piano that had been crafted in 1883. One thing’s for sure. He was alone at the lake that morning—everyone else had been evacuated. Only Harry insisted on staying.
During the next few minutes Mount St. Helens exploded in the most powerful volcanic eruption in U.S. recorded history, and it had a major impact on the local and regional environment.
I. The Eruption of Mt. St. Helens
It started with an earthquake—5.1 on the Richter scale. Triggered by the quake, the north face of the mountain began to collapse in a huge avalanche. The “lid” came off of the mountain, and a huge plume, a mixture of steam, rock and ash shot from the summit. The pressure was so strong that the plume of gas and black ash reached 19,000 meters—almost 20 km—into the sky.
The energy of the blast could be estimated by its destructive power. It uprooted enormous trees and tossed them over ridges 450 meters high. It hoisted heavy boulders and blasted tons of ash into the stratosphere.
From these effects, experts estimated that the energy of the initial blast must have been 500 times as great as the energy released by the atomic bomb that destroyed Hiroshima at the end of World War II, and that the total energy output on May 18th was 400 million kilotons of TNT, or 20,000 times as powerful.
Winds immediately surrounding the blast would have reached 320 km per hour (about 200 mph), and were heated to 1100°C.
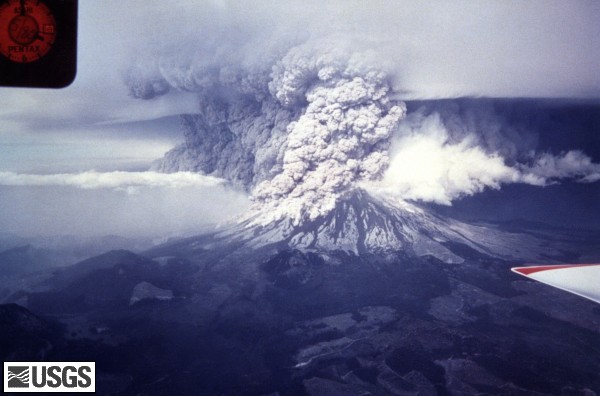
Source: U.S. Geological Survey, Menlo Park, CA
The black cloud, now tinged with yellow and purple and laced with lightning bolts, carried death and destruction as it spread out from the blast site.
Bruce Nelson and Sue Ruff held each other as they saw the cloud come towards them. When the shock wave hit them, it toppled trees, and nearly buried them in volcanic ash.
Somehow, they survived; crawling up through a two and a half meter layer of volcanic ash almost too hot to touch. Two of their friends were not so lucky. They died, trapped in their tent under the debris. Their other friends also survived, though one had a broken hip and could not be moved. Nelson and Ruff hiked out of the area, and came back with a helicopter to rescue the others. They were among more than 190 people that were rescued by helicopters in the days just after the eruption.
The immediate blast caused only part of the destruction. Large snow-covered peaks are often the source of rivers that carry melted snow to lower elevations. Mount St. Helens had two rivers leading away from it: the North and South Forks of the Toutle River. Both were inundated with a flood of hot mud created by the avalanche. The North Fork carried the mud to Spirit Lake, where it buried what was left of Harry Truman’s lodge, then continued down the river, pushing a wall of hot water ahead of it. The hot flood waters rushed down the two rivers, destroying a lumber camp and fish hatchery, and carrying away a bridge before inundating the town of Toutle—40 km from the mountain—where the two rivers joined.
The huge cloud of ash did not stop at the town of Toutle. It swept eastward with the winds, obliterating 26 lakes and damaging 27 others. For days the ash rained on the residents of three states, and the cloud darkened the Sun across the entire northern portion of the United States.
The final accounting revealed that 1,500 people lost their homes, and at least 70 lost their lives. Countless elk, deer, and smaller animals were killed, along with hundreds of thousands of fish that had thrived in the Toutle River and lakes. Harry Truman and his sixteen cats did not suffer more than an instant, as their end must have been swift. The tall ancient trees that had surrounded the lake were flattened and stripped, evidence of the destructive power of the initial explosion. Today, signs of life are returning to the region, and the name Spirit Lake has new meaning.
(Summarized from Volcano: The Eruption of Mount St. Helens, by the combined staffs of The Daily News, Longview, Washington, and The Journal-American, Bellevue, Washington.)
II. Environmental Changes Associated with the Eruption of Mt. St. Helens
Meet Paul Mausel and Danny Vaughn, Dept. of Earth and Environmental Systems Science, Indiana State University, and Ron Davis, Dept. of Natural Resource Conservation and Management, Western Carolina University. In this interview, conducted by Global Systems Science project staff-person Angela Miller, we explore volcanoes as a major form of energy exchange occurring on Earth and its implications to society.
Dr. Vaughn represents the team that has conducted research focused on the eruption of Mount Saint Helens (MSH) in Washington State and elements of its changes as part of a five-year NASA project entitled “Digital Earth Watch” (DEW). The researchers all have expertise in remote sensing (satellite and airborne multi-wavelength image analysis) with specialties in soils and land use (Mausel), geomorphology and systems analysis (Vaughn), and biology (Davis). Drs. Vaughn and Davis have conducted extensive field work in the MSH area focused on environmental impacts.
Question 1
GSS/Miller: What type of volcano is Mount Saint Helens and how is it different from other types?
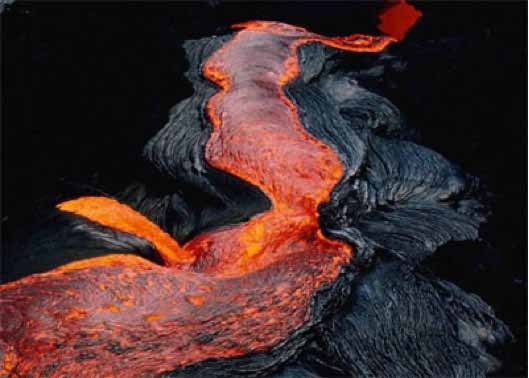
Dr. Vaughn: The two most common volcano categories are shield and strato volcanoes. Shield volcanoes have low energy, non-explosive eruptions where molten lava flows over the land slowly like water within a channel (Fig. 1) …
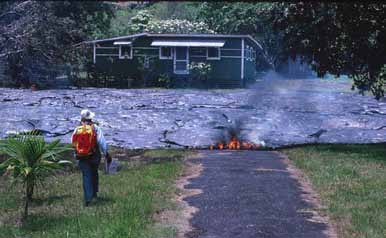
…or as sheet flow across a landscape (Fig.2).
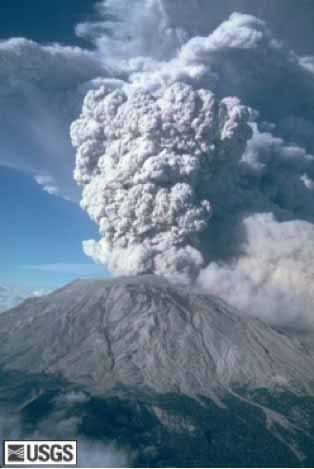
Strato or composite volcanoes are much more explosive and usually have a more conic shape. Mount Saint Helens is a strato volcano (Fig. 3).
The difference is largely due to the viscosity (resistance to flow) of magma. Shield eruptions happen when the viscosity of magma is low allowing gases to easily escape which results in less pressure build-up in magma. Strato volcanoes have high viscosity magma so that gases cannot escape as easily resulting in tremendous amounts of pressure built-up within the magma with violent, explosive eruptions developing.
Question 2
GSS/Miller: What kinds of research exist related to how volcanic eruptions occur?
Dr. Vaughn: Volcanism is a major research topic of international interest that is directly related to plate tectonics, earthquake activity, and surface (geomorphic) processes that continue to create radical changes in the landscape. Geochemists study elemental composition, chemical and physical changes in magma, lava, gases, and water. Geophysicists study the forces occurring along plate boundaries which cause volcanic and earthquake activity. Geomorphologists study the surface processes and changes to landforms occurring during and after an eruption.
Question 3
GSS/Miller: What exactly happened during the Mount Saint Helens (MSH) eruption?
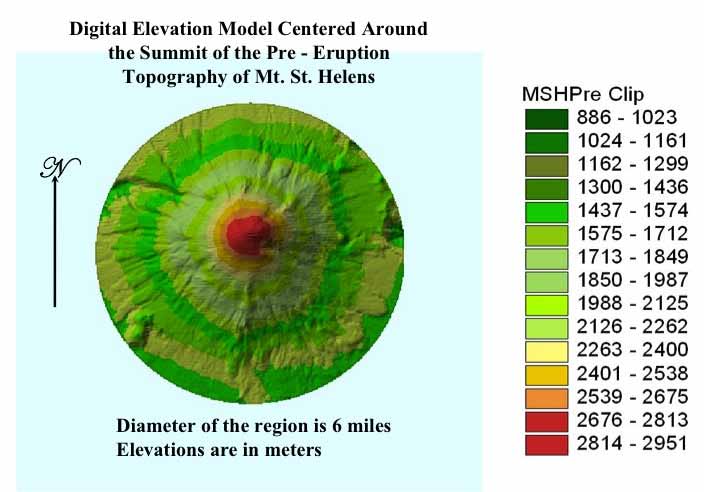
Dr. Vaughn: On May 18th at 0832 Pacific Daylight Time a magnitude 5.1 earthquake triggered a lateral (sideways) blast that followed multiple failures of the bulging north flank of the mountain. A debris avalanche moved down slope at 70 to 150 miles per hour, dislodging 23 square miles of surface area, spilling north in the North Fork of the Toutle Valley. The energy released was equivalent to 24 megatons of TNT (7 megatons from the blast and 17 megatons from the release of heat). Pressure was released from inside the volcano and super hot water immediately flashed to steam. A jet of hot ash (tephra) at a temperature of 900°F (500°C) raced down slope with hurricane force, then traveled 17 miles northwest moving more than 200 miles per hour. It destroyed a surface area of about 230 square miles. Deposits carried by the blast totaled a volume of 0.046 cubic miles. A slurry of volcanic deposits and melt water from the glaciers, snow, and ice fields formed a volcanic mud and debris flow (lahar) that moved 10 to 25 miles per hour down the North Slope and filled the North Fork of the Toutle Valley to an average depth of 150 feet (maximum depth of 600 feet) over a stretch of 14 miles. The lahar ultimately emptied into the Cowlitz River which had its channel depth reduced from 40 feet to 14 feet and the river flow rate (discharge) slowed from 76,000 to 15,000 cubic feet per second. The summit elevation of Mt. St. Helens was lowered from 9,677 ft (2,951 m) to 8,365 ft (2,551 m).
The blast created a 2,084 feet deep crater measuring 1.2 by 1.8 miles. The explosions expelled a volume of ash (tephra) estimated at 0.26 cubic miles (1.4 billion cubic yards) 80,000 feet into the stratosphere in less than 15 minutes.
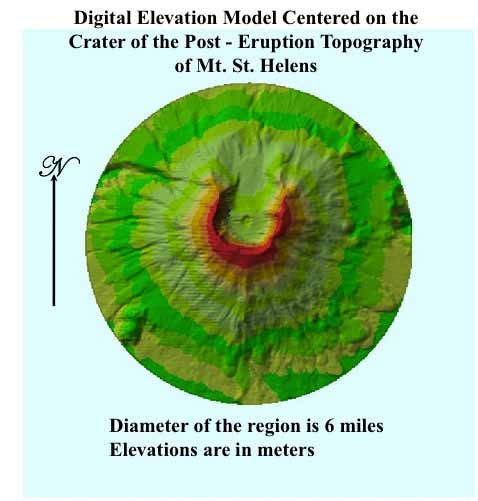
Within three days the ash plume had crossed the United States; and within 15 days, it had completely circled the Earth. A total of 0.67 of cubic miles (3.7 billion cubic yards) of Earth material was removed from the mountain from this single volcanic event. Figures 4 and 5 are digital elevation models of pre and post eruption that clearly show losses and deposition of materials on the landscape.
The total energy output on May 18 alone was equivalent to 400 million tons of TNT, or approximately 20,000 Hiroshima-size atomic bombs.
Question 4
GSS/Miller: What were some of the major environmental changes in the Mount Saint Helens area immediately following the eruption?
Dr. Vaughn: When Mt. St. Helens erupted, entire stands of mature trees were blown down like matchsticks at a distance of 12 miles (20 km) from the blast zone. One-hundred fifty square miles of forest totaling four billion board feet of timber (enough to build 300,000 homes) was blown down in six minutes.
At Spirit Lake an enormous water wave initiated by deposition of one-eighth cubic mile of rock and muddy debris stripped trees from slopes as high as 850 feet above the pre-eruption water level.
The impact to the ecosystem was enormous: the destruction of forests, including ground vegetation, and contamination of fresh water severely disrupted the food chain necessary for many animals. Research is continuing to study return of vegetation, the development of soil and nutrients, and active surface processes. Volcanic impacts collectively have positive and negative consequences to society. Positive consequences of volcanoes include development of new land and enrichment of many soils worldwide. Negative consequences of volcanoes include burying of areas with volcanic materials, including cities. A major eruption can send ash into the atmosphere to circulate worldwide with such density that the Earth’s climate is temporarily cooled which can temporarily reduce agricultural production causing great hardship to human population in many parts of the world.
Question 5
GSS/Miller: What factors affect how long it takes an ecosystem to recover after an eruption?
Dr. Vaughn: Post-eruption biotic recovery may or may not be rapid after a major eruption. Within the first year, plants began to reappear on parts of the MSH volcanic landscape where vegetation was destroyed or severely damaged. Over the next few years in some MSH areas, additional minerals and nutrients combined to form weak soil profiles, with numerous vegetative species appearing throughout the blast area. Birds, other migratory animals, and the wind transported seeds helped to reestablish a new ecosystem. Trees began to appear on some slopes in more sheltered areas not in direct line to strong hot winds from the blast that easily leveled many existing pre-eruption forests. How long recovery takes and how vigorous that recovery is varies based on factors such as slope of the land, aspect (facing direction) of the land, and presence or absence of soil or soil-like parent material of sufficient thickness and fertility to support plants.
Question 6
GSS/Miller: How did plants adjust or fail to adjust in the years after the eruption?
Dr. Vaughn: I am part of the NASA DEW a group conducting research on MSH area plant succession, which is the process in which a plant or animal community successively gives way to another until a stable ecosystem is reached. We often use an indicator of planet health known Normalized Difference Vegetation Index (NDVI), which is determined from analysis of red and near infrared light acquired from satellite sensors which are converted into images (Figures 6-8).
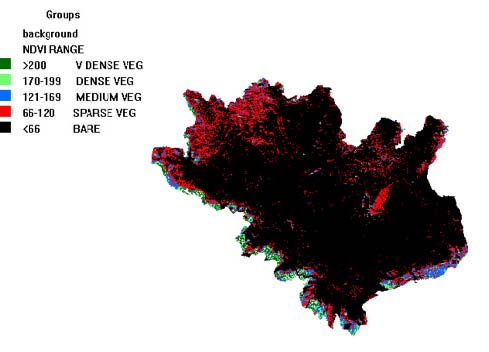
In 1979 analysis using as NDVI showed that about 60% of the MSH area had dense to very dense vegetation, 25% had moderately dense vegetation, and 15% was bare (MSH itself and lakes) or areas with sparse vegetation. In a matter of hours on May 18, 1980, this area was covered by volcanic ash and other volcanic materials (primarily white/light gray areas on the 1980 satellite image-Fig. 6) leaving only a few percent of the area vegetated around some of its fringes.
The Landsat NDVI post-eruption image of 1980 shows that 85%-90% of the MSH area was bare as a result of erosion, deposition, hot hurricane speed winds, and other volcanic impacts. About 10% of the land farther away from the source of the eruption or in more sheltered locations had only sparse vegetation.
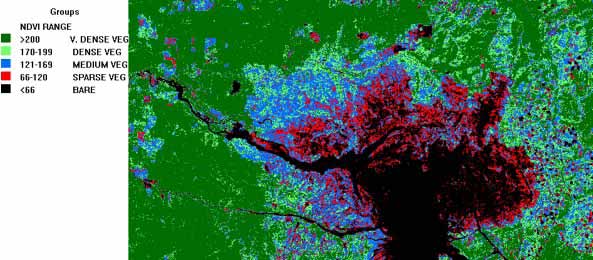
Comparing the 1980 NDVI image (Fig. 6) with the 1988 NDVI image (Fig. 7), it is evident that MSH itself and adjacent areas remained bare (black). However, sparse vegetation (red) was establishing itself around the fringes near the volcano.
In less than eight years some of the most inhospitable areas had at least sparse plant life again.
A belt of medium NDVI/biomass (blue) surrounds the bare volcano core and sparsely vegetated enclaves in a belt closest to the bare zone. Beyond that zone (green) dense forests and grasses with high biomass are found once again except for a few areas of sparse vegetation.
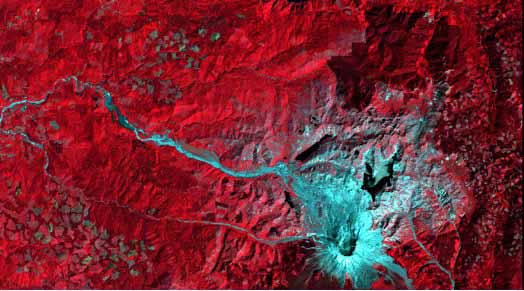
In 1984, vegetation recovery was modest in most areas, and in 1996, vegetation recovery was rather significant in many areas. The August, 1996 Landsat TM image (Fig. 8) shows the environment 16 years after the eruption and is one of seven satellite images used to trace the progress of vegetation succession over twenty-five years following the MSH eruption.
In this image, dark red is dense vegetation (usually forest with some grass), light red is moderately dense vegetation, blue is bare materials, black is water (or shadow), and green is sparse vegetation.
We see that 16 years after the eruption, the fringe area where ash fall was modest and the primary destruction of vegetation was from hot strong volcano-induced winds, almost returned to pre-eruption conditions. Areas at a greater distance from MSH or nor directly in line with the blast showed significant vegetation recovery on the 1984, 1988, and 1991 images. Areas closest to MSH, most affected by massive erosion, volcanic deposition and landslides, remained bare (in blue), but in numerous areas some vegetation succession took place (areas of blue mixed with red and pink). Lands farther away had large or very large vegetation increases (green colors) between 1984 and 1996 because soils were not destroyed and migration of seeds and animals from nearby areas only slightly affected by the eruption supported quick regrowth. The areas in red and black, and to lesser degree blue, located less than 12 miles from the core of the eruption, had relatively slow plant growth between 1984 and 1996.
By the year 2000, MSH itself remained predominantly bare in areas of greatest volcanic eruption effects, but some plant succession progress was made in some bare areas acquiring sparse vegetation and some sparsely vegetated areas acquired moderate or even high biomass/vegetation. The vegetation stages where there has been major regrowth are primarily outside the areas of greatest volcanic devastation with some significant exceptions. In areas many miles from MSH, biomass as measured by NDVI is similar today to what was present in 1979. Vegetation succession trends continue to the present.
It is interesting to note that some areas in the MSH study have had virtually no vegetation re-establish itself 16-20 years after the eruption, yet other areas had very rapid vegetation recovery, with other areas in between these two extremes. This led to a good research question: why are there such differences in vegetation succession? We sought patterns in different classes of vegetation succession and looked for reasons for why succession was fast in some areas and slow in other areas. Five landscape and succession parameters were identified and analyzed (visually and through computer). This research is not completed, but preliminary results suggest that factors that can lead to fast vegetation succession are sunny aspect (direction a feature faces), low to moderate slope, parent soil that is relatively thick with at least moderate nutrient level, and relatively low elevation.
Preliminary results also suggest that no or very slow vegetation succession is associated with areas with increased shadow, medium to high slope, infertile/thin soil, and high elevations.
Question 7
GSS/Miller: Can you give an example of how large animals adjusted or failed to adjust in the MSH area in the years after the eruption?
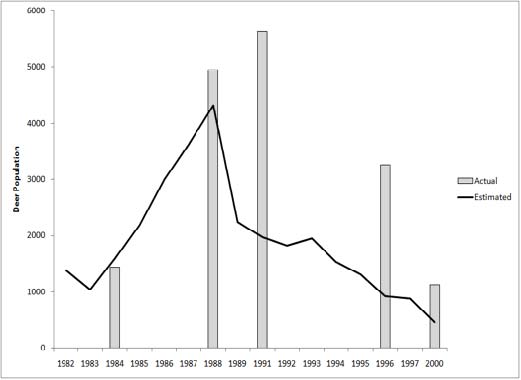
Dr. Vaughn: Large numbers of deer, elk, and bear were lost during the MSH eruption. The estimated deer population in the MSH study area from 1983-2000 is shown in Fig. 9.
Dr. Ron Davis compared the estimated deer population in the MSH area 1984-2000 with succession vegetation species and density. Let me summarize some of his research results for MSH area deer population change and reasons for those changes from the 1980 eruption through 2000 succession recovery.
Immediately after the 1980 eruption, the large animal population in the MSH study area was virtually zero, but by 1983 there was enough forage vegetation to support 1,000 deer that migrated from nearby areas that were not affected to a significant degree by the MSH eruption.
During the 1983-1988 period, the deer population exploded because more areas of forage vegetation was available with tree sapling and shrubs interspersed. Biomass was rapidly increasing, more important for the deer and elk was that the bulk of the biomass was in the form of forage vegetation.
(Courtesy Dr. Ron Davis)
Starting in 1988 and continuing to 2000 there was a steady decline in deer population with some variations due to decline in forage species of vegetation, the nature of winter weather severity, and disease.
Deer population dropped from a high of 5,000, essentially back to pre-eruption levels of about 1,000 during the 1995-2000 period and beyond.
The pre-eruption population level of deer of 1,000 is similar to current deer population. Why?
From the perspective of a deer or elk, the MSH eruption was a good event (other than for those that got killed initially) because it destroyed most of the dense forests, that had little undergrowth vegetation for grazing. After the eruption many of these low-forage forests were quickly replaced by grasses and other forage vegetation which for nearly a decade after the blast provided a good food supply in the physically more favored areas. The deer and elk rarely had such a good environment for population growth since forage food was abundant and some trees/shrubs provided protection. However, after 1988 trees increasingly became more abundant than the vegetation that deer used for forage. With a rapidly decreasing food supply, caused by the succession to forest, the deer population dropped to what was common in the pre-eruption environment, dominated by denser forests with some open patches of forage/grassy vegetation. In summary, the MSH eruption was a boon for deer/elk for about a decade, but longer term the number of deer stabilized in the study area at pre-eruption levels because forest vegetation succession resulted in a return to dense forest which provides only very modest amounts of forage for deer.
III. Why Study Volcanoes
If it weren’t for volcanoes and earthquakes, we might never know about the tremendous energy beneath our feet. It’s also quite possible that we wouldn’t care. Because these crust-shattering events are so destructive of human life, and so unpredictable, there is a great deal of interest in understanding how and why they occur, and perhaps someday, in predicting when they will occur, so that those who want to can get out of the way.
But that’s not the only practical reason for learning about the energy inside the Earth. At certain locations where the crust of the Earth is unusually thin, molten rock, called magma, comes relatively close to the surface, causing hot springs, fumaroles (steam coming out of the ground), and geysers.

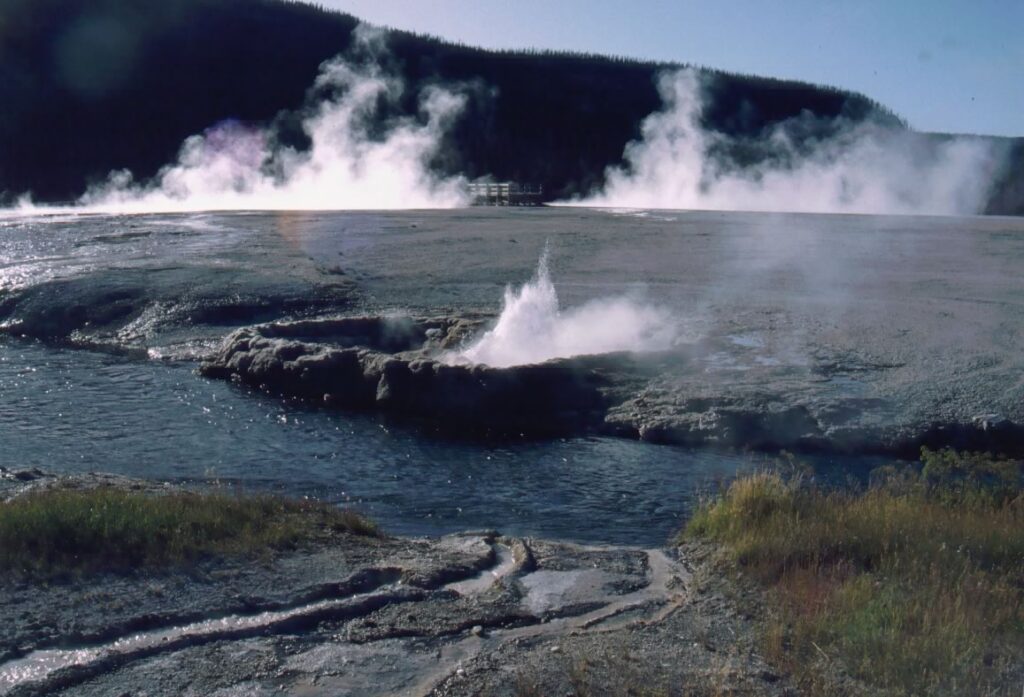
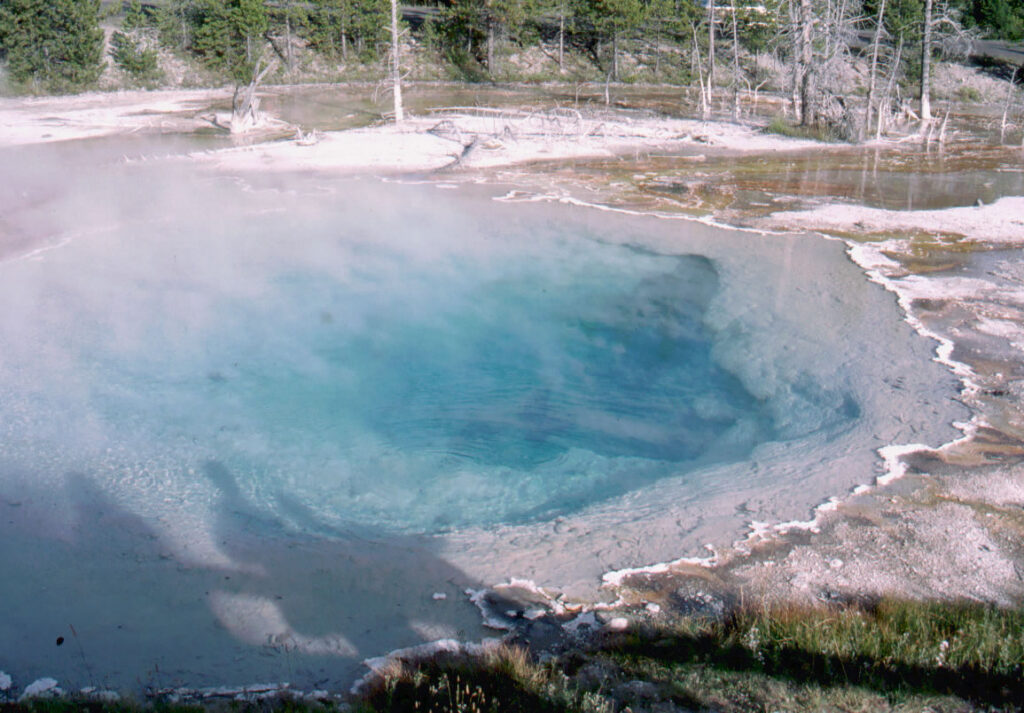
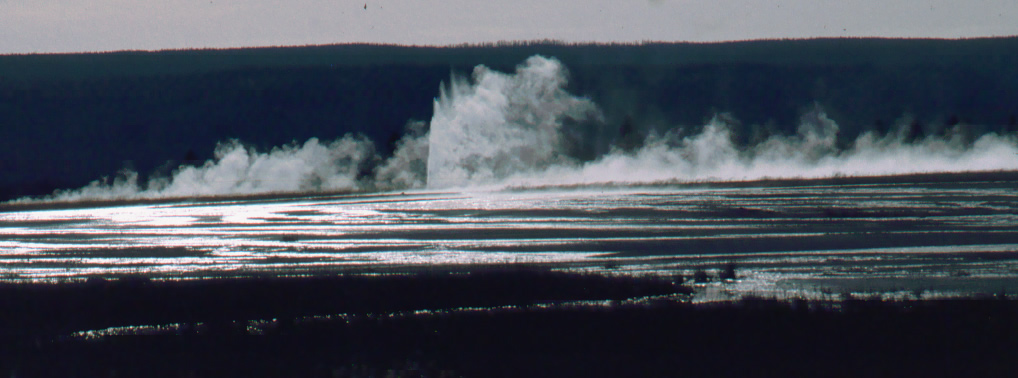
In some of these areas, including California and Wyoming in the U.S., and Iceland, New Zealand, and Japan, people have harnessed the heat of the Earth to warm their homes, provide hot water, and even generate electricity. This form of energy production is called geothermal energy. In contrast to burning of coal, oil, and natural gas (all fossil fuels) for energy in most areas, the use of our planet’s interior heat for human needs is much friendlier to the environment. Burning of fuel releases not only air pollution, but also gases that are responsible for greenhouse warming of our whole planet, which may bring on climate changes with serious consequences for us. But more on that later. Geothermal energy is worth pursuing as one of a number of “alternative energy” strategies—alternatives to burning fuels to met our energy needs.
In summary, we study energy inside the Earth to
- improve possibilities for predicting volcanic eruptions and earthquakes, to minimize losses in those catastrophes.
- explore possibilities for a clean alternative energy. Coincidentally, Earth study uncovers new reservoirs of fossil fuels as well.
- satisfy our basic inquisitive nature to understand ourselves and our surroundings.

Watch Video of Lava Bombs
See video in this article in Science Magazine, July 2025,
Hidden features of volcano ‘lava bombs’ caught on video.
Slow-motion footage helps scientists predict flight paths of molten projectiles.
https://www.science.org/content/article/hidden-features-volcano-lava-bombs-caught-video
IV. Volcanoes and Tectonic Plates
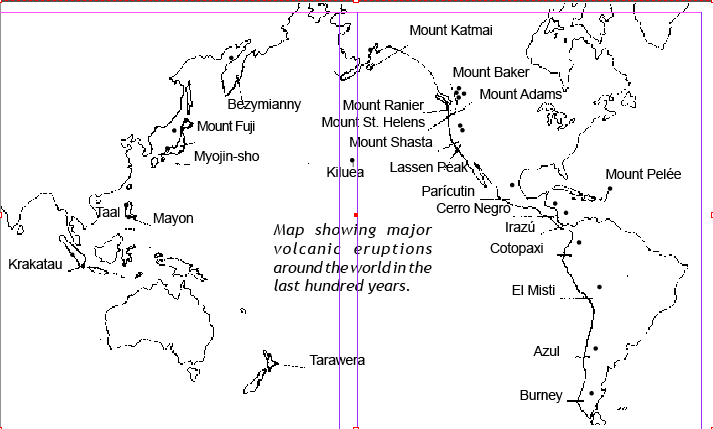
Understanding how and why volcanoes occur means understanding how energy flows within the Earth. One of the most important clues is the location of volcanoes. If we plot major eruptions during the past hundred years on a map, we find certain patterns.
See also: new models (as of June 2022) from University of Adelaide, Australia, that show how the continents were assembled.
One of the clearest patterns is the ring of volcanoes around the Pacific Ocean, sometimes called “The Ring of Fire.” Eruptions along the Ring of Fire include Mount Unzen in Japan in 1991, Mount Pinatubo in The Philippines in 1991, Redoubt Volcano in Alaska in 1989, and of course Mount St. Helens in 1986. To find out about the most recent eruptions, check the University of North Dakota’s Volcano World web site at http://volcano.oregonstate.edu.
In 1957, scientists at the Lamont-Dougherty Earth Observatory completed a map of the ocean floor (see page 32). The map revealed a network of huge cracks, called rifts, winding through the oceans. The locations of the rifts coincided with the locations of hundreds of volcanoes and thousands of earthquakes. Within the next ten years, this map and other evidence led to the gradual acceptance of the theory that Earth’s crust is broken into about twenty large plates, like the cracked shell of a hard-boiled egg. The plates are called tectonic plates. One of the largest plates covers almost the entire floor of the Pacific Ocean. Although some plates coincide roughly with the shapes of continents, a particular plate is not necessarily strictly associated with ocean or continent. A single plate can have a portion submerged under ocean and have a portion carrying a part of a continent.
V. Why Do Tectonic Plates Move?
Long ago, geologists thought that the Earth’s crust has always been unchanging. But by the mid 1960s enough evidence had accumulated to show that crustal plates move very slowly—about the rate your fingernails grow. This movement is caused by heat deep inside the Earth.
Below is a cut-away view of the Earth’s crust and the upper mantle, (or aesthenosphere) near Mount St. Helens. The drawing illustrates that the movements of the Earth’s crust are the visible part of a convection current that is completed deep beneath our feet.
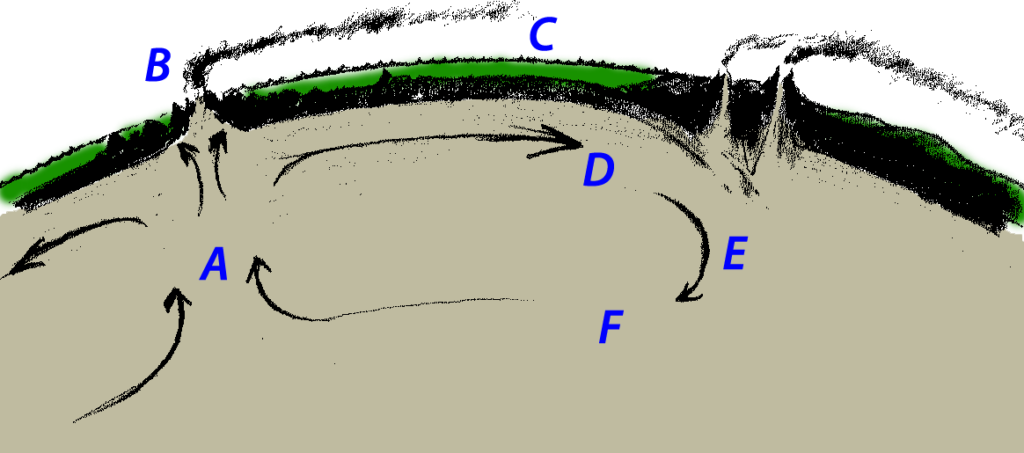
A. Magma in the upper mantle is heated more than its surroundings. That makes it less dense, so it floats upwards, creating a rift in the crust. Such rifts are usually found on the ocean floor where the crust is thinner.
B. When the hot magma gets to the surface, it erupts through the rift as lava, forming a new part of the ocean floor.
C. The new material pushes the crust away from the rift. As it cools and moves away from the rift, the crust gets denser.
D. The crust is pushed underneath the continent, which is less dense. This process is called subduction.
E. As the ocean crust is pushed deeper and deeper under the continent temperature and pressure increase tremendously. Rocks and sediments melt. Water trapped in the ocean sediments and gases trapped in the rocks expand and are forced upwards, erupting through volcanoes.
F. Most of the molten material moves even deeper underground, rejoining the upper mantle, and moving back towards the rift. Eventually, the molten rock completes the long convection current when it replaces magma that had previously erupted through the rift.
VI. What Happens When Tectonic Plates Meet?
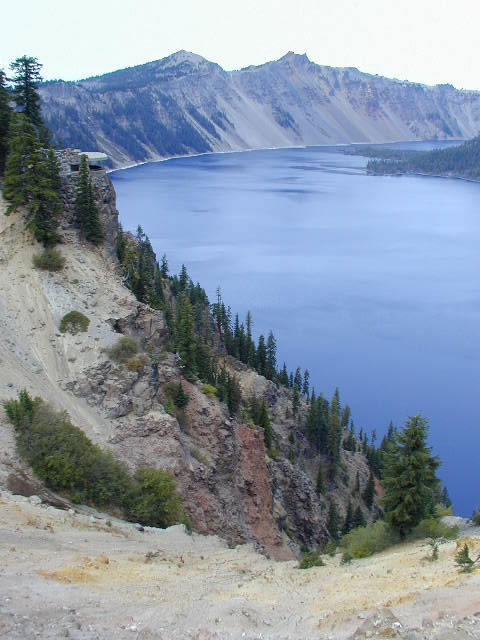
There are several possible outcomes of tectonic plates meeting. The marriage is rarely harmonious. According to the theory of plate tectonics, earthquakes and volcanoes occur where the plates meet and jostle against each other. Scientists now have a fairly good understanding of how the plates move and how such movements relate to earthquake activity. Most movement occurs along narrow zones between plates, called plate boundaries, where the results of plate-tectonic forces are most evident.
There are four types of plate boundaries:
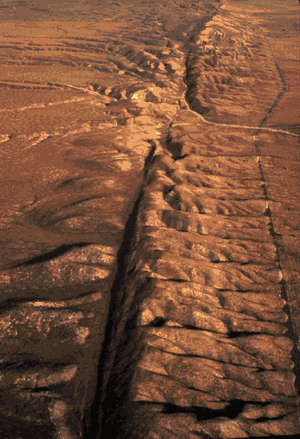
Photograph by Robert E. Wallace, USGS
- Diverging boundaries—where two plates are moving apart—new crust is generated by magma pushing up from the mantle as the plates pull away from each other along zones called spreading centers. The best known divergent boundary spreading center is the Mid-Atlantic Ridge, which extends from the Arctic Ocean to beyond the southern tip of Africa, one segment of a global mid-ocean ridge system that encircles the Earth.
- Converging boundaries—where two plates are crashing together—crust is destroyed as one plate dives under another. One plate diving under another plate is called subduction. (More about converging plates on the next pages.)
- Transforming boundaries—where crust is neither produced nor destroyed as the plates slide horizontally past each other. The San Andreas fault zone, about 1,300 km long stretches through two thirds of the length of California. The Pacific Plate on the west side of the fault zone has been relentlessly moving in a northwesterly direction past the North American Plate on the east side of the fault zone for about 10 million years, at an average rate of about 5 cm/yr.
- Plate boundary zones—broad belts in which boundaries are not well defined and the effects of plate interaction are unclear.
There are three ways that converging plates can come together:
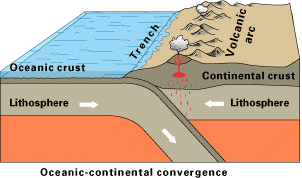
Ocean-continent converging plates. Example: Off the coast of South America along the Peru-Chile trench, the oceanic Nazca Plate is pushing into and being subducted under the continental part of the South American Plate, which in turn is being lifted up, creating the towering Andes mountains, the backbone of the continent. Strong, destructive earthquakes and the rapid uplift of mountain ranges are common in this region. Earthquakes in this area are often accompanied by uplift of the land by as much as a few meters.
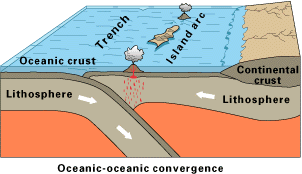
Ocean-ocean converging plates. Example: As with ocean-continent convergence, one plate is usually subducted under the other, and in the process a trench is formed. Example: The Marianas Trench (paralleling the Mariana Islands in the Pacific), marks where the fast-moving Pacific Plate converges against the slower moving Philippine Plate. The Challenger Deep, at the southern end of the Marianas Trench, plunges deeper into the Earth’s interior (nearly 11,000 m) than Mount Everest, the world’s tallest mountain, rises above sea level (about 8,854 m). Volcanic island arcs such as the Marianas and the Aleutian Islands are associated with trenches.
Continent-continent converging plates. When two continents meet head-on, neither is subducted and, like two colliding icebergs, resist downward motion. The crust buckles and is pushed upward or sideways. Example: The highest mountain range on Earth, the Himalayas, is an uplifting resulting from collision of the Indian plate against the Eurasian plates starting about 50 million years ago, and continuing today.
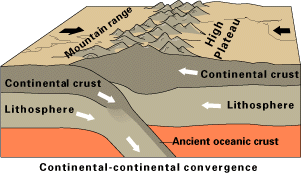
For more on plate tectonics see the U. S. Geological Survey web site Understanding Plate Motions at https://pubs.usgs.gov/gip/dynamic/understanding.html.
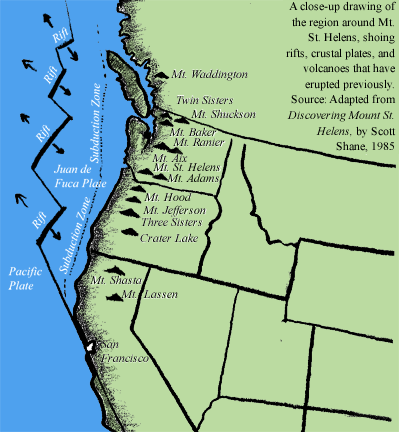
Let’s look again at the map we saw at the beginning of section IV of this chapter. It shows Mount St. Helens not far from the Pacific coast. Out at sea, you will discover a long, broken rift where hot magma is pushing upwards from deep under the Earth.

To the west of the crack is the Pacific Plate. To the east is a small plate, called the Juan de Fuca plate. Every few years, when the pressure below the rift builds up, the magma erupts on the ocean floor as lava. The lava quickly cools in the water, forming undersea mountains.
When more lava comes up, the mountains are pushed aside, putting pressure on the Pacific Plate to the west, and the Juan de Fuca Plate to the east—right against the coast of Washington, Oregon, and Canada.
In the region of Mt. St. Helens, the Juan de Fuca oceanic plate is thinner and denser than the North American continental plate, so it is pushed underneath the North American Plate carrying with it some of the water of the Pacific Ocean. As the rock of the Pacific floor is pushed deep inside the Earth, it is subjected to great heat and pressure. The heated rock expands, and becomes less dense than the surrounding material, so it floats upwards. Water in the rocks turns to steam. When the pressure becomes great enough—Boom! The “lid” explodes and another volcano along the Ring of Fire erupts.

EF2.1. Investigation:
Make Your Own Subduction Zone Map
Use the Underground Atlas of Subduction Zones described in this article: https://eos.org/articles/a-new-underground-atlas-of-subduction-zones.
Mapping subduction zones is now as simple as cropping a family photo thanks to Submap, an online tool hosted by the University of Montpellier in France. It is designed for a wide audience including students, teachers, and professional researchers and is available to anyone with an Internet connection.
If you live in an earthquake prone area near a subduction zone, use the Submap tool to make a subduction zone map of your area. Map-Geodyne is a good one. If you are not in such an earthquake prone area, pick a geographical area of interest to you and make a subduction zone map of it.
What cities are closest to subduction zones?
VII. Conclusion
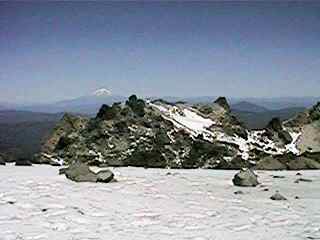
This chapter began with the explosive eruption of Mount St. Helens, and looked under the Earth’s crust to see what caused the eruption. The immediate cause is a convection current that continuously carries heat from hundreds of miles down in the Earth to the surface.
Parts of the convection current are rapid, such as the eruptions at the rift and at the edge of the continent. Parts are very slow, as when matter is slowly subducted and heated, and moves underground to replace the magma that erupted through the rift. A single bit of rock that is subducted and melted might travel under the Earth for millions of years before it erupts again through a rift, cools, and again becomes part of the ocean floor.
It is widely believed now that eventually, nearly all of the matter that comes up to the surface is pushed down again and remelted, so that the Earth effectively “turns itself inside-out” every few hundred million years.
In the next chapter we look deeper inside the Earth, to discover the source of its energy.

