
DEW2.4. How to Take the Best Digital Photos
You need appreciation of art, technology, and science to be able to capture images with a digital camera to maximize the accuracy and minimize the uncertainty of the measurements.
To improve how to use a camera to take digital images for scientific measurement, it is good to know the basics of operating your digital camera (or smartphone camera). Use these recommended links to learn about
- camera exposure (aperture, shutter speed and ISO setting) – http://www.cambridgeincolour.com/tutorials/camera-exposure.htm
- depth of field – http://www.cambridgeincolour.com/tutorials/depth-of-field.htm, or
https://www.photographytalk.com/beginner-photography-tips/7356-a-beginner-s-guide-to-aperture-and-depth-of-field - camera metering – http://www.cambridgeincolour.com/tutorials/camera-metering.htm,
- camera lenses – http://www.cambridgeincolour.com/tutorials/camera-lenses.htm, and
- white balance – http://www.cambridgeincolour.com/tutorials/white-balance.htm.
Taking Digital Images for
Spatial Measurements
Recommended procedure while taking a picture to measure the size of specific objects:
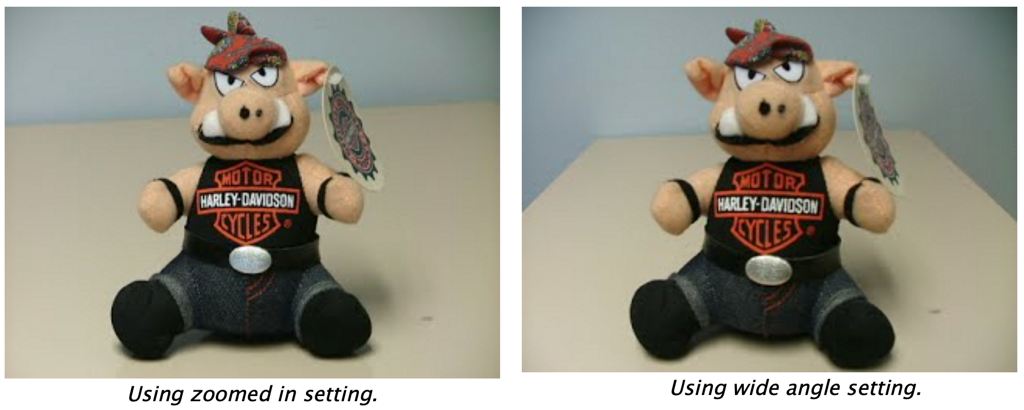
1. Maximize the optical zoom available on your camera. This tends to minimize distortion of objects at different distances from the camera lens. Compare the size of the nose to the head in the “zoomed in” and the wide-angle photos below.
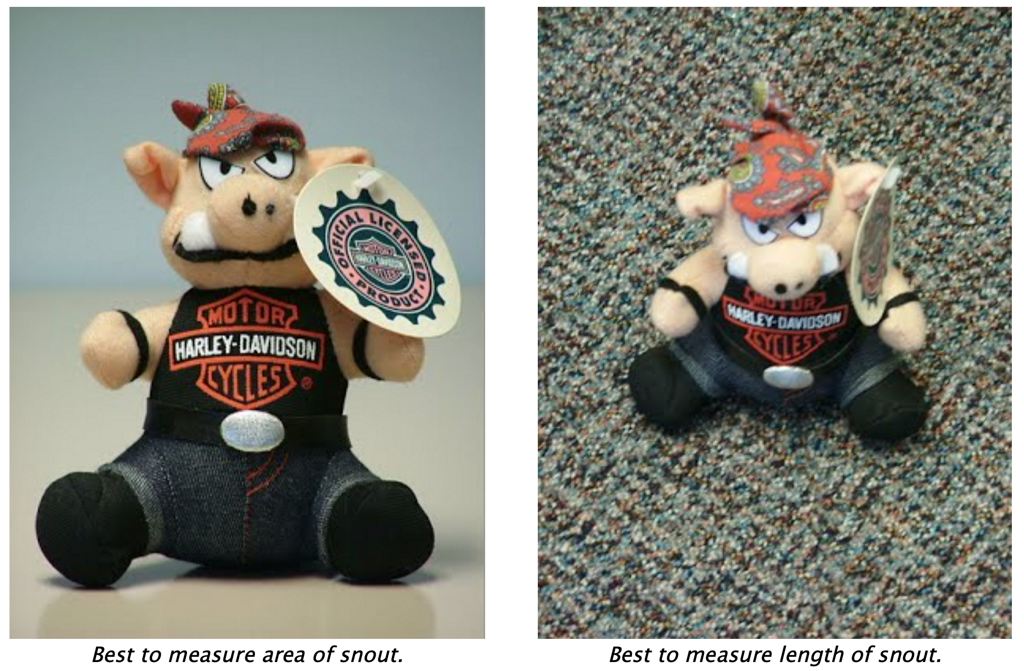
2. Keep the camera lens parallel to the object(s) that will be measured. This minimizes distortion of objects at different distances from the camera lens. Which picture below is useful for making a measurement of the length of the nose? Which is useful in measuring the area of the snout?
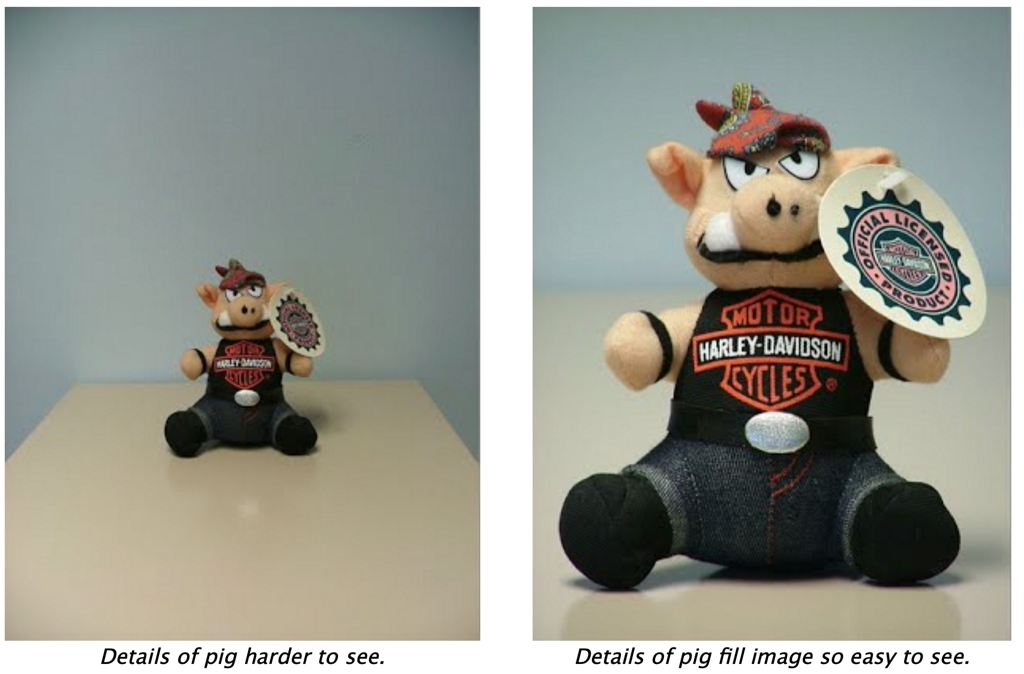
3. Fill the picture frame with the object of interest. The more pixels used to represent the object allows more details to be seen. Which picture below would be easier to measure the length of the belt buckle?
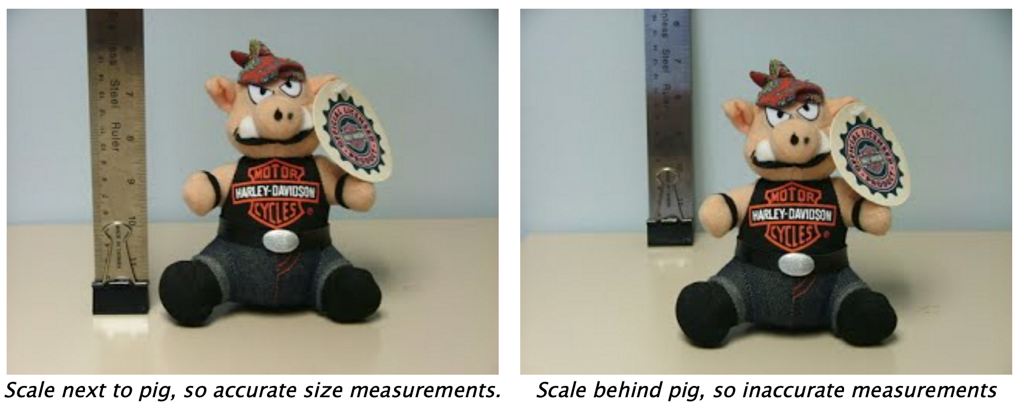
4. Put a scale of known length in the same plane as the picture. To make more precise measurements, use a scale that is comparable in size to the object of interest. For example, if you were taking a picture of a tree to measure its height, you might use a 2 m pole rather than a 20 cm ruler. Put the ruler parallel and in the same plane as the objects you are interested in measuring. Notice what 1 inch represents on the pig in both pictures below.
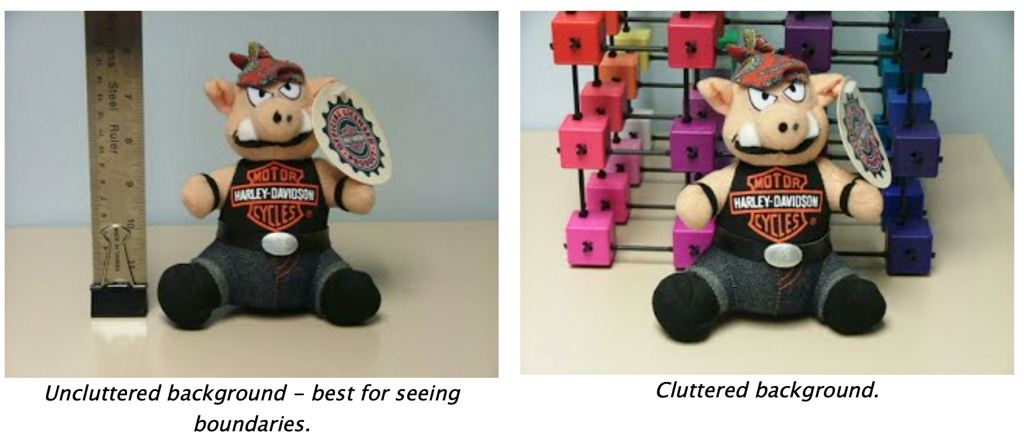
5. If possible, place a simple colored background behind the object of interest to make measuring easier. It will be easier to see the edges of the object to be analyzed.
TIPS
- Use a resolution of at least 800 x 600 (about 1/2 megapixel).
- Take 3 pictures of each situation. Maximizes chance that a photo will be in sharp focus.
- Use a tripod.
- If taking images of similar objects, be as consistent as possible:
- Try to keep camera the same distance from each object.
- Try to use the same lighting conditions.
- Don’t change the camera settings for different pictures.
- Take detailed notes of each picture.
- Time of day, sky conditions, direction camera is pointing, camera settings.
- Consider creating a data collecting template and print many copies before going into the field.
- Put a label of the object in the picture to make organizing pictures easier.
Taking Digital Images for
Spectral Measurements
Obtaining scientifically accurate color from your digital camera is not as easy as one would think. There are many variables such as your camera setup, computer setup, lighting, exposure, and white balance that can affect the way color renders in your images. However, through the use of some simple fundamental photographic techniques we can greatly improve the quality of our images for use as a scientific data collecting device.
The Computer Setup
Computer monitors, LCD screens and even TVs can look very different from one another. All you have to do is go into a large technology store and look at the big wall of TVs or monitors and you will see big differences in luminance, contrast, hue, and saturation. If your screen is not calibrated it may not affect the ADI software’s ability to read the percentage of red, green and blue, however, it will definitely affect your perception of the colors you’ve recorded with your camera. The solution to this problem is to calibrate your screen regularly with a device such as the Spyder3 from Datacolor or the Eye-One Display from X-Rite.
The lighting in the room where the computer is located is also important. Calibrate your screen under the lighting conditions with which you intend to use your computer and keep the lighting the same all the time. If you look at a picture or your screen under different types of light you will see why this is important. Different lighting such as Tungsten, fluorescent, sunlight, and near dark will all cause your eyes to see the image differently. Again, this tip is for people that are more serious about color because it will not affect the ADI software results but it will affect your perception of color.
The last computer tip involves your image editing software. Some programs like Adobe Photoshop or Lightroom have the ability to make corrections to your photos as they are imported into the computer. In an effort to keep this simple, let’s just say it would be better if you prevented the program from doing this and allow them to come into the computer the way they were shot. However, for people who are very serious about color accuracy you may want to create your own color profile for your camera with a program called DNG Profile Editor, which you can do a search for on Google. The downside of this is it requires you to buy a fairly expensive color target and the result you get may not be hugely different than the Standard Profile that came with your camera.
The Camera Setup
All digital cameras, whether they be DSLR’s or point and shoot, are similar in how they take an image, but they vary greatly in their buttons and icons. The good news is most cameras have the same set of basic functions, so you may just have to look them up in your camera’s manual to find out how they work in your particular camera.
As far as color is concerned we only need to worry about a few options. The first option is the camera’s color profile. By default it’s probably set to the standard profile which is what we want, unless you made a custom profile with the DNG Profile editor as mentioned earlier. The good news is you shouldn’t have to change anything. If you want to see the camera’s other profiles just look in the camera’s menu system for options like monochrome, sepia, landscape, portrait, neutral and standard. Every camera has different profiles, and some may call them something else like “lens effects”. Your camera may alternatively have sliders that say hue, saturation, contrast; and you would want to make sure these sliders are all set to the middle.
The shooting mode is also important because we would like to keep everything consistent from one shot to the next. For this reason it would be best to use the camera’s manualshooting mode. This mode allows you to set the ISO, shutter speed, and aperture. When in manual shooting mode, these settings will not change from shot to shot unless we change them. The worst possible shooting mode to use would be the full auto mode because the camera controls everything, and all of the camera’s settings can change from one shot to the next. In any shooting mode, you want to be able to turn off the camera’s flash.
If your camera doesn’t have a manual shooting mode like in some point and shoot cameras, then the best shooting mode would be the program mode. This mode will still select the shutter speed and aperture for every picture but at least it will let you select the ISO and whether or not your flash fires.
There are apps for smartphones to control photographic parameters of the smartphone cameras.
Finally, the most important camera setting for recording scientifically accurate color would be the white balance. White balance is a setting in your camera that tells the camera how to deal with different temperatures of the ambient light. You may have noticed that a tungsten light bulb is a warm light and gives off an orange glow; while a fluorescent light is a cooler light that has a more greenish tint. Our eyes and brain are pretty good at adjusting to the temperature of light for us, but cameras need to be told what kind of light there is so they can remove any color casts (or alterations) in your images. These color casts can cause the ADI software to give your incorrect RGB percentages.
Most cameras by default are set for Auto White Balance (AWB), which means that the camera will figure out the white balance for you no matter what kind of light you are shooting in. The problem with this setting is it doesn’t do the best job. One step better would be to choose the appropriate setting for the light you are shooting under like tungsten, florescent, sunny, cloudy etc. However, for scientifically accurate color we really need to do a custom white balance every time you shoot under different lighting conditions. Creating a custom white balance is not hard to do but you do need to buy a grey card. Consider the grey card called the PhotoVision target, but there are less expensive cards from Opteka or WhiBal.
Lighting
The lighting on your subject should be bright enough to provide evenly distributed light over your subject. The camera’s flash is generally not a good source for even lighting so be sure to turn off your flash. For photographing small objects like test strips, plant leaves, or petri dishes containing chemical reactants or living organisms, consider using two clip-on work lights each with a 100-watt tungsten bulb. These can be purchased at a local hardware store for less than $10 each. Don’t use florescent bulbs because they don’t produce as intense light, and it’s harder to achieve a good white balance when using them. Turn off any overhead florescent lights while you’re photographing your experiments. You may also want to place white paper or white foam core opposite your lights as a reflector to bounce light back onto your test subject. If you have a chance to create your own background behind your test subject, try to make it the same color as your grey card (18% grey) because that’s where your camera’s meter works best for calculating an exposure. But if you can’t make your background grey, try to make it a color that is different than the colors of your test subject. Solid color poster board are make excellent backgrounds for relatively small test subjects.
Sample Procedure
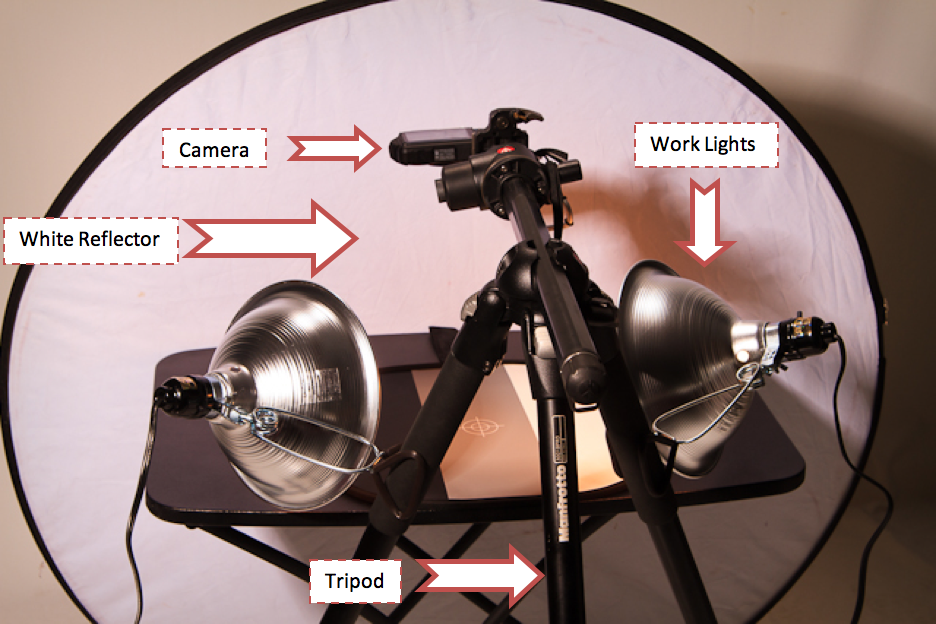
1. Setup a shooting station
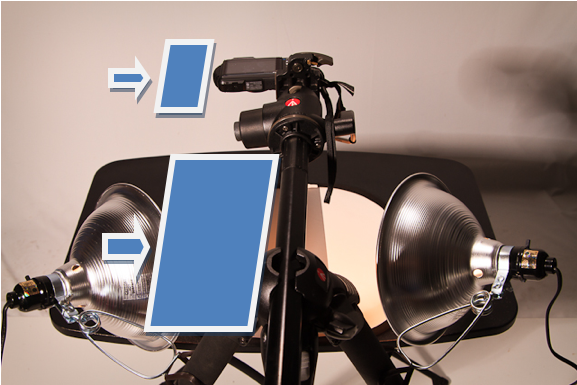
The important part of this setup is that it provides even illumination of the subject and a stable and consistent position for the camera. The two work lights can be found at most hardware stores and they contain 100-watt tungsten light bulbs. The reflector in the back is there to bounce light back on to your subject so you don’t get as much light falloff. White foam core makes for a great inexpensive reflector. The tripod in this setup does a great job of holding the two work lights at a 45 degree angle to the subject and provides a very stable shooting platform for the camera. If you don’t have a tripod like this you can use a ring stand on each side to hold the lights and a third stand with a Bunsen burner ring on it, then place the camera on top of the ring so it can shoot down on your subject.
2. Set up your camera
- Turn off your on camera flash.
- Put the camera into the Manual Shooting Mode if you have one or the Program Mode.
- Set the camera ISO to 80 or 100
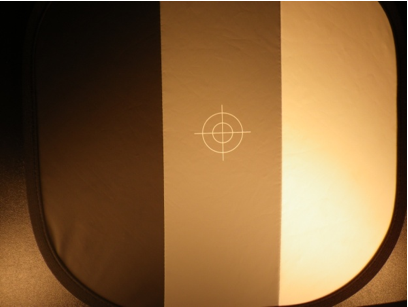
- For best results do a custom white balance with a grey card after you have determined the correct exposure. Since every camera has a slightly different procedure, refer to your camera’s manual for how to set a custom white balance. If you don’t have a grey card, set the camera’s white balance to tungsten. However, as you can see from the images here, a custom white balance can make a big difference.
Tungsten white balance
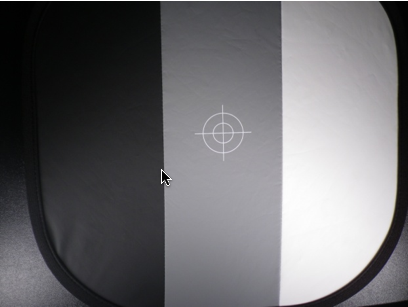
3. Take the picture
- Make sure the plane of the camera’s sensor is parallel to your subject.
The blue planes are illustrating that the plane of the camera sensor (small blue rectangle) is parallel to the plane of the test subject (large blue rectangle).
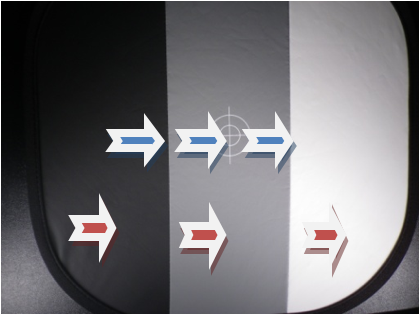
- Focus on an edge or an area of contrast. Your camera can’t focus where the red arrows are but, it can focus on where the blue arrows are located. Your focus point is often a small square or rectangle. Place it over an area of contrast, then press the shutter button half way down till you hear a beep or see the square light up red. This means you have locked focus and you may press the button the rest of the way to take the picture. Try not to rush your camera in this process, allow it time to obtain focus lock before you take the picture. If you try to do it all with one smooth push of the shutter button you may not lock focus and you could end up with a blurry picture.
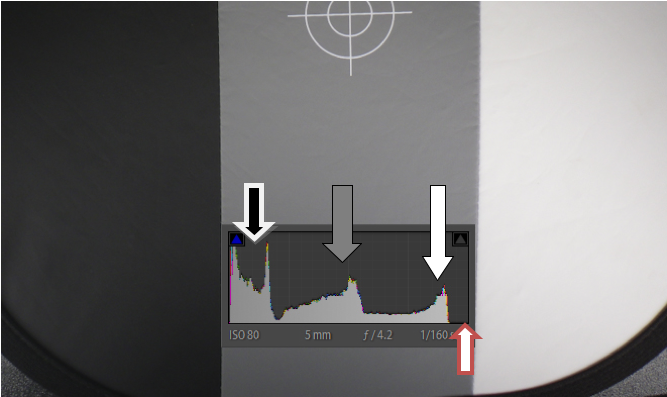
- Take a test shot and adjust your exposure.
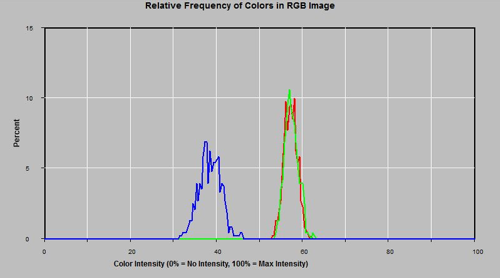
This image was taken in program mode with no exposure adjustment. The histogram above can be seen on your camera by repeatedly pressing the Display or Info button until the histogram is displayed. Since this target has three distinct colors, black, grey and white, the histogram has the same three peaks. The exposure above isn’t bad and could be used for color testing; however, it is slightly underexposed. The red arrow shows where there is some room to the right of the white peak. A good histogram should have information that covers the whole range from left to right, just make sure the peaks don’t crawl up the left or the right side of the histogram. The next image shows how the exposure can be improved.
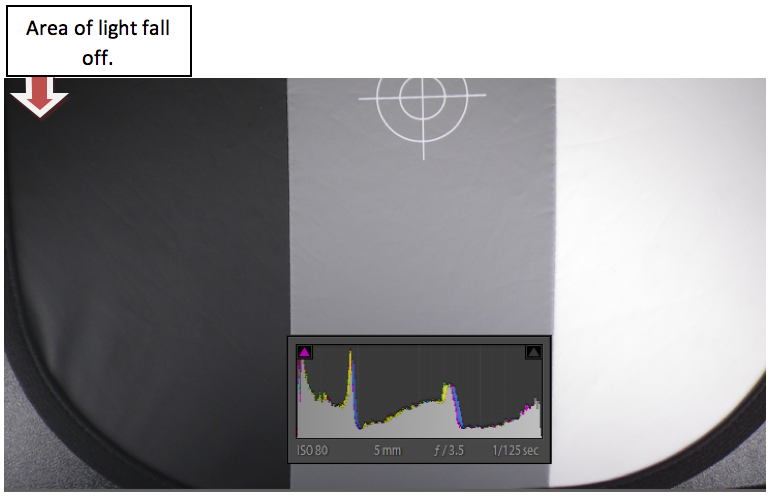
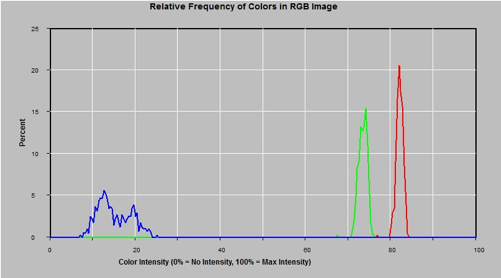
Notice that there is no empty space on this histogram from left to right. The left side of the histogram shows that part of the image is losing detail, but that’s because there is some light fall off on the target, so make your color measurements where the light is evenly distributed. The right side is perfect, the peak goes right up to the edge but does not crawl up the right side.
To make this correction in your camera (manual mode) change the shutter speed to a slightly longer time.
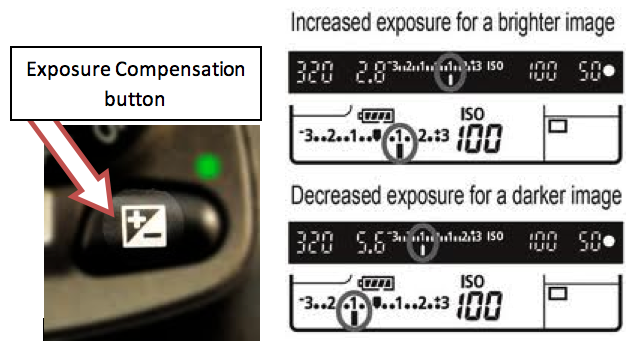
To make this correction if your shooting in the program mode press the exposure compensation button and dial in + 0.3 ev, which will brighten the exposure by 1/3 stop of light.
On these diagrams, one dot is a 1/3 stop. If your camera doesn’t have an exposure compensation button on the outside of the camera body, check in the menu system or your camera’s manual.
- After adjusting the exposure, set a custom white balance.
- Replace the white balance target with your test strip and a comparison color chart and take the final picture. I placed my pH paper on a light grey paper and I placed the pH color chart above the test strip so the shadow from the canister would not fall on my strip. I also oriented the canister so the best light hit the part of the color chart that looked closest to my test strip. This would have worked better with a flat color comparison chart.
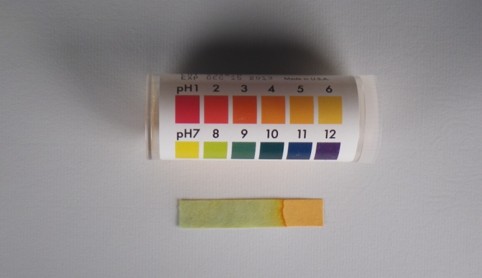
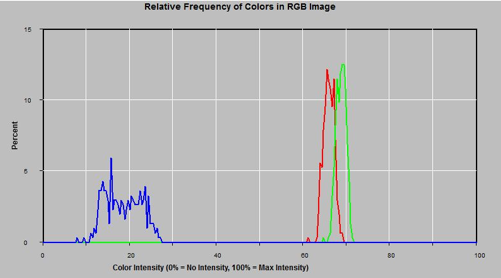
- Inspect your image to make sure it is sharp and clear, then use the ADI software to see if the test strip was closer in color to pH 7 or 8. The red and green peaks appear to be closer to pH 8. To create the graphs below, use the Rectangle Tool (one of the spatial measurement tools) to draw a box within the desired area of color to be analyzed. The go to the FileMenu and select Graph Colors. The graph may be saved as an image or printed to be included in a report, or the color histogram data may be saved as a file that may be imported into spreadsheet programs such as Excel for additional analysis.
The procedure above would also work for larger subjects.
Simply make sure to use even lighting, the right exposure,
a custom white balance, and take a clear sharp image.
Real World Examples
Dr. Michael Green of the Centers for Disease Control and Prevention, used an earlier version of AnalyzingDigitalImages (MVHimage) to analyze the concentration of insecticide on mosquito netting to provide an inexpensive way to protect oneself from disease carrying mosquitos in tropical climates. For more information, read his article. He analyzed the intensity of color of a chemical reaction to assess the concentration of the insecticide.
In 2010, the National Science Foundation funded the University of Massachusetts, Amherst, to develop research-grade protocols to measure the concentration of a number of environmental pollutants using digital cameras and AnalyzingDigitalImages. Presently, there are methods developed to measure the concentration of arsenic (which includes arsenic in the rice we eat), ozone in the atmosphere, and dissolved organic carbon in water. See their website (http://umassk12.net/digital) for the latest background information and methodology.