DEW Concept Mapping
Concept Mapping and Visual Learning
Jeffrey S. Beaudry, PhD
University of Southern Maine
Polly Wilson
Deering High School
Portland, Maine
Introduction
From 2005 to 2009 we were involved in the Digital Earth Watch (DEW) grant (formerly Measuring Vegetation Health) with the purpose to create and integrate visual data and visualization tools into formal and informal science education. The initial technological tools in DEW included remote sensing satellite imagery, interactive image analysis software, new lesson plans and exhibits. A DEW website was constructed with links to all these data collection and a variety of interactive visualization tools. As we designed, developed and implemented these technological tools for visualization of data, we explored concept mapping and visual learning tools to support meaningful student learning (Ausubel, 1978) and formative assessment (Beaudry and Wilson, 2010). In this paper we maintain that the impact of technological tools can be best realized when teachers organize teaching, learning and assessment around “sound principles of knowledge construction” and a focus on meaning making (Mintzes, Wandersee, and Novak, 2005, p. 349).
Science literacy is used as an overarching theme for this paper. In Science for All Americans (AAAS 1989) “a scientifically literate person” is described “as one who is aware that science, mathematics, and technology are interdependent human enterprises with strengths and limitations; understands key concepts and principles of science; is familiar with the natural world and recognizes both its diversity and unity; and uses scientific knowledge and scientific ways of thinking for individual and social purposes” (p.4). Acquisition of scientific literacy in K-12 classrooms relies on traditional literacy, reading, writing, speaking and listening, as well as additional literacy modes, visual literacy and visual representation, and technological literacy. In this paper we focus on the combination of visual and technological literacy.
The premise of our work is that students should be actively engaged in the construction of complex, challenging knowledge, incorporating collaborative learning and concept mapping on a regular basis as they use relevant technological tools. Despite the growing evidence that concept mapping and visual learning are effective strategies for learning (Hattie, 2009; Nesbit and Adesope, 2006), concept mapping and visual learning strategies still do not permeate classroom practice as they could (Mintzes, Wandersee, and Novak, 2005; Kinchin, 2006; Beaudry and Wilson, 2010). The concluding remarks from a related field by the National Research Council in Learning to Think Spatially echo this observation:
Spatial thinking is not an add-on but a missing link across the curriculum. Thus, integration and infusion of spatial thinking can help to achieve existing curricular objectives. The idea of spatial thinking does not and should not stand alone, but equally well, without explicit attention to it, we cannot meet our responsibility for equipping the next generation of students for life and work in the twenty-first century (p. 241).
In this paper we discuss how multiple models of literacy contribute to high quality teaching, learning, and assessment in science for all students with examples of lessons using DEW technologies and tools. In particular we discuss 1) the models of literacy which includes visual literacy and visual representation (Sinatra, 1986; Novak, 1998; Trowbridge and Wandersee, 2005), 2) digital technological literacies (National Standards for Technology Education, 2010; Lankshear and Knobel, 2010), 3) and visual learning supported by technological tools as described in Learning to Think Spatially (National Research Council, 2006), and 4) the visual schema of science literacy as published in the American Association for the Advancement of Science (AAAS), Atlas of Science Literacy (2011).
How do concept mapping and visual learning fit in the context of new literacy models of science (viewing, reading, speaking, and writing, as well as visual representation and technological literacy)? Specific classroom applications of the new literacy model in science help us focus on the questions:
- What does the new literacy in science look like in the classroom?
- What new evidence does the new literacy in science provide of student learning?
We provide descriptions of the classroom activities of learners that link together with the pedagogical questions of the instructor in this collaborative learning environment.
Literature Review
Digital Earth Watch – Using Light and Color to Monitor the Environment. Previous chapters in this book have described the purpose for the grant, Measuring Vegetation Health. The purpose of DEW was to develop and field test technological tools and resources using light and color to investigate the health of plants and trees, and to promote spatial learning. Teachers and students were shown digital repositories of remote sensing (aerial and satellite) imagery and how digital cameras could be used in combination with image analysis software for authentic, scientifically valid investigations. Digital images were analyzed using new, open-source image analysis software designed and improved by this grant, including Color Basics, Image Basics, and Advanced Digital Image (ADI) analysis software packages.
There are three lessons described in this paper: 1) a 3-week investigation of inter-tidal zones in marine ecology, 2) a 1-week investigation of DNA, and 3) a 3-week investigation of phytoplankton. In each of these investigations students the concept mapping and visualization tools are used to support inquiry.
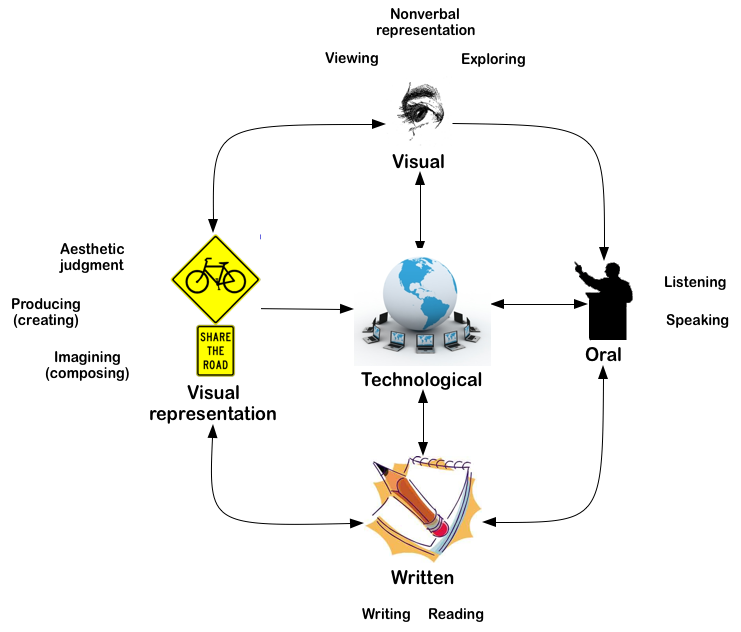
Integrative Definition of Literacy: Reading, Writing, Listening, Speaking, Visualizing, Visual Representation, and Technological. Multiple literacy perspectives helped to inform our use of science tools and resources for inquiry. Tools like concept mapping, digital photography, and image analysis integrate visual and spatial literacy. Spatial thinking has a clear connection with the expanded literacy framework (See Figure 1) elaborated by Sinatra (1986) in which learners’ understand how to plan, produce and evaluate visual representations.
According to the National Academy of Sciences (2006) “Spatially literate students who have developed appropriate levels of spatial knowledge and skills in spatial ways of thinking and acting together with sets of spatial capabilities, have the following characteristics:
- They have the habit of mind of thinking spatially
- They practice spatial thinking in an informed way
- They adopt a critical stance to spatial thinking – they can evaluate the quality of spatial data and can evaluate the validity of arguments based on spatial information. (p. 4)
Traditional forms of literacy include reading, writing, speaking, and listening, and Sinatra (1986) suggested expanding the model to include viewing (observing and experiencing), visual representation, and media technology (See Figure 1). Sinatra (1986) presented a model of literacy development that included four interactive phases: phase 1 – visual literacy, phase 2 – oral literacy, phase 3 – written literacy, and phase 4 – visual representation and communication. Technological literacy is a rapidly evolving mode of learning involving interaction with computer hardware, software, and new information technologies, and is represented now by the National Standards for Technology Education (2011).