
CC6.2. What Are the Human-Caused Sources of Carbon Dioxide?
Investigation
If the average global temperature is rising and a large part of the cause is increasing CO2, we need to be aware of any ways that humans are adding to global CO2 levels.
It appears true that the concentration of carbon dioxide in the atmosphere is much higher today than it was before the industrial revolution. The change from day to day and year to year is not that much, but over decades the change becomes noticeable.
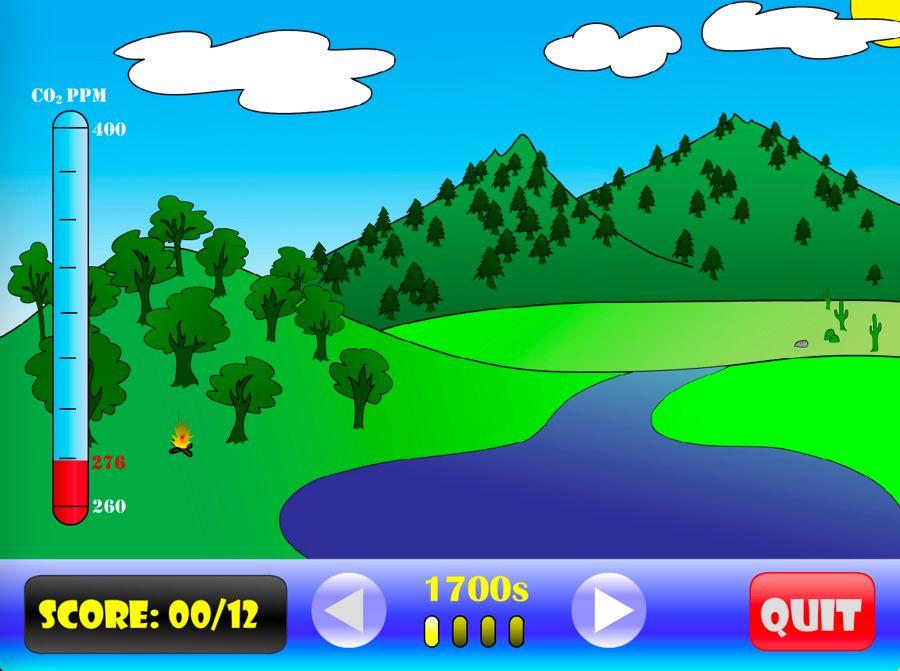
OPTIONAL: If you have or can find a Flash Player,
download this Flash interactive:
What Are the Human-Caused Sources of CO2? interactive. …and play the interactive and see if you can find all 12 human-produced sources of CO2 in the interactive.
Where did that additional carbon dioxide come from? One way carbon dioxide is added to the atmosphere is when people burn fossil fuels. Nearly all the electricity used in this country comes from power plants where trainloads of fossil fuels are burnt every day. Fossil fuels are burned in cars, ships, and airplanes. They are burned in houses to heat air and water. They are burned in factories to melt metals and fashion millions of objects used by people every day. You only have to look around you to see the continual burning of fossil fuels.
In the past 100 years, the rate at which our society has added carbon dioxide to the atmosphere has grown tremendously, but many of these changes go unnoticed, in part because they have taken place slowly in comparison with a human lifetime, and in part because we quickly adapt to changes.
Have you ever gone back to an old neighborhood after being away for a few years and been surprised at the differences, while those living there hardly notice the changes? Recognizing change is an important skill. Sometimes changes go unnoticed for a long time, until all of a sudden, things seem very different.
The purpose of this investigation is to enable you to recognize the vast number of changes over the past 100 years that, taken together, are responsible for the increased concentration of carbon dioxide in the atmosphere.
How Has San Francisco Changed During the 20th Century?
Comparing pictures is one way to recognize changes that have taken place over a long span of time. Look carefully at the pictures on the next page. The top picture shows San Francisco just after the turn of the 19th century. The bottom picture shows the same scene in the 1990s.
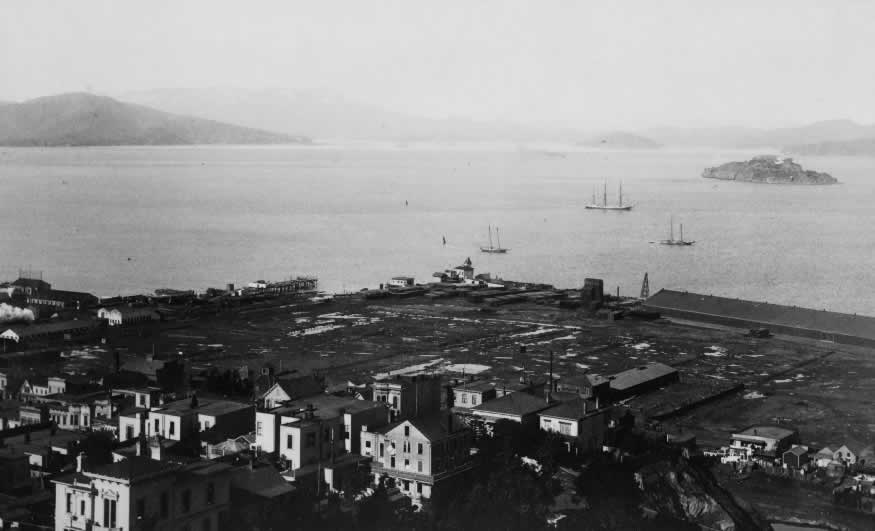
San Francisco from Telegraph Hill at the beginning of the 20th century.
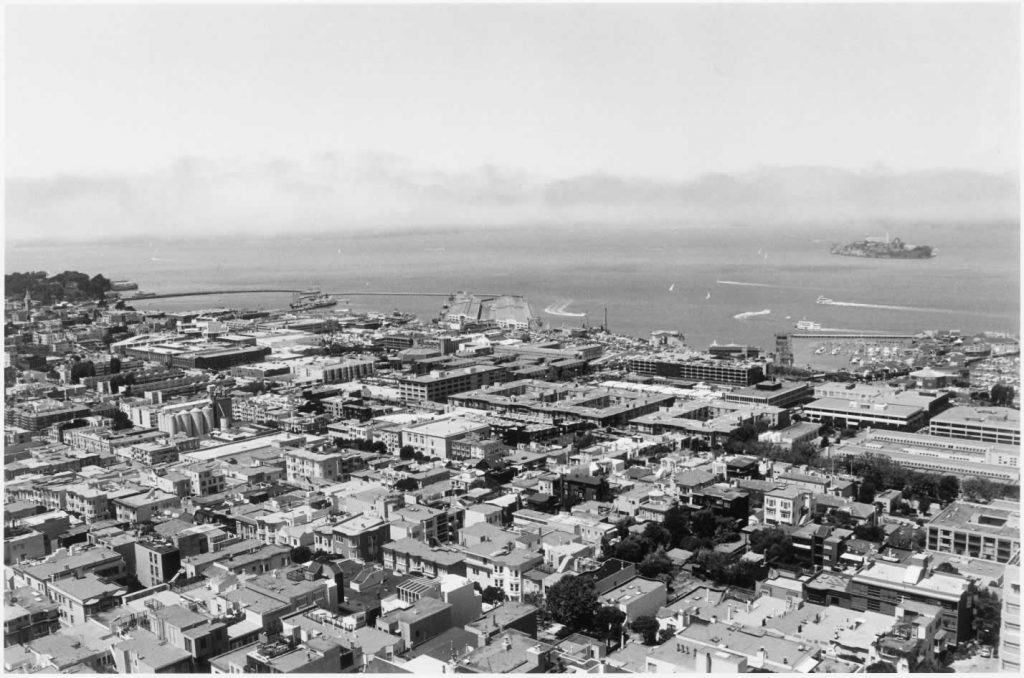
San Francisco from Telegraph Hill at the end of the 20th century.
How Has the Area Where You Live Changed?
Most cities, large and small, have a local historical society that preserves old photographs of their city or town. Perhaps you have a relative who has such pictures. Try to obtain an old photograph and go to the site today to observe the changes. If you can, take a new photograph of the scene so you can show the pictures to others. If photographs are not available, interview the oldest resident you can meet with and get an idea of what your community was like years ago.
QUESTION 6.19 For the two pictures of San Francisco, make a list of the changes that you see. Discuss how each change might make a difference in the amount of carbon dioxide that is released into the atmosphere.
Multiply the changes on your list by the thousands of communities across the nation. Which of these changes do you think contributed most to the amount of carbon dioxide in the atmosphere? Rank the changes in order from greatest to least contributions to Earth’s changing atmosphere, and state why you ranked them as you did.
Other resources
You can also find out how much CO2 is produced by countries through data resources such as World Resources Institute (http://wri.org/) which collects and disseminates such data.
You can even find out per capita emission of CO2 by using the WRI data in conjunction with population data from a source such as the CIA World Fact Book (https://www.cia.gov/the-world-factbook).