
CC5.2. Sampling Carbon Dioxide
{ Climate Change Contents } { All GSS Books }
Discuss question 5.4 with your teammates and write down your prediction. Then determine whether or not you were right by first taking gas samples and then testing the samples to determine which has a greater concentration of carbon dioxide.
Question 5.4. Which source do you think has a greater concentration of carbon dioxide: your breath, exhaust from a car, or the air in your classroom?
Materials
For each team of 3–4 students
- 5 clear vials
- Graduated cylinder (100 ml)
- Cup of water
- Bottle of Bromthymol Blue (BTB) solution
- Bottle of ammonia solution
- Eye dropper
- Straw
- Narrow-necked bottle (such as a wine bottle)
- 4 balloons of different colors with twist ties
- Teaspoon of baking soda
- 100 ml of vinegar
- 3 sheets of blank paper
- Piece of string, about 1/2 meter in length
- Twist-ties
Part 1: Chemical Test for Carbon Dioxide
Teams need to work together in this experiment, because most of the steps require more than one pair of hands.
1. Make a sample of pure carbon dioxide (CO2). Use the graduated cylinder to pour 100 ml of vinegar into the narrow-necked bottle. Use a scrap of paper to make a funnel. With the funnel, put one teaspoon of baking soda into the bottle. Let the mixture bubble for 1 second to drive the air out; then slip a balloon over the neck of the bottle. The balloon should inflate to a 7–10 cm diameter. (If it doesn’t, add more baking soda and try again.)
Movie of generating pure CO2 sample – 1co2exp-gettingPureCO2.mp4
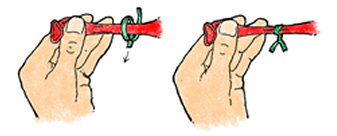
2. Secure and measure Sample A (pure CO2). Twist the rubber neck of the balloon, and fasten it shut with a twist-tie. Record the color of the balloon on the first sheet of paper. Call it “Sample A.” Measure the circumference of the balloon with a string.
3. Make Sample B (room air). Blow up a second balloon using a bicycle pump (do not use your breath). Measure its circumference with a string. Add more air or allow some to escape until it is the same size as the sample of pure CO2. Secure the second balloon with a twist-tie. Record the color of the balloon on the data sheet under Sample B.
Movie: sizing the balloon sample – 3co2exp-sizingsample.mp4
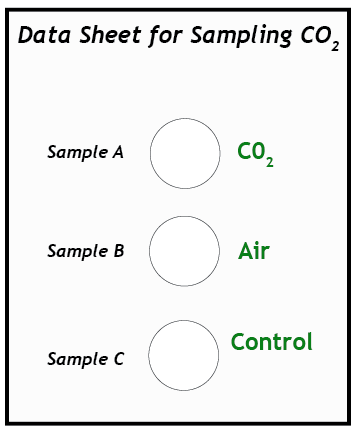
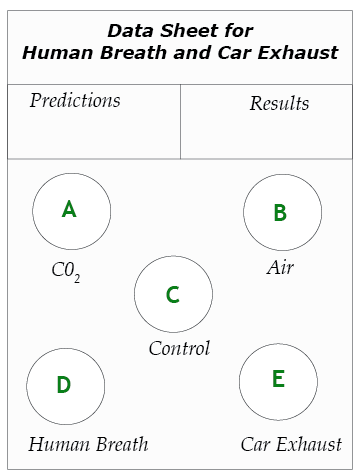
4. Prepare the test vials. Use the graduated cylinder to measure and pour 15 ml of BTB solution into each of three vials. Place the vials on the data sheet in the circles marked A, B, and C. Vial C is the control vial. This vial will remain untouched; no gas will be bubbled through it.
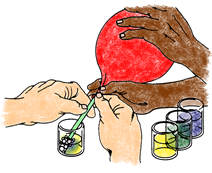
5. Test Sample A. (This step requires two people working together.) Insert the end of the straw into the neck of the balloon with gas Sample A. Wrap the neck of the balloon around the straw so it makes a tight seal, but do not remove the twist-tie yet! Insert the other end of the straw into the bottom of vial A. Remove the tie and slowly untwist the balloon so the gas will escape through the straw. It is important to untwist slowly so that the gas in the balloon does not come out too quickly and splash the liquid out of the vial. Allow all the gas in the balloon to bubble through the BTB solution in vial A.
Movie: bubbling gas through the straw – 4co2exp-bubblingIntoBTB.mp4
6. Observe color changes. Observe the color of the solution as you slowly bubble the gas through it. What shades of colors does it pass through before reaching a final color when all of the gas has been bubbled through it? Record the final color of the solution on the data sheet.
7. Test Sample B. Bubble Sample B from its balloon through the BTB solution in vial B. Compare its color with the blue of the control vial. Record the color of the solution on the data sheet. Save the solutions for later comparison.
8. Draw conclusions. Compare the colors of vials A, B, and C (the control). What do your observations tell you about how BTB can be used as a chemical test for the concentration of carbon dioxide in a sample of gas? Write your suggestions on the data sheet.
What is happening?
BTB is a chemical indiccator that changes from blue to yellow in the presence of an acid. When carbon dioxide is bubbled through the BTB solution, some of it dissolves and forms carbonic acid. That more carbon dioxide in a sample, the more carbonic acid will form in the solution, and the yellower it will appear.
Part 2: Human Breath and Car Exhaust
1. Predict. On the data sheet, write your predictions by listing the four gas samples—human breath, pure CO2, room air, and car exhaust— in order, from highest to lowest CO2 concentration.
2. Prepare test vials. Make a data sheet as shown on this page. Position vials A, B, and C from the previous experiment on the new data sheet. Use the graduated cylinder to fill two additional vials with 15 ml of BTB solution. Place these on the circles for vials D and E.
3. Collect Sample D—human breath. One team member blows up a balloon and uses a string to measure its circumference until it is the same size as the other balloons. Twist the neck of the balloon and tie it so the gas does not escape. Record the color of the balloon as Sample D.
4. Test Sample D. As before, use the straw to bubble the gas in the balloon through the BTB solution in vial D. Observe any color changes and record them.
5. Collect Sample E—Car Exhaust. Go outdoors with your teacher to collect a sample of car exhaust. Each team needs a balloon, a string for measuring, and a twist-tie. Your teacher will provide a funnel made from a manila folder to channel gas from the exhaust pipe into your balloon. While your teacher starts the car, decide who in your team will actually collect the sample. Stand in a safe area, where you will not be in danger of being hit by passing cars.
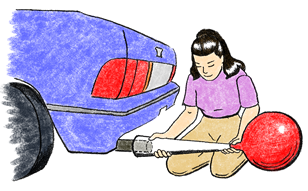
When your team member has collected a large sample of gas, allow some exhaust to escape, using the string to measure the circumference of the balloon so it is the same as the other balloons. If too much gas escapes, get another sample. Secure with a twist-tie.
Movie of capturing car exhaust – 2co2exp-gettingCarExhaust.mp4.
6. Test Sample E. As before, use the straw to bubble the gas in the balloon through the BTB solution in vial E. Observe any color changes and record them.
7. Record the results. What does the color of the five vials tell you about how the concentration of carbon dioxide in the four samples of gas? Write your results on the data sheet. (Note: Keep the vials of BTB. You will need these solutions for the next part of the investigation.)
8. Compare results with predictions. In science, its useful to predict because we become aware of our expectations. It is just as valuable to prove yourself wrong as it is to confirm your predictions! Compare the results with your predictions. Were you right or wrong?
Part 3:
Measuring Carbon Dioxide
Now we’ll measure the percentage of carbon dioxide gas in each of the samples.
1. Slowly add dilute ammonia to vial D, drop by drop. Count the number of drops needed to return the solution in vial D to the same color as the control vial (C). Shake the contents of the vial when the solution is close to the blue color of the control vial to thoroughly mix the contents. When the solution remains the same deep blue of the control vial, record the number of drops. This process is called titration.
2. Use the titration procedure on vials A, B, and E in the same way. Add the ammonia last, drop by drop, to the vials that are very yellow in color. They may require up to 100 drops to turn them back to the same color as the control vial.
Note: If the vial is about to overflow, pour the contents into a large, clean container, and continue adding drops. In that case, the color of the solution will become very pale. Add water to the BTB control vial so that the volumes of the two solutions are about the same; then you will be able to compare the color of the test solution with the color of the control vial.
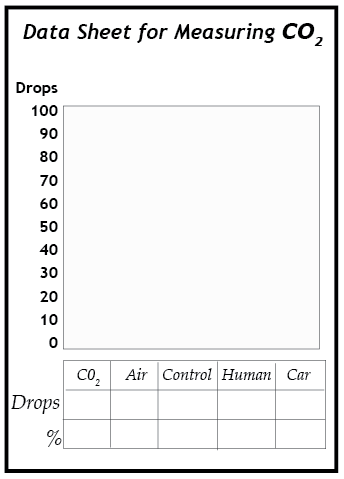
3. Analyze the results. The number of drops of ammonia required to neutralize the solution is proportional to the concentration of carbon dioxide in the gas sample that was bubbled through the solution. For example, if it required 90 drops to neutralize the vial from Sample A (pure CO2), then a sample that required 45 drops to neutralize had a concentration of about 50% CO2. Write down the percentage concentration of carbon dioxide in each of the samples.
4. Graph your results. When you have finished testing vials A, B, D, and E, make a bar graph showing how many drops were required to turn each of these solutions back to the same color blue as the control vial. Be certain to label both axes of the graph.
QUESTIONS
5.5 If a gas sample is suspected to contain CO2 but its presence is not indicated by the BTB test, what conclusion can you draw?
5.6 What does this experiment tell you about the concentration of CO2 emitted in animal breath and vehicle exhaust? (Compare them.)
5.7 What additional information would you need to judge how much CO2 animals and vehicles each contribute to the total atmospheric concentration of CO2?
5.8 Currently there are about 180,000,000 gasoline-burning vehicles on the road in the United States alone. In the future, there is likely to be many more. How do you think this may affect the concentration of carbon dioxide gas in the atmosphere?
Note: It is likely the sample of room air did not make any noticeable change when you bubbled it through a vial of BTB solution. This is because the chemical method of measuring the concentration of carbon dioxide is not sensitive enough for analyzing the small amounts of CO2 in room air.