PG2. Patterns in Populations
Chapter 2
{ Population Growth Contents }
Understanding the patterns of population change has become possible by creating mathematical models, or equations, that have the same characteristics as actual populations.
An equation that successfully models population growth must display some of the same patterns that we saw on Goat Island. Making a graph that is a visual expression of a mathematical equation can be very helpful in understanding the meaning of the equation.

PG2.1. Investigation:
Graphing Population Changes
Draw what you think a graph would look like to fit each of the scenarios below.
Scenario One: When the population was young, there was lots of food, room to grow, and no natural predators, so the population grew rapidly.
Scenario Two: After a few years of unchecked growth, the goats ate nearly all of the available food. Many goats died of famine. When the food grew back, their numbers increased, and they devoured the food again. The population oscillated up and down, above and below a certain average number.
Scenario Three: When the herd of goats was culled regularly, by sailors or later by dogs, the numbers of goats were kept low enough so they did not eat all of the food. The population grew to a certain maximum size and a population of healthy goats remained stable for a long time.
Question 2.1
Can you think of some other ways that the populations could grow and decline?
Get together with a group in your class and brainstorm all of the additional population patterns you can think of and list the limiting factors which affected these populations in all your scenarios. Be ready to show your graphs to other groups in your class and to explain your rationale in each case.
I. Feedback Loops
Another way to understand the reasons for changes in the goat population is to draw a concept map of the island ecosystem. If you do this, you will notice that the map has loops. These are called feedback loops. You probably have heard the term feedback when someone asks you a question such as, “How did you like the party? I would like your feedback.” Just answering a question is not necessarily feedback.
Only if the response changes the future situation is it proper to call the response feedback. For example, if the question was, “Do you think there were too many people at the party?” The response is feedback because it can change future actions.
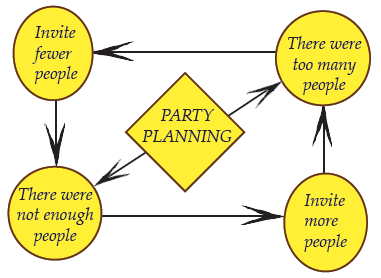
In the language of science, feedback only occurs when the result automatically controls the process of change—the output of a system controls its input. A room thermostat is often used in illustrating the principle.

PG2.2. Investigation: Human Thermostat
Materials for one or two people:
- container of hot water
- container of cold water
- container of room temperature water
- thermometer
- graph paper and pencil.
Take the temperature of the water in each container. The goal is to raise the temperature of the room temperature water exactly 5 degrees Celsius. Students must add enough hot water to achieve this goal, and maintain this temperature for 10 minutes, recording the temperature of the container every minute. The temperature should be placed on a graph, and the questions below answered.
Question 2.2.
Was it easy to maintain a temperature at one exact point?
Question 2.3.
What did the temperature actually do?
Question 2.4.
Do you think real thermostats also behave in this manner?
Question 2.5.
Diagram a feedback loop for your thermostat.
You have just completed a negative feedback loop! This kind of loop always maintains a balance, or in biological terms, homeostasis.
The type of feedback loop in a thermostat is called a negative feedback loop. A room thermostat is often a wall-mounted switch which works as follows:

Photo Dante Alighieri by via Wikimedia Commons.
There are two thermometers in the thermostat. One displays the temperature and is located in the cover. The other controls the heating and cooling systems and is simply a coiled bimetallic strip (two different types of metal laminated together). The metals in the strip expand and contract when they are heated or cooled, but each metal has a different rate of expansion, so when heated, the metal on the inside of the coil expands more and the strip tends to uncoil.
The center of the coil is connected to the temperature-adjustment lever, and a mercury switch is mounted to the end of the coil so that when the coil winds or unwinds, it tips the mercury switch one way or the other.
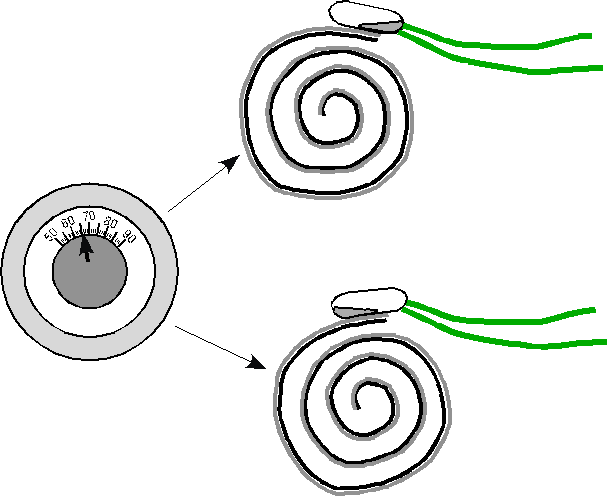
Your concept map of the thermostat may have looked like the one at right. The Thermostat represents a negative feedback loop which tends to keep the condition of the system stable.
In a thermostat, the metal coil expands and contracts with temperature changes, tilting the mercury switch back and forth, alternately turning on and off the furnace.

http://www.endocrineweb.com/thyfunction.html
There are negative feedback loops in your body which maintain stability in your living system. In biology, these negative feedback loops are called homeostasis. A good example is the interaction between your thyroid gland and your pituitary gland. The thyroid gland is under the control of the pituitary gland, a small gland the size of a peanut at the base of the brain (shown in the diagram).
When the level of thyroid hormones (T3 & T4) drops too low, the pituitary gland produces Thyroid Stimulating Hormone (TSH) which stimulates the thyroid gland to produce more hormones. Under the influence of TSH, the thyroid will manufacture and secrete T3 and T4 thereby raising their blood levels. The pituitary senses this and responds by decreasing its TSH production.
One can imagine the thyroid gland as a furnace and the pituitary gland as the thermostat. Thyroid hormones are like heat. When the heat gets back to the thermostat, it turns the thermostat off. As the room cools (the thyroid hormone levels drop), the thermostat turns back on (TSH increases) and the furnace produces more heat (thyroid hormones).
Question 2.6.
There are many other examples of negative feedback found in nature.
Can you think of any?
Find an example in a book or on internet and diagram it as a negative feedback loop.
Question 2.7.
Can you think of negative feedback in manufactured substances?
Make a diagram of one such feedback loop.
II. Negative and Positive Feedback
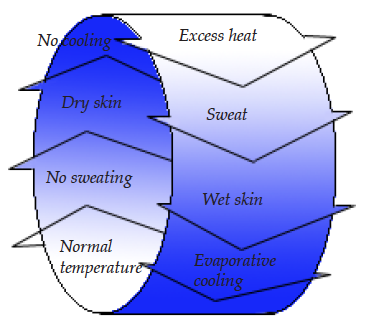
The kinds of feedback illustrated by all the examples used so far maintain many natural systems at proper working levels. It is called negative feedback because the change to the system is restored each time to the start by canceling out the change. Therefore, the change is added, but then subtracted. This keeps the system within bounds.
Question 2.8.
Can you explain how the amount of light coming into your eye controls how much more light comes in? Diagram this loop.
When the topic of feedback is discussed the idea of positive always being good gets turned on its head. Physicists long ago labeled positive feedback as feedback which added to the change in the system. This creates a situation which escalates until the situation is out of control.
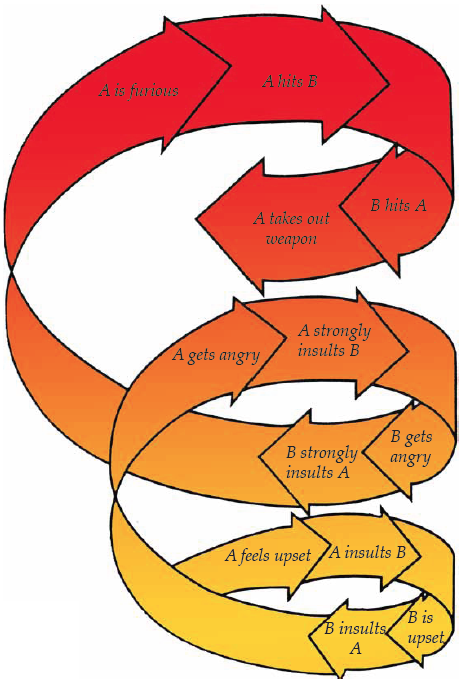
Ironically, the diagram on the right shows a positive feedback situation.
Question 2.9.
Using the Palestinian-Israeli conflict as an example, can you make a positive feedback loop?
Another example of positive feedback can be when the very condition that makes a place special makes it overused. Ecotourism is an example. These tours usually consist of groups of people who love nature who want to see some of the rare and beautiful wonders of the world. Our beautiful Yosemite National Park has been overrun by so many tourists that traffic jams and air pollution are the norm. So many people wish to view the beauty that they have spoiled the beauty.
Question 2.10.
Can you think of other natural wonders in danger from ecotourism? Make a positive feedback loop illustrating your choice.
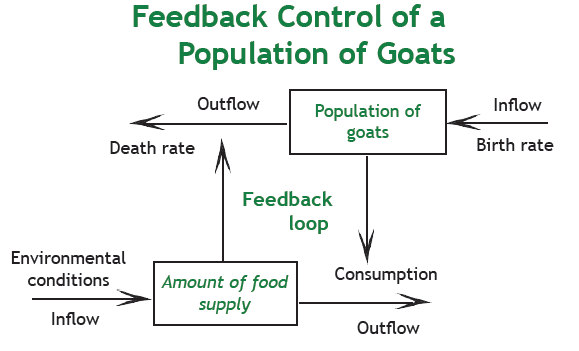
Let’s return now to Goat Island in the light of our new knowledge about positive and negative feedback loops. The diagram below shows the island ecosystem before the introduction of dogs.
Question 2.11.
Does the diagram show a positive or negative feedback loop?
Here are some clues.
Looking at the bottom line, we can see that the amount of food depends on the environmental conditions (which determine how quickly the food grows) and consumption (which determine how rapidly it is depleted). Looking at the top line, we see that the population of goats depends on the birthrate and death rate.
The connection between the upper and lower parts of the diagram is crucial. Looking at the vertical arrows, we can see that the population of goats affects the consumption of plants; and that the number of plants affect the death rate of the goats. The number of goats affects the food supply, which affects the number of goats, which affects food supply, and so on.
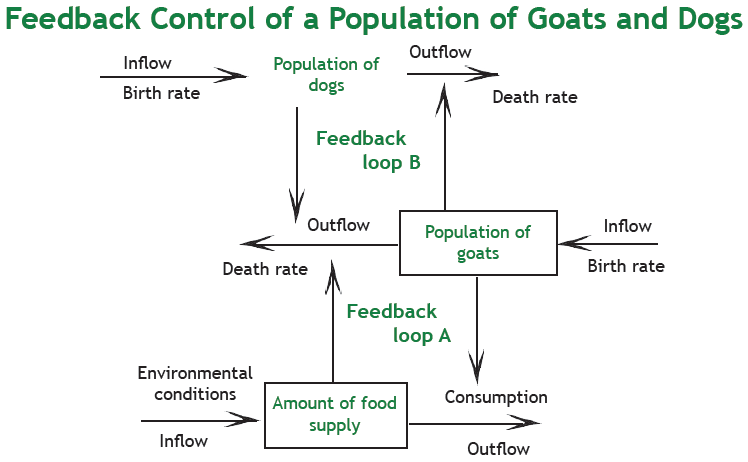
This second diagram shows what happens to the system when the dogs are introduced.
The bottom and middle layers are the same as before, but a top layer has been added. The death rate of the goats is now affected not only by the available food supply, but by the population of predators as well. The population of goats, in turn, affects the death rate of dogs. When the population of goats falls, the dogs have less to eat. There are now two feedback loops in the system; one linking the goats and plants, and one linking the goats and dogs.
The ecosystem map is a simplified picture of reality that can show us things. As an example, consider this question:
Question 2.12.
What would happen if a blight sweeps the island, and most of the plants that the goats depend on for food die?
How would that affect the goats and the dogs?
Try making a feedback loop for this situation.
Positive feedback loops often can result in the total breakdown of the system, and with living organisms, possible extinction or huge cycles of feast and famine. This is often the result of populations exceeding the carrying capacity of their environments due to the exponential growth in numbers.
III. What is Exponential Growth?
When populations grow rapidly because there are few limiting factors the growth is exponential. This happened on Goat Island at the beginning when there were no dogs and there was plenty of food and water for the goats. Exponential growth can have tremendous impacts.

PG2.3. Investigation:
How Many is a Billion?
The mind dulls when we are faced with large numbers that are outside of our daily experience. A million, a billion, what’s the difference? We tend to put them in the same category—large numbers, and let it go at that. But in dealing with human populations, as in dealing with money, a billion is a lot different than a million. For one thing, a billion (1,000,000,000) has three more zeros in it than a million (1,000,000). That means a billion is equivalent to 1,000 million.
Suppose your parents offer you two alternatives for your allowance: They will give you ten dollars every day for the year, or they will give you a penny the first day, and double the penny every day for a year. Which offer would you take? After you write your choice, you will do a one-month sample which will tell you which would be the better offer.
Take the copy of the calendar for February and a calculator, and write in each day the total amount you will have in your pocket. At the end of the month, write your grand total.
- Which is the best deal?
- What has happened here?
- Does this happen with some populations?
- What would the numbers be like if you substituted bacteria for pennies? The following investigation will help you to find out.

PG2.4. Investigation:
Bacterial Growth and Populations
Supposing that you grow bacteria in a petri dish, giving them the diet they like best. These bacteria can then divide approximately once every 20 minutes, doubling their numbers in that time period.
How many bacteria would there be in the petri dish at the end of 24 hours? (Answer this before you go on to the next question—write it down on a sheet of paper)
Of course, the number of cells after one full day of growth is interesting and surprising! There is another thing we must think about when such a great number of things, no matter how small, collect in one place. Cells like the ones we are talking about weigh something. For example, suppose that each cell weighs 1.1 x 10⁻¹⁵ pounds. That is .000 000 000 000 0011 pounds. That is very, very light.
First, try to guess about how many pounds of cells there would be at the end of 24 hours. Write the amount you guess on a sheet of paper.
Now try to figure out the weight of 4.3 sextillion cells after 24 hours.
If you multiplied 4,300,000,000,000,000,000,000 cells by the weight of one of them,
.000 000 000 000 0011, you would find the weight after 24 hours to be 4,730,000 pounds—over four million pounds!
4,730,000 pounds is about the same weight as 1300 large cars. Surely, the building holding all those cells would buckle under all that extra weight.
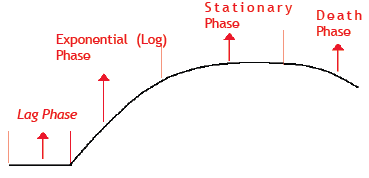
The growth of the bacteria is shown in the graph. The curve rises very steeply after 11 to twelve hours.
This is called exponential growth.
We know that many things can happen to keep the cells from growing that much or we would be buried by bacteria!
Question 2.13.
Can you think of what kinds of things might happen to keep the bacteria from filling the laboratory and then the world?
Write any ideas you might have in your notebook or on paper provided by your teacher.
A number of things might keep the cells from growing to such a great mass.
Did you guess that these are:
- Limited food supply
- Amount of space for growth
- Death rate of the cells
- Buildup of waste products
- Attack by or competition with other cells
- Weight of the mass of cells upon itself
There may be still other possibilities, too. The growing body of cells after ten hours or so may begin to change the temperature of the air around it. As a result, the temperature change may slow the growth rate.
We are talking here of things in the surroundings that may hold back the growth of the cells. The surroundings can only support a certain number of the cells. This is called the carrying capacity.
When that number is reached the population growth slows. Finally, it levels off. The same ideas would hold for humans and their population growth rate. Has this happened yet with the human population? How can you find out?

PG2.5. Investigation: What Do You Mean?
It’s Only a Drop in the Bucket!
Adapted from a lab by Fred Goldberg and James Shuman,
The Physics Teacher, October 1984, p.444.
Hypothesis: How much time do you estimate it will take to fill a bucket completely?
WRITE DOWN YOUR HYPOTHESIS ON PAPER.

Materials
An empty bucket, a number of different sizes of droppers and beakers, and a water supply.
Procedure
Your task is to begin by putting one single drop of water into the bucket, and then doubling that amount every 30 seconds until the bucket is full. Make sure that one member of the group is keeping track of the number of drops you use each time.
Graph your data.
What would be your independent variable?
What would be your dependent variable?
How long did it take your group to fill the bucket?
Was your hypothesis close?
Write your reactions to these results. Can you think of a real life situation for which this is an analogy? (Other than the water torture).
IV. Exponential Growth, Road Kill, and Sexual Reproduction
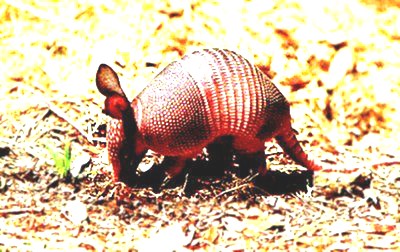
If you have traveled in the southern part of the United States and in Mexico, you may have noticed a particular animal which is often run over by automobiles. Why are these animals often the victims of drivers, and how do they manage to survive despite the large numbers being killed on the highways?
So far you have only applied the idea of exponential growth to nonliving objects or to organisms which reproduce by simple cell division. What about organisms which reproduce sexually like the goats and the dogs? Are they also subject to periods of exponential growth? Let us find out by meeting Mamadillo and Papadillo and some of their descendents.

PG2.6. Investigation: Adding Armadillos
(Adapted from ZPG’s Elementary Population Activities Kit)
In the wild, the nine-banded armadillo of North and South America lives about three years after reaching maturity, and mates and produces four litters of offspring each year. We will study one such armadillo family that begins with Mamadillo and Papadillo, and figure out what it looks like in three generations (when Mamadillo is a grandmother).
Mamadillo and Papadillo mate and have one litter a year for three years. Each litter is always four little female armadillos. We will assume that each female successfully finds a mate from some other litter.
Question 2.14.
What is the total number of baby armadillos borne by Mamadillo, her offspring, and their offspring, in the three years?
***Extra challenge!***
At this rate, how long would it take for there to be more than 2000 armadillos? Why aren’t there very many armadillos today?
Make a table like the one shown on the next page. Graph the population of armadillos from your results. Your independent variable is the time, and your dependent variable is the number of armadillos.
Remember that earlier in the book you read about what would happen if all the elephants born survived. Would the same situation occur eventually with armadillos? What limiting factors prevent us from being up to our arm pits in armadillos?
Table of Armadillo Population
Offspring of Mamadillo and Papadillo
[Starting with 2 armadillos: ..Mamadillo and Papadillo]
| Year | A Offspring from one year ago [D, prev. line] | B Offispring from two years ago [D, 2 lines up] | C Offspring from three years ago {D, 3 lines up] | D New offspring [4F, 1 line up] | E Deaths | F TOTAL females [1 + D + E] |
|---|---|---|---|---|---|---|
| 0 | —- | .—- | —- | —- | 0 | 1 |
| 1 | 0 | |||||
| 2 | 0 | |||||
| 3 | 0 | |||||
| 4 | ||||||
| 5 |
Question 2.15.
What might prevent the numbers of armadillos from being as large as you calculated? Refer back to the activity on the bacteria to get some ideas. Do the limits on bacterial populations also apply to armadillos, goats, or dogs? Discuss your ideas with your classmates and prepare to present them to the class.
Question 2.16.
What are some limiting factors caused by humans that are affecting plants and animals around the world?
V. How Do We Know Population Size?
We often talk about how big a population is and how fast it is growing, how many are surviving in a certain area, and whether or not a population is endangered. How can ecologists find out what is happening in a population in the wild? After all, they cannot go out into the field and see every individual organism. They can collect pelts and count them as they did with the lynx and the hare, or they can use what field biologist call “mark-recapture” You will perform an activity which shows how this works.
If weather and your terrain around the school permit, you can do a mark-recapture activity with real organisms other than grasshoppers. There are many suggestions on the internet.
Obviously, we normally do not go out and mark and recapture humans for study. (Can you think of a way that a mark-recapture activity could be done in a high school to estimate the total number of students?) Instead, we use a method called a survey. The Nielson ratings used for television are an example of this type of counting, as are telephone surveys where a computer randomly dials numbers to be called.

PG2.7. Investigation:
Grasshopper Mark and Recapture
Go outside in the autumn to estimate the population size or grasshoppers (or other animals).

