OZ7. Expedition to Antarctic
Chapter 7
{ Ozone Contents }
I. The National Ozone Expedition (NOZE) 1896
When Susan Solomon stood on the frozen wastes of Antarctica in the Spring of 1986 and watched her associates release a research balloon, she felt the heavy responsibility of being the leader of what was really a wilderness expedition. The group faced very difficult conditions all during their two-month stay.
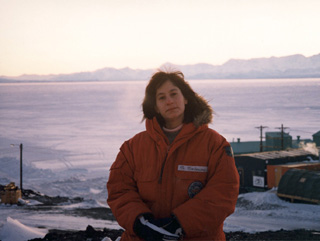
(Photo courtesy of Dr. Solomon.)
There were just a few hours of sunlight each day. Fierce winds and daytime temperatures of -45°C made launching the balloons a difficult and dangerous task. These grueling conditions made caring for the equipment and making accurate scientific measurements more difficult.
Under her direction, a team of twenty investigators was trying to find information that would help scientists decide among three different explanations for the lack of ozone over the South Pole in the Antarctic Spring that British scientists had discovered the year before.
II. Trying to Explain the Hole
Soon after the ozone depletion over Antarctica was discovered, people familiar with the problem had developed three quite different explanations for it.
The Sunspot Hypothesis
The ozone depletion is related to chemical changes in the upper atmosphere that resulted from an increase in sunspot activity noted in 1979. According to this hypothesis the increased solar activity would produce more oxides of nitrogen in the atmosphere. These molecules can react with and destroy ozone molecules. Normally oxides of nitrogen are more plentiful in the lower atmosphere where they are produced by automobile and industrial exhausts. In the troposphere, when combined with hydrocarbons, the nitrogen oxides can produce ozone during warm afternoons; however, within the stratosphere which has different temperatures, pressures, and chemical components, the gases would destroy ozone. If the sunspot idea were true there should be a large supply of oxides of nitrogen in the upper part of the stratosphere and the ozone loss would be greatest within this region.
The Air Circulation Hypothesis
The ozone depletion is a result of upper air circulation that occurs above the South Pole in late winter and early spring. This circulation isolates stratospheric air from the rest of the global circulation and there is an uplift of air from the troposphere to the stratosphere. This uplifted air would be ozone poor but rich in methane and nitrous oxide. If the dynamic hypothesis were correct, above average readings of methane and nitrous oxide would be found in the upper stratosphere where the ozone was depleted.
The Chlorine Hypothesis
The ozone depletion is produced by chlorine released from the chemical chlorofluorocarbons in the manner described by Rowland and Molina. If the chlorine hypothesis were true, atoms of chlorine (Cl) and chlorine compounds like chlorine monoxide (ClO), chlorine nitrate (ClNO3), and hydrogen chloride (HCl) should be found in the region of ozone depletion.
Dr. Solomon’s team did not have access to the airplanes that were used in later expeditions. This first expedition used ground-based spectrometers and measuring instruments carried aloft by balloons. By examining the spectrum of the light entering the spectrometers the identity of the molecules in the air above can be determined. The team arranged their instruments so that they could use both the small amount of sunlight available and the incoming moonlight to investigate the air above them.
III. About Susan Solomon
In 1977 Susan Solomon was a graduate student in chemistry at the University of California at Berkeley. During that summer, and several summers to follow, she worked at the National Center for Atmospheric Research (NCAR) in Boulder, Colorado. She said she wanted to work with “chemistry on a planet, not just chemistry in a test tube.” At NCAR she learned about the chemistry of the Earth’s atmosphere.
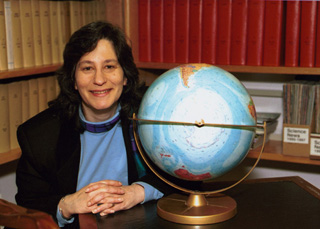
(Photo courtesy of Dr. Solomon.)
After she got her doctorate she took a job at the National Oceanic and Atmosphere Administration Laboratory (NOAA) which was just a few minutes from the NCAR laboratory in Boulder. She combined the expertise available at both laboratories into her own research work on the dynamics of stratosphere circulation.
The mystery of why the maximum depletion of stratospheric ozone should occur just as the spring Sun begins to rise over the Antarctic horizon was in her view, “one of the most challenging things that we’ve ever come across in atmospheric chemistry.” Her group was determined to find out which of the theories was correct.
IV. The Spectroscopic Record
The National Ozone Expedition (NOZE) scientific team assembled their results. They did not find a large supply of oxides of nitrogen in the upper part of the stratosphere and the ozone loss was not greater there than at the bottom. The evidence did not support the sunspot hypothesis of ozone depletion.
They examined their records for the amounts of methane and nitrous oxides in the ozone depleted air. For the air circulation hypothesis to be true, the air would have to be enriched with methane and nitrous oxide gases. This was not so. The air circulation hypothesis had to be discarded too.
(Photo courtesy of NOAA.)
What the spectrometers revealed was that in the region of ozone loss there were chemical compounds of chlorine, and the concentration of chlorine monoxide (ClO) was more than ten times higher than that found at the same altitudes outside the ozone loss area. The chemical hypothesis of ozone loss was confirmed. But questions remained. How large was the area of the atmosphere affected? Was the depletion of the ozone confined to the South Polar stratosphere? Why was it occurring in the Southern Hemisphere’s spring and not at other times of the year, or elsewhere on the planet?
V. What Over the South Pole? What in Spring?
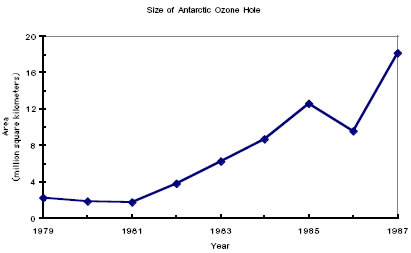
The size of the area of ozone depletion over the South Pole was determined in part by the flights of 1987 that were described at the beginning of this book. The shocking revelation was that the area of the so-called “ozone hole” was larger than the area of the United States, which is 9.36 million square kilometers.
Although journalists and even science writers refer to this region as the “ozone hole,” it is not actually a hole. Rather it is a region of the atmosphere in which the total column concentration of ozone is unusually low. The fact that this region remains in one place for several months, specifically over the Antarctic, lends itself to the shorthand description of a “hole” in the atmosphere.
Susan Solomon’s expedition the previous year had disproved the idea that the upper air circulation above the South Pole in spring was the cause of the ozone loss. Nevertheless the winds that circled the pole (called the South Polar Vortex) held the depleted air in one place for a period of time, and the extremely cold temperatures of the polar vortex allowed certain chemical reactions to take place. It was logical to predict that when the vortex circulation eased and the temperatures increased, as it did every summer, destruction of ozone would stop and the ozone-depleted air would disperse around the globe causing a reduction in ozone levels in other parts of the world. Later measurements would prove this prediction to be correct.
The question still remained, why was more ozone being destroyed in the spring than during other seasons of the year? The answer came from observations made during the 1987 flights and some chemical detective work. The chlorine, which is released when UV energy breaks CFCs apart, reacts with ozone to form chlorine monoxide (ClO). But other gases in the atmosphere react with chlorine monoxide to form stable molecules of chlorine. For example, methane (CH4) combines with chlorine to form hydrochloric acid (HCl). While hydrochloric acid can be toxic to living things, it holds the chlorine atom in place and prevents it from attacking more ozone. In the polar stratosphere there was sufficient methane to do the job. The loss of ozone should be minimal.
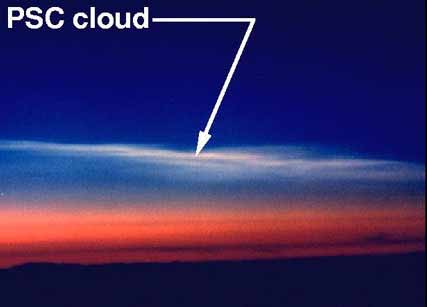
But the loss was not minimal. It was evident that the ozone was under severe attack and chlorine was the suspected chemical. Was something going on in the upper atmosphere above the Antarctic that was releasing the chlorine from the hydrochloric acid? Susan Solomon and her co-workers had a suggestion. During the 1986 expedition they observed the occasional presence of thin polar stratospheric clouds. Perhaps some chemical reaction that freed the chlorine was taking place in the clouds, which are composed of ice crystals. The ice particles might supply a surface on which chemical reactions could take place.
At first this hypothesis was disregarded since stratospheric clouds were thought to be rare. The amount of water vapor in the stratosphere is a thousand times less than it is in the troposphere where most clouds form. But researchers Owen Toon of NASA, Richard Turco of UCLA, and colleagues from the Max Planck Institute in Germany, proposed a modification of the cloud hypothesis.
They reasoned that the thin stratospheric clouds might not be water ice. Atoms of nitrogen might be floating around in the dark Antarctic sky. They combine with water and oxygen in a frozen form of nitric acid (HNO3), and a compound called nitric acid trihydrate (HNO3-3[H2O]). This molecule freezes at a higher temperature than pure water and could easily form in the polar stratosphere. The clouds formed from frozen nitric acid trihydrate particles are barely visible from the ground because there are fewer molecules per volume than water clouds.
Researchers at the NASA Ames Research Center confirmed that clouds of nitric acid trihydrate did form in the atmosphere over the South Pole in winter. They used aircraft equipped with laser radar (lidar) to find such clouds. They found them to be several kilometers thick and often extended over thousands of kilometers.
The rest of the story comes from the laboratory of Mario Molina, the man who worked with Sherwood Roland on the original investigation of CFCs and ozone. Molina and fellow scientists Ming-Taun Leu and Margaret Tolbert showed that hydrochloric acid and chlorine nitrate — the two molecules that hold chlorine away from the ozone — could react on the icy surfaces of nitric acid trihydrate. The result of the reaction is the liberation of the chlorine molecules, Cl2. Without that surface to react on, the chlorine releasing process would be so slow as to be negligible. It is the clouds of nitric acid trihydrate that speed up the reaction.
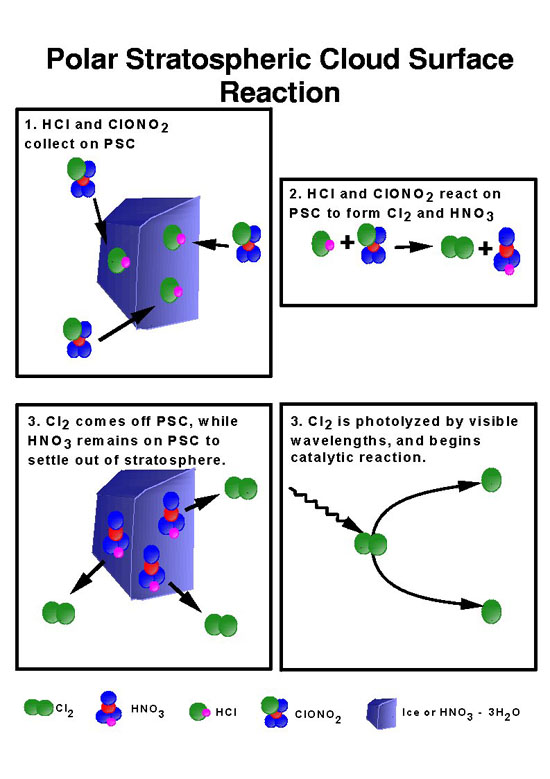
As the Sun begins to come over the horizon in September, bringing the Antarctic spring, things begin to happen quickly. The ultraviolet energy from the rising Sun melts the ice crystals and splits the chlorine molecules into individual atoms (Cl2 -> 2Cl) to attack the ozone. As Mario Molina found ten years before, the chlorine monoxide (ClO) that forms after the ozone is destroyed can react with itself and free the chlorine atoms to attack more ozone molecules. In October, as the sunlight grows in strength in the Southern Hemisphere, the reactions feed on themselves and ozone is destroyed in huge quantities. Each chlorine atom can destroy hundreds of thousands of ozone molecules until it is taken up in chemical reactions that produce either HCl or ClNO3. As the polar summer approaches and the atmosphere warms, the clouds become fewer and the polar wind vortex, which breaks up in mid-spring, no longer holds the ozone-depleted air over the pole. As the ozone-depleted air moves out and spreads over the Southern Hemisphere, the ozone hole disappears, but the result is an average ozone loss across the entire Southern Hemisphere of the Earth.
VI. Ozone Loss Over the Arctic
Although not as pronounced as at the South Pole, chlorine and bromine from Ozone Depleting Substances are destroying ozone in the north as well as the south. Observations during the late 1980s and early 1990s indicated that the ozone loss over the Antarctic is greater than over the Arctic. This is because the winter stratospheric temperatures are colder over the Antarctic and more of the nitric acid trihydrate clouds form over the South Pole. Additionally, the northern winter vortex air circulation is not as strong or as stable as the southern one, and it breaks up long before spring arrives. Large regions of the Arctic stratosphere show about a 6% loss. For comparison, the southern ozone hole averages a 50% or greater ozone loss during the spring.
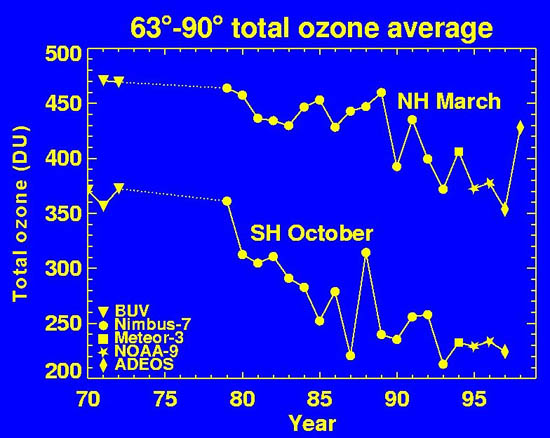
Yearly change in average ozone values at each of the poles during the spring time, the period with the greatest destruction of ozone.
(Graph courtesy of NASA. )
VII. Ozone Loss Over the United States
Not all ozone destruction takes place at the poles. Sulfuric acid particles can also free up chlorine atoms that reduce the number of ozone molecules. Volcanic eruptions can throw large quantities of sulfuric acid particles into the stratosphere. The variation of ozone in the upper atmosphere due to volcanoes is a natural phenomenon and ozone lost from that source is soon restored. But the ozone loss each winter over the poles is likely to increase as the stocks of CFCs already in the environment evaporate and make their way up into the stratosphere.
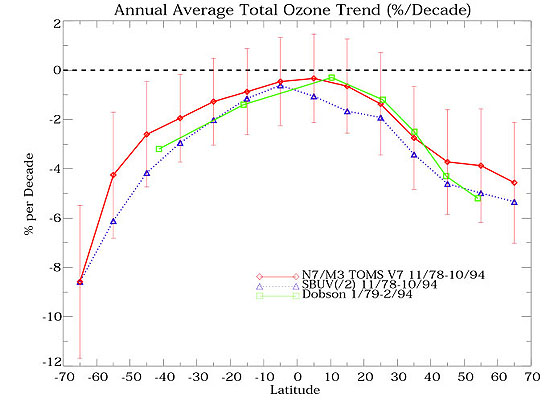
A loss of total column ozone in the range of 1% to 3% in the northern mid-latitudes (between Seattle and New Orleans) was reported between 1976 and 1986. Scientists used NASA’s ER2 airplane to make measurements all the way from Virginia to California in February 1989. The results showed that conditions were severe enough to have caused a 2% drop in ozone relative to that during the preceding October. More recent NASA data revealed a 4% to 5% decrease in the total column ozone over the U.S. between 1988 to 1990. During the winter months, the rate of ozone loss went so high that, if it remained at that value, the amount of ozone would be reduced by 8% in a decade. NASA said this ozone loss was not confined to the cold winter months, but extended into April and May as well. It also extended further south than originally thought, reaching the southernmost part of the United States.