The second annual GSS National Conference at the NSTA National Convention inPhiladelphia was on March 27, 2003, 9am to 4pm (Loews Philadelphia Hotel). Active GSS teachers made presentations about interesting techniques and strategiesfor implementing GSS in the classroom. There were also the following GSS workshops on Saturday, Mar 29:
- 9:30-10:30am, Save Money and Trees using Textbooks from the Digital Library. Philadelphia Marriot, Room 414/415. (Principal Presenter: Alan Gould)
- 11am-12pm, Global Systems Science: An Introduction to New World View. Loew’s Philadelphia Hotel, Room Commonwealth A1. (Principal Presenter: Alan Gould)
~~~~~~~~
2003 GSS CONFERENCE PROCEEDINGS
- Global Systems Science Overview by Alan Gould
- The Cutting Room Floor: What Didn’t Make it Into the GSS Guides and Why by Cary Sneider
- GSS & Maine’s Learning Results: Using the GSS Modules As A Curriculum Framework
by Dalene Dutton - Colors of Our World by John Pickle
- World of information by John Pickle
- All-Weather Testing of Natural and Artificial UV Protection by John Pickle
- Dynamic Equilibrium, Earlobes—A Study of Human Gene Frequencies, and Adding Armadillos
by Eloise Farmer - The Economics of E-textbooks by Alan Gould
~~~~~~~~
1. Global Systems Science Overview
Alan Gould, GSS Director
Lawrence Hall of Science
University of California
What is GSS?
- Global Systems Science (GSS) is an interdisciplinary course for high school students comprised of nine Student Books with Teachers Guides.
- The books may be used for a one-year integrated science course; or individual guides may be incorporated into existing high school biology, physics, chemistry, Earth science, or social studies courses.
Each Student Book has:
- Investigations to be done in class, lab, or home
- Issues pertaining to science and society
- History
- Recent science
- A “Field Trip” chapter featuring a visit to a facility where the science is happening
How was GSS created?
- NIGEC funds helped create a 1-year High School curriculum on environmental change.
- GSS started out as a single book called “Planet Under Siege”, but was later divided into 5 smaller books.
- NSF grant project allowed national field testing over a 3-year period with 125 High School teachers participating.
- Field test teachers met in summer institutes to share their results and experiences, as well as to contribute new ideas for investigations and materials to include.
Teacher feedback resulted in:
- Additional hands-on activities (Investigations).
- Further dividing the series into smaller volumes—9 in total.
- A Teacher Guide for each volume.
- Assessment tools and strategies outlined in the Teacher Guides.
How to get GSS Download free teacher guides and free sample student books from the GSS download page (password protected but password is free after filling our short registration form). http://lhs.berkeley.edu/gss/
The free sample books are not intended to be used in local reproduction at schools for use with classes. To acquire class sets of books for student use, use one or more of these options:
- Buy class sets of hardcopy books.
[Cost: $10-17 ea.] - Buy a license to “Self-publish” class sets of books. [Cost: $1-2/student]
- Buy a license to have students read the books on computers. [Cost: 1-2/student]
NASA Digital GSS Project
- Putting GSS online as part of Digital Library for Earth Systems Education (DLESE) was part of a NASA grant project of the Earth Science Enterprise.
- As part of that project, we are making software tools, Interpreting Digital Images, that lead students to understanding how to analyze satellite images for changes in Earth systems.
~~~~~~~~
The Cutting Room Floor:
What Didn’t Make it Into the GSS Guides and Why
by Cary Sneider,
Vice President for Programs,
Museum of Science, Boston
NSTA, March, 2003
Now that all nine Student Guides and Teacher Guides for the Global Systems Science course are complete and available online, it may be instructive to take one last glance at the ideas that did not make the final cut. For example, the first GSS prototype was entitled “Planet Under Siege.” It focused primarily on global warming, and emphasized dire consequences that were predicted if, in fact, the Earth is heating up. The scientists who reviewed the guide objected strongly to the title, pointing out that: 1) even if the planet is warming up, the planet itself is not in danger; 2) at the time—the early 1990s—the evidence was not yet conclusive that human activities were having a discernable effect on the climate; and 3) we needed to take a more balanced approach, letting our readers see the evidence, and make their own decisions. We changed the title to the more neutral, “Changing Climate.”
When our first group of 25 teachers came to Berkeley for a three-week institute on Global Systems Science, they pointed out that each of the Student Guides was far too long. In order to be used flexibly, the modules should be much shorter, and each should have fewer main ideas. We consequently rewrote and split “Changing Climate” into three guides—”New World View,” about systems thinking, “Changing Climate,” about global warming and the greenhouse effect, and “Life and Climate,” about the history of Earth’s climate and the evolution of life. Later, we created a concept map for the series, so that teachers could immediately see how the key concepts in each of the modules fit together. The concept map itself changed over time as we wrote, tested, and revised the entire series.
There were other changes too, though perhaps not as great as these. We knew that the concepts of negative and positive feedback were important, but the terms were somewhat counter-intuitive, and difficult to grasp in the abstract. Keeping in mind that these guides are for all students in grades nine to ten, we didn’t want to alienate students, and teach them that science is HARD. So, we removed this section from the introductory guide and wove the ideas into the other guides in the context of actual global issues that illustrated positive and negative feedback.
Among the most difficult changes to incorporate involved the constant flow of recent scientific findings. The science of global systems is cutting edge; and there are always new findings to incorporate. One approach is to “update” the guides by putting these new findings onto our web page. Another is to “revise” the guides, by incorporating new findings into the text. An example is the many recent discoveries of early human remains in Africa. An article about these changes by Jeremy deSilva will be published in October, 2003, in The American Biology Teacher, and overhead transparency masters illustrating different theories of human evolution will be placed on the Museum of Science website. We expect to link these ideas to update the GSS Student Guide “Life and Climate.” Later we can update the guide itself to incorporate these new ideas. If we are successful, the process of updating and revision will never stop—so that the Global Systems Science series itself exemplifies of the nature and process of science.
~~~~~~~~
GSS and Maine’s Learning Results:
Using the GSS Modules As A Curriculum Framework To Meet State Standards
by Dalene Dutton
MMSA NASA Teacher Associate
With so little instructional time, and so much to cover in today’s classrooms, a curriculum with a strong match to whatever standards students will be held accountable for is needed. For Maine, and many other states with populations too small to create a market for commercial publishers, there is a lack of curricular materials that focus on the state standards. Many materials use the National Science Education Standards, which share many areas with Maine’s Learning Results, but there are areas where the two sets of standards differ.
No matter how great a set of standards is, they are not a curriculum. Curriculum should be coherent, and connected to the students’ lives. Standards often have groups of performance indicators listed under a common heading, but they are not connected by a storyline, something for students to continually connect to as they attempt to make meaning out of what they are being exposed to. Without an explicit storyline to scaffold ideas, students are less likely to retain concepts. Lists of indicators assigned to individual grade levels or classrooms can lead to “activity mania” where the items are addressed by separate, sometimes totally unrelated activities. This leads to a disjointed experience for students, even when the individual activities are very well suited for the particular concept. A framework is needed to ensure coherence.
Global Systems Science modules can provide the framework for a coherent program that is focused on standards. GSS materials are based on National Standards, and can be supplemented to meet a state’s individual standards. The quality of the text and supplemental activities is exceptional, they are provocative, and they deal with issues that are current. The modular design increases their flexibility, and the electronic format makes them extremely affordable.
In order to adapt the GSS modules to meet state standards you must first deeply understand what the state standards are. In order to start to create a program to teach Maine’s Learning Results based on the GSS modules, I started by studying the standards in detail. I searched for areas where the state standards mesh well with the National Science Education Standards, Science For All Americans, Benchmarks For Science Literacy, and The Atlas of Science Literacy. I surveyed the research on misconceptions and instructional implications associated with the ideas covered in the state standards, and created documents that summarized all of the information for each performance indicator studied.
This may seem like an excessive amount of work, but like many sets of state standards, Maine’s Learning Results are a series of one to two sentence statements that are often interpreted in various ways. I wanted my interpretation to be based on documents that have been scrutinized by well-respected experts in science, education, technology, and human development and to be informed by research into how students learn. I also wanted to be very clear about the ideas that the curriculum should explicitly address, in order to make sure that the result was extremely focused on the standards. I wanted to “nail” the state standards, rather than gloss over some of the ideas in the standards and really focus on others.
For example, in The Maine Learning Results, Standard D: Continuity and Change (at the 9-12 Level) Performance Indicator #2 reads: Describe why the offspring of sexually reproducing species have different survival rates than those of asexually reproducing species under a variety of conditions. Describe the advantages and disadvantages of each.
After studying the recommendations of the national documents I expanded on the statement, creating the following:There is enormous variety among living things in the world. In the context of heredity, the focus is on the origin of variation. Differences between individuals within the same species, and even within the same family, result from the recombination of parents’ genes or mutations of genes in reproductive cells. Sex is a mechanism that introduces genetic variety within a population. The presence of a variety of genetic combinations increases the odds that the population will contain some individuals with the genetic potential to thrive under new conditions. Because in asexually reproducing populations the entire population has the same genome (except for differences due to mutation) there is less chance of the population having the needed genetic information to thrive under new conditions.
I then attempted to identify the specific ideas that are necessary for a student to fully understand in order to achieve an understanding of the concepts in this performance indicator:Specific Ideas from MLR Standard D(9-12)#2:
- The sorting and recombination of genes in sexual reproduction results in a great variety of possible gene combinations from the offspring of any two parents.
- The variation of organisms within a species increases the likelihood that at least some members of the species will survive under changed environmental conditions.
- Offspring of asexual organisms (clones) inherit all of the parent’s genes.
- New heritable characteristics can result from new combinations of existing genes or from mutations of genes in reproductive cells.
- Some new gene combinations make little difference, some can produce organisms with new and perhaps enhanced capabilities, and some can be deleterious.
- Some characteristics give individuals an advantage over others in surviving and reproducing.
- Asexually reproducing species do not require another individual to be present in order to be able to reproduce.
- Sexual reproduction requires two individuals, each of which contributes a portion of the genetic material that is passed on to the offspring.
The Maine Learning Results do have any specific supporting documentation to address instructional implications, but the information is available elsewhere. (NSES, Benchmarks, Driver et al.’s Making Sense of Secondary Science.) I summarized the instructional implications that I wanted to keep in mind:
- It is important that students understand the important distinction between the selection of an individual with a certain trait and the changing proportions of of that trait in populations. This requires some understanding of the mathematics of proportions and opportunities for the to reflect on the individual versus population distinction in other contexts.
- One misconception that teachers may encounter involves students attributing new variations to an organism’s need, environmental conditions, or use. With some help, students can understand that, in general, mutations occur randomly and are selected because they help some organism survive and produce more offspring.
- Other misconceptions center on a lack of understanding of how a population changes as a result of differential reproduction (some individuals producing more offspring), as opposed to all individuals in a population changing.
- Pupils tend to see adaptation in a naturalistic or teleological sense: undertaken to satisfy the organism’s need or desire to fulfill some future requirement. Students confuse an individual’s adaptation during its lifetime with inherited changes in acquired characteristics. Many students believe that individuals can adapt to change in the environment if they need to, and that these adaptations are inherited.
- Unless students clearly understand the differences in sexual and asexual reproduction, they may be unable to understand sexual reproduction as being the source of variation in a population.
- Studies involving advanced high school and college students have shown that large proportions do not understand the interaction of genes and environment. Examining specific cases can help.
- Pupils have some idea of the randomness of inheritance–that sometimes offspring are like their mother, sometimes like their father, sometimes both. However, pupils rarely show evidence of applying the concept of chance and probability to inheritance and evolution. The concepts of randomness and probability are not held by many students even after advanced courses.
Armed with all of this detailed information, I could then analyze the Global Systems Science Modules for true alignment. This is much more than a topical match, but yields detailed information about the specific ideas and the extent to which they are covered by the materials. I created an analysis document that looks like this (click to enlarge):
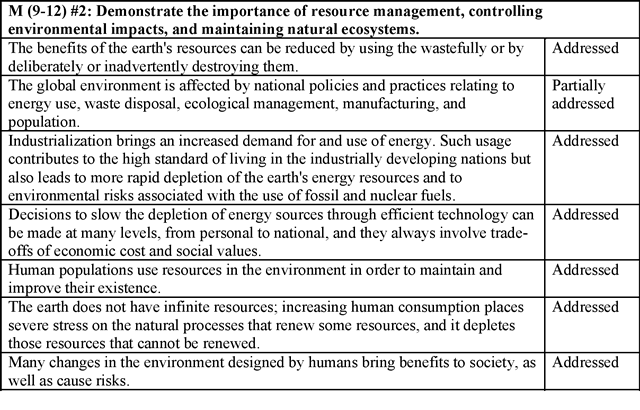
(Note that this analysis is for a DIFFERENT performance indicator than the one that I “unpacked” above.)
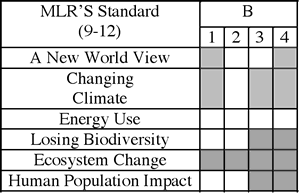
Once this analysis was completed, gaps in coverage of the Maine Learning Results can be identified, and focus areas for supplements targeted. I created a graphic organizer that shows where there are gaps. For some of the content standards, the modules did an excellent job on their own, and will require no supplements:
~~~~~~~~
Colors of Our World
by John Pickle,
Museum of Science, Boston
A great deal of time is spent working with young students in making colors with paints, yet there is another world of color youth and adults need to explore: the colors made by mixing light. Ask most people what happens when they mixed all of their paints in their paint set together, and there is a universal agreement that a dark color will appear. And most people recognize that white sunlight passing through a prism creates a rainbow of color, but few of us ever think of this discrepancy: mixing many colors in paint make a dark color and mixing many colors in light makes white.
Colors made by mixing light are the foundation of color computer and television screens, and are a key component in today’s information technology. Yet we don’t often have the opportunity to play and experience how millions of colors are made by mixing varying amounts of red, green, and blue light. Several activities were developed in the “Interpreting Satellite Images” learning materials to allow people to explore the colors made by adding light.
The first computer program, TriColor, lets people make over a million colors by changing the intensity of red, green, and blue light on the computer screen. Intensities are based on percent, with 0% meaning no contribution and 100% representing maximum intensity. One of the first observations are that the intensities of red, green, and blue do not add up to 100%. For example, black is made with 0% red, 0% green, and 0% blue, and white is made with 100% of red, green, and blue. You might want to think of the three intensities as coordinates of the final color in a color cube with axes of red, green, and blue. For a good visual model, see http://www.colorcube.com.
The goal of exploring colors made by light is for people to be able to identify the intensity components in red, green, and blue because this skill is critical when interpreting satellite images. Intensity measurements of invisible wavelengths of light are displayed as red, green, or blue, and the colors of the resulting image represent the surface and/or atmospheric characteristics. In order to practice identifying the intensity components of colors, Game_TriColor allows people to play the computer or a classmate in identifying either randomly generated colors or those created in secret. Hints are provided after each guess to provide guidance.
There are two key skills required in identifying the colors with red, green, and blue:
(1) matching the lightness of the color (the greater the intensities, the lighter the color and conversely, the darker the intensities, the darker the color) and
(2) the mathing the relative contribution of red, green, and blue. For example, pink is a very light color, so there are large amounts of red, green, and blue but the dominant color is red. Therefore, a nice pink can be made with 100% red, 80% green, and 80% blue. To help students measure their skills, Report_Tricolor keeps track of the guesses made for ten randomly generated colors, and a report is generated at how well they identified the overall intensities and how well they identified the dominant and least dominant color. The report appears on the computer screen, is saved to a file with the student’s identification, and may be printed as an assessment.
~~~~~~~~
World of Information
By John Pickle,
Museum of Science, Boston
Earth orbiting satellites have dramatically expanded our observations and understanding of our ever-changing planet, creating the field of global systems science. Satellite imagery is one of the most powerful tools available to global systems scientists who are striving to understand Earth’s changing ecosystems and the consequences of land-use policies and practices. The visualization and analysis tools provided in “Interpreting Satellite Images” (ISI) activities may be applied to a wide array of digital imagery (satellite images to pictures taken by students) and graphical data available on the Internet.
The six activities developed in ISI are separated into three units. Each unit builds upon the previous sequence, and the order should be followed:
- Unit 1—Explore critical concepts in color, imagery, and light;
- Unit 2—Develop skills in manipulating and analyzing satellite imagery; and
- Unit 3—Apply the concepts and skills to interpreting satellite imagery.
Extension materials are included if students need additional material to explore concepts or develop skills. The materials are designed so students can explore images of their selection or creation independently and quantitatively, ultimately supporting all nine books in the Global Systems Science series.
| Unit 1 | Unit 2 | Unit 3 |
| Goal: Explore concepts in color, imagery, and light | Goal: Develop skills in manipulating and analyzing satellite imagery | Goal: Apply the concepts and skills to interpreting satellite imagery |
| Activity 1: Three-Color Light | Activity 4: Displaying Invisible Light | Activity 6: Satellite Image Analysis |
| Activity 2: Pictures and Colors | Activity 5: Using Analysis Tools | |
| Activity 3: Exploring and Measuring Light |
The six activities in this module are designed to isolate and then integrate key concepts and skills in order to learn to manipulate and interpret satellite images. Software programs (see summary chart that follows) and hands-on activities have been designed so students develop concrete understanding of color, light, and imagery. Seven software programs directly support these activities. An additional six programs either provide extension activities for students to continue exploring concepts or skills or are advanced analysis tools that may be applied to an large, generic body of digital imagery available on the Internet or created with a digital camera.
Software Summary Chart
| Software | Summary |
| MixingColor | Compare how colors mix using pigments and light |
| TriColor | Explore the colors created by mixing varying intensities of red, green, and blue light |
| Game_TriColor | Test your ability to identify the intensities of the red, green, and blue components of a color on the computer screen. Colors are created by playing another person or against the computer. |
| Report_TriColor | A report on how well students identify the intensities or red, green, and blue for 10 randomly generated colors is generated on-screen, in a text file, and printed for teacher or student use. |
| PixelView | Change the size of pixels for any digital picture (jpeg, gif, tiff, or pict)„called pixelation |
| ColorPicture | Separate the red, green, and blue color components of any digital picture (jpeg, gif, tiff, or pict) |
| SplitColors | Advanced manipulation of the red, green, and blue color components of any digital picture (jpeg, gif, tiff, or pict) |
| ImageAnalysis | Using advanced tools, analyze the spatial and color information within any digital image (jpeg, gif, tiff, or pict) |
| MergePictures | Combine time-lapse pictures onto one image |
| FalseColor | Similar to ColorPicture, manipulate the color display components of a Landsat image |
| SurfaceType | Using simplified tools, analyze the spatial and spectral information within a standard color composite Landsat image |
| VegetationAnalysis | Using advanced tools, study the spatial and spectral information within a time-series of Landsat images |
| LandSatAnalysis | Using advanced tools, analyze the spatial and spectral information within a standard color composite Landsat image |
~~~~~~~~
All-Weather Testing of Natural and Artificial UV Protection
[Outline]
by John Pickle,
Museum of Science, Boston
See also…
Instructions on how to build the equipment for this activity
Overview
Activity supports GSS “Ozone”What is UV?
- Harmful effects of UV
- Dealing with weather effects on weather-dependent experiments
- Testing natural and artificial UV protection
What Protects Eyes and Skin?
- Natural Protection
- Hair
- Artificial Protection
- Sunscreen
- Clothing and Hats
- Sunglasses
Testing UV Protection
- Sunprint Paper Test
- Requires Exposing to UV
- Natural Source of UV: Sun
- Clouds and Precipitation Block UV from Ground
- Variable so affects experiments during class
- Create Artificial Source of UV that provides consistent intensity while providing structure for controlled experiments
- Inexpensive – Total Cost = $3-5, Relatively Easy to Build, Relatively Rugged
- Provides Opportunity to Run Experiment Any Time
- Allows Students Develop Controlled Experiments Quickly and Easily
UV Lights—Equipment for All-Weather Testing of Natural and Artificial UV Protection
Objective: Make a pair of UV lights for controlled experiments in exploring the protection of sunscreens, sunglasses, clothing, hair, and other materials from the SunÍs ultraviolet radiation.Materials per pair of lights:
- 2 UV LEDs from All Electronics Corp. (operates best 3.7 volts and 20 milliamps; $1.75 each at — http://www.allelectronics.com/cgi-
bin/category.cgi?category=search&item=
ULED-1&type=store) - 1 270-ohm resistors ($0.50 each at All Electronics Corp. — http://www.allelectronics.com/matrix/
One_Half_W_Resistors.html) - 1 9-volt battery and holder (available at most local electronic stores)
- 3 3-inch pieces of plastic covered wire with 0.25 to 0.5 inches striped from each end
- base of plastic sandwich-size container (lid could be used to protect LEDs during storage)
- screw-type wire connectors (smallest size) available at most local electronic and hardware stores for less than $0.10 each)
- 1 rubber band
If you can’t get the above UV LEDs, you will need to recalculate the resistance of the resistor.
For example, to obtain the required resistance for the above UV LEDs:
(9 volt battery – 3.7 volts required for LED) / 0.020 amp = 265 ohms (270 ohms is close enough and is commonly sold in electronic stores)
Connecting the Wires
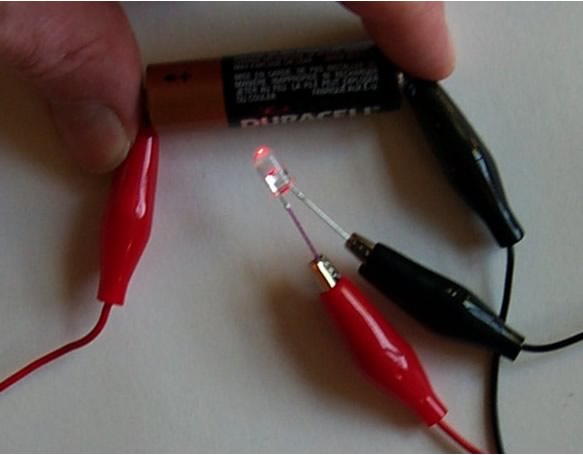
First, Light Emitting Diodes (LEDs) require electricity to run in the proper direction Æ they will not work if wired backwards! So remember, the shorter wire of the LED must be connected to the negative charge, and the longer wire of the LED must be connected to the positive charge. Or, red to long, and black to short.
You will be making a parallel circuit – where the red wire coming from the battery is connected to each long leg of the LEDs. A 270-ohm resistor is connected to the short leg of each LED, which in turn is connected to the black wire coming from the battery.
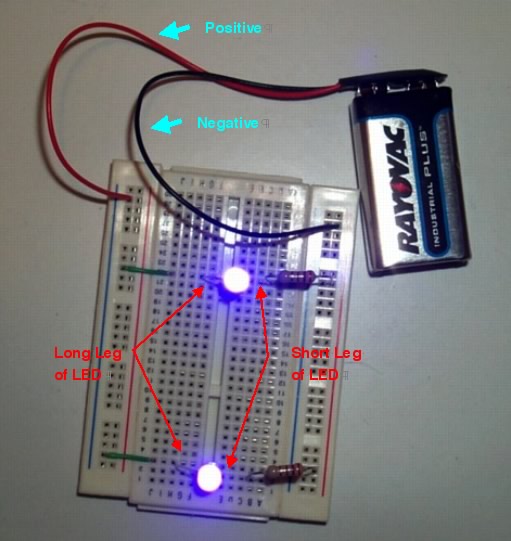
Building Steps
Working with the plastic container, first use an awl, pin, pen, or ice pick to poke 4 holes in the plastic container. It might help to make a paper template so the spacing for each set of 2 holes is placed equidistant from the edges of the container. Each set of 2 holes are approximately 0.5 inch apart.
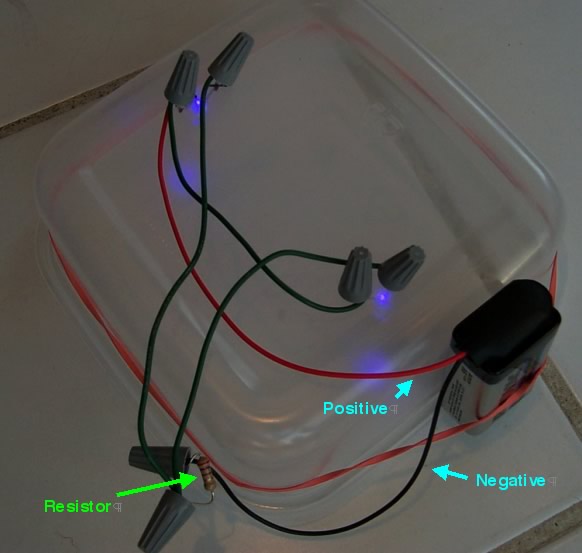
Second, place the LEDs on the inside of the box and push the wire leads through the holes.Third, connect the wires to the LEDs, resistor and battery.
- a) Wrap the POSITVE (red) battery wire to the long lead of one LED.
- b) Wrap one end of a 3-inch piece of wire (green in this case) with the red battery wire and the LED.
- c) Twist a wire connector around the three wires.
- d) Wrap the free end of the green wire to the long lead of the second LED; twist a wire connector around the two wires.
- e) Connect one end of each of the remaining two 3-inch pieces of green wire to the short leads of each LED; twist a wire connector around the two wires.
- f) Connect the two free ends of the green wires around a lead from the resistor (any end of the resistor will work). Twist a wire connector around the three wires.
- g) Connect the black wire from the battery to the free end of the resistor and twist a wire connector around the two wires.
Finally, put the rubber band around the outside of the box and secure the battery to the box with the rubber band. To operate, connect the battery leads to the battery.
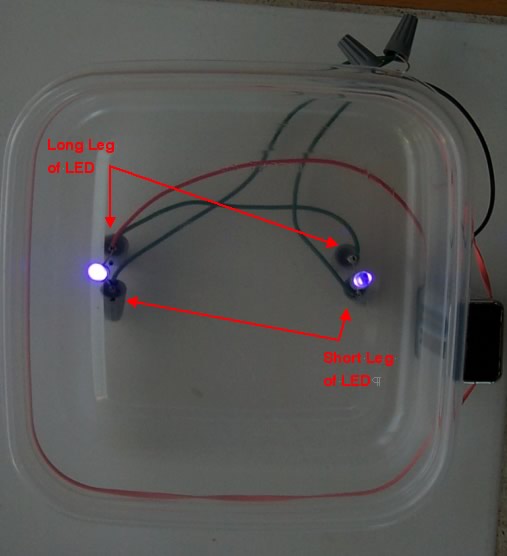
Make sure the LEDs are pointing directly down when operating. To secure the LEDs in place you can pinch together the LED leads that poke out of the box – but do not let the wires touch!
~~~~~~~~
Presentations by
Eloise Farmer,
Torrington High School
New Hartford, Connecticut
Dynamic Equilibrium
[also found on the following web page: http://www.cssaonline.net/equilibrium.htm]
Introduction
Materials
Clear plastic containers (2), paper cups, water, meter stick.
Methods
Pour water into the plastic containers until the water level is the same in each container. Measure and record the depth of the water. Obtain two paper cups and submerge each in a separate container of water. When given a signal by one of the lab team members, simultaneously pour each cup of water into the other container. Repeat this process four more times, then measure and record the depth of the water. Then repeat the cycle of five transfers two more times, and measure the depth of the water after each cycle. Record your observations.
Pour all of the water into one of the containers. Measure and record the depth of water in that container. Proceed as before. At the beginning, one cup will be empty and the other full. Simulate the pouring with the empty cup at each transfer. As water is put into the empty container, gather as much water as possible in the cup for each transfer. Measure and record the depth of the water after each five transfers, and continue until twenty transfers have been made. If time allows, do the whole procedure again with different starting depths. Dispose of the water and return the materials to the front desk.
Laboratory Report
Prepare a data table to record the changes in the depth of the water in both containers under each set of conditions. The table should have five columns: Time, TriaI Container I, Trial Container 2, Tria1 2 Empty Container, Tria1 2 Full Container. You may add more columns if you collect more data.
Answer the following questions:
- What happened to the water levels in trials 1 and 2?
- How would you describe the shape of the graphs from each set of data?
- In trial two–one of the cups initially has no water in it–what happens to the amount of water transferred from the empty side to the full side as the trial continues?
- Are the final water levels in each trial the same? Why?
- What would happen to the water levels in each system if you continued to transfer equal amounts of water indefinitely? Why?
Eloise also presented Student Investigations in the GSS Population Growth Book:
— Earlobes: A Study of Human Gene Frequencies in Chapter 3
— Adding Armadillos in chapter 2
~~~~~~~~
The Economics of E-Textbooks
Alan Gould, GSS Director
Lawrence Hall of Science
University of California
The rising cost of hard copy textbooks is providing a steadily increasing force that will ultimately lead to widespread use of electronic textbooks in schools. Electronic textbooks consist of computer programs or documents that can be either downloaded from the worldwide web or provided on CD-ROMs. Students can load these files onto their computers at home and use them directly on computer display.
A few years ago a serious barrier to the e-textbook concept was that many students did not have computers at home that they could use. However, this condition is rapidly changing and it is becoming ever more possible for students to take CD-ROMs for use on home computers, reducing the number hard copy books needed. Only those students without home computer access must absolutely have the hard copy books.
We will look at the cost advantage in detail, but aside from cost advantage, using e-texts allows:
- freedom from hauling heavy textbooks to and from school and the health issues and back problems associated with carrying a load of heavy books.
- convenience of computer search tools—the “Find” function—to locate specific text passages.
- ability of the reader to adjust font size or page magnification for ideal readability and potential to reduce eyestrain.
But pure economics is overhwelming. Let’s assume that a whole year course can be designed using five of the GSS volumes. To have enough books for three classes of students can require over 100 of each volume at $10/book. That amounts to 100 students x $50/student = $5000.
All nine GSS books are on a single CD-ROM costing only $8 each. So for the same 100 students, cost is
100 students x $8/student = $800.That’s about 1/6 the cost of hard copy books!
For license to use GSS books on computer displays (at school or at home), the cost is even less: $.45/volume/student or $2.25/student. So for a hundred students to download the books from the GSS website would cost:
100 students x $2.25/student – $225
which is less than 1/20 the cost of hard copy books.
The impact on school budget is hard to ignore. Ecological ramifications are sometimes not obvious to see. Clearly hard copy books take a toll in use of forests for paper-making. There is also shipping of books that require fossil fuel burning in trucks. On the other hand, CD-ROMs are a plastic product—non-renewable resource, though the bulk of material needed is a tiny fraction of the amount of wood needed to make hard copy books. Just downloading files from the worldwide web may seem the most environmentally benign, but even so, there is energy cost in running computers to use the e-textbook files.
We have not done real study on the relative the ecological impacts of hard copy vs e-textbooks, but as we already noted, economic impact alone is a powerful incentive to move away from hard copy books.
Are your students ready for this leap? Is your school budget ready? Are you ready?

